Introduction
As cloud-native architectures scale across thousands of containers and virtual machines, Java performance tuning has become more distributed, complex, and error-prone than ever. As highlighted in our public preview announcement, traditional JVM optimization relied on expert, centralized operator teams manually tuning flags and heap sizes for large application servers. This approach simply doesn’t scale in today’s highly dynamic environments, where dozens—or even hundreds—of teams deploy cloud-native JVM workloads across diverse infrastructure.
To address this, Microsoft built Azure Command Launcher for Java (jaz), a lightweight command-line tool that wraps and invokes java (e.g., jaz -jar myapp.jar). This drop-in command automatically tunes your JVM across dedicated or resource-constrained environments, providing safe, intelligent, and observable optimization out of the box.
Why Automated Tuning Matters
Designed for dedicated cloud environments—whether running a single workload in a container or on a virtual machine—Azure Command Launcher for Java acts as a fully resource-aware optimizer that adapts seamlessly across both deployment models.
The goal is to make JVM optimization effortless and predictable by replacing one-off manual tuning with intelligent, resource-aware behavior that just works. Where traditional tuning demanded deep expertise, careful experimentation, and operational risk, the tool delivers adaptive optimization that stays consistent across architectures, environments, and workload patterns.
The Complexity of Manual JVM Tuning
| Traditional Approach | jaz Approach |
|---|---|
| Build-time optimization and custom builds | Runtime tuning that adapts to any Java app |
| Requires JVM expertise and manual experimentation | Intelligent heuristics detect and optimize safely |
| Configuration drift across environments | Consistent, resource-aware behavior |
| High operational risk | Safe rollback and zero configuration risk |
By replacing static configuration with dynamic, resource-aware tuning, jaz simplifies Java performance optimization across all Azure compute platforms.
How It Works: Safe, Smart, and Observable
Safe by Default
The tool preserves user-provided JVM configuration wherever applicable.
By default, the environment variable JAZ_IGNORE_USER_TUNING is set to 0, which means user-specified flags such as -Xmx, -Xms, and other tuning options are honored.
If JAZ_IGNORE_USER_TUNING=1 is set, the tool ignores most options beginning with -X to allow full optimization. As an exception, selected diagnostic and logging flags (e.g. -Xlog) are always passed through to the JVM.
Example (default behavior with user tuning preserved):
jaz -Xmx2g -jar myapp.jar
In this mode, the tool:
- Detects user-provided JVM flags and avoids conflicts
- Applies optimizations only when safe
- Guarantees no behavioral regressions in production
Smart Optimization
Beyond preserving user input, the tool performs resource-aware heap sizing using system or cgroup memory limits. It also detects the JDK version to enable vendor- and version-specific optimizations—including enhancements available in Microsoft Build of OpenJDK, Eclipse Temurin, and others.
This ensures consistent, cross-platform behavior across both x64 and ARM64 architectures.
Observability Without Overhead
The tool introduces adaptive telemetry designed to maximize inference while minimizing interference.
Core principle: more insight, less intrusion.
Telemetry is used internally today to guide safe optimization decisions. The system automatically adjusts data collection depth across runtime phases (startup and steady state), providing production-grade visibility without impacting application performance.
Future phases will extend this with event-driven telemetry, including anomaly-triggered sampling for deeper insight when needed.
Evolution of Memory Management
The tool’s memory-management approach has evolved beyond conservative, resource-aware heuristics such as the default ergonomics in OpenJDK. It now applies an adaptive model that incorporates JDK-specific knowledge to deliver stable, efficient behavior across diverse cloud environments. Each stage builds on production learnings to improve predictability and performance.
Stage 1: Resource-Aware Foundations
The initial implementation established predictable memory behavior for both containerized and VM-based workloads.
- Dynamically sized the Java heap based on system or cgroup memory limits
- Tuned garbage-collection ergonomics for cloud usage patterns
- Prioritized safety and consistency through conservative, production-first defaults
Stage 2: JDK-Aware Hybrid Optimization (Current)
The version available in Public Preview extends this foundation with JDK introspection and vendor-specific awareness.
- Detects the JDK version and applies the corresponding tuning profile
- Enables optimizations for Microsoft Build of OpenJDK when present in the path, leveraging its advanced memory-management features to enable pause-less memory reclamation, typically reclaiming 318–708 MB per cycle without adding latency
- Falls back to proven, broadly compatible strategies for other JDK distributions, maintaining consistent results across platforms
- Maintains stable throughput and predictable latency across VM and container environments by combining static safety heuristics with adaptive memory behavior
This integration also informs the tool’s telemetry model, where the same balance between visibility and performance guides data-collection strategy.
The Inference vs Interference Matrix
In observability systems, inference (the ability to gain insight) and interference (the performance impact of measurement) are always in tension. The tool’s telemetry model balances these forces by adjusting its sampling depth based on runtime phase and workload stability.
| Telemetry Mode | Insight (Inference) | Runtime Impact (Interference) | Use Case |
|---|---|---|---|
| High-Frequency | Deep event correlation | Noticeable overhead | Startup diagnostics |
| Low-Frequency | Basic trend observation | Negligible overhead | Steady-state monitoring |
| Adaptive (tool) | Critical metrics collected on demand | Minimal overhead | Production optimization |
A useful comparison is Native Memory Tracking (NMT) in the JDK. While NMT exposes multiple levels of visibility into native memory usage (summary, detail, or off), most production systems rely on summary mode for stability. Similarly, the tool embraces this tiered approach to observability but applies it dynamically by adjusting telemetry intensity rather than relying on static configuration.
| Phase | Data Collection Depth | Inference Level | Interference Level | Comparable NMT Concept |
|---|---|---|---|---|
| Startup | Focused sampling of GC and heap sizing | High | Moderate | summary with higher granularity |
| Steady-State | Aggregated metrics and key anomalies | Medium | Low | summary |
| Future (Event-Driven) | Planned reactive sampling | Targeted | Minimal | Conceptually detail-on-demand |
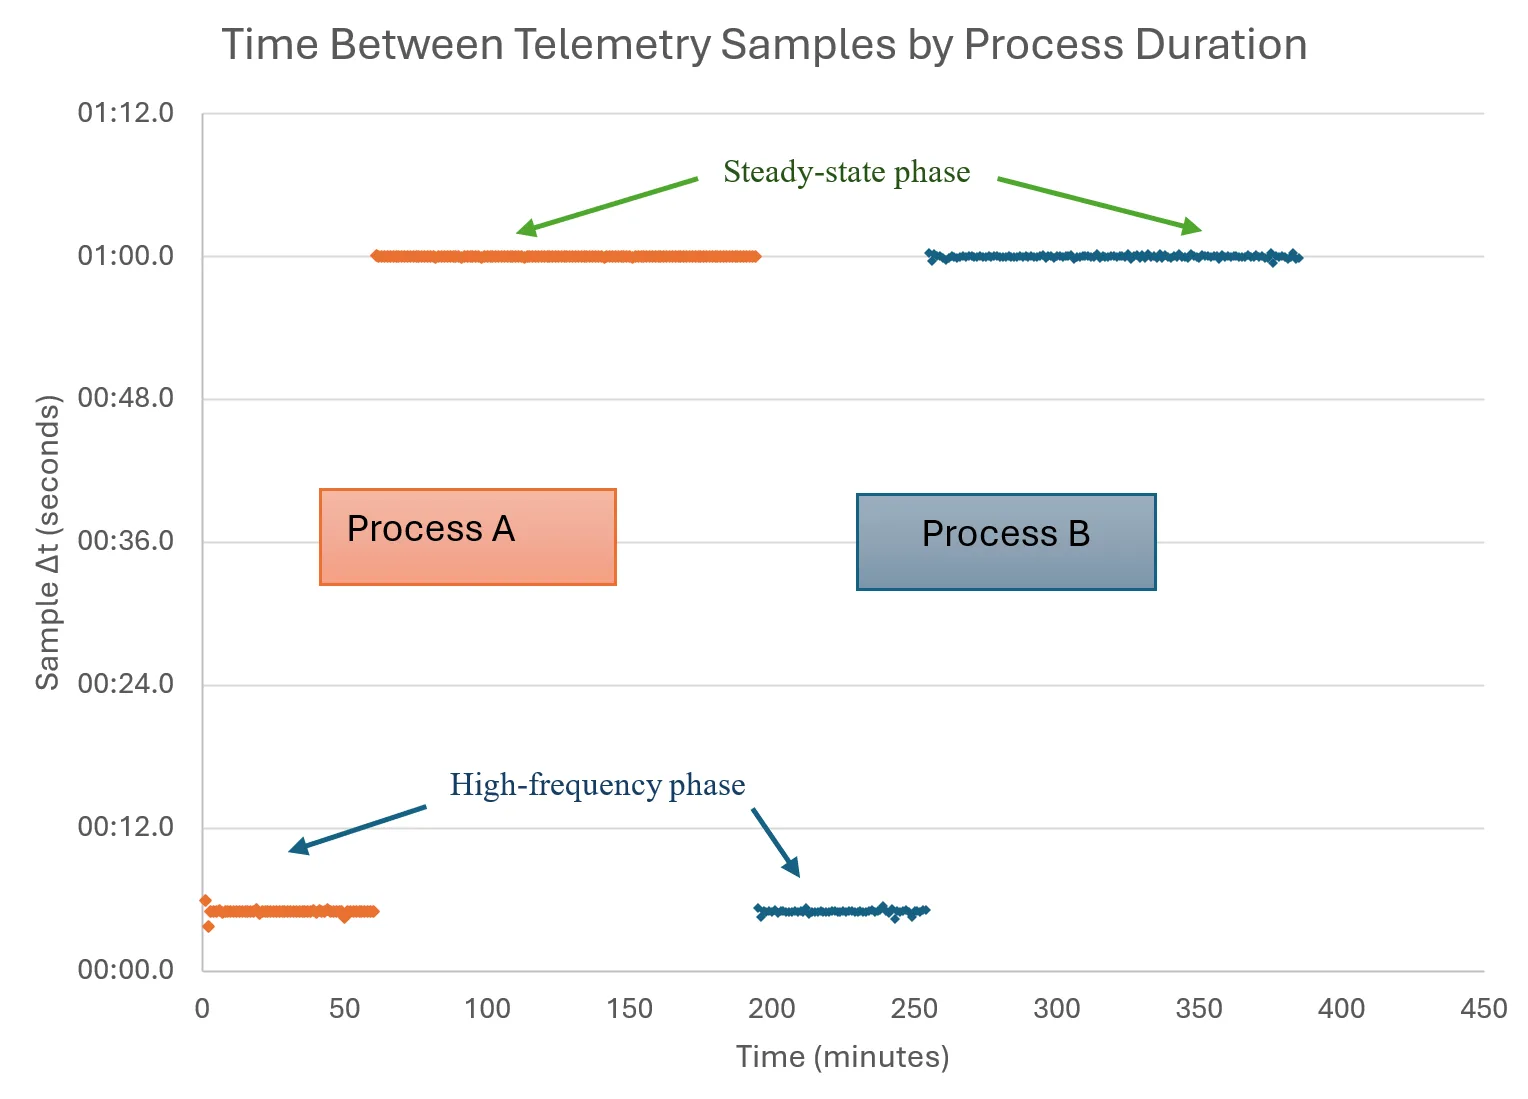
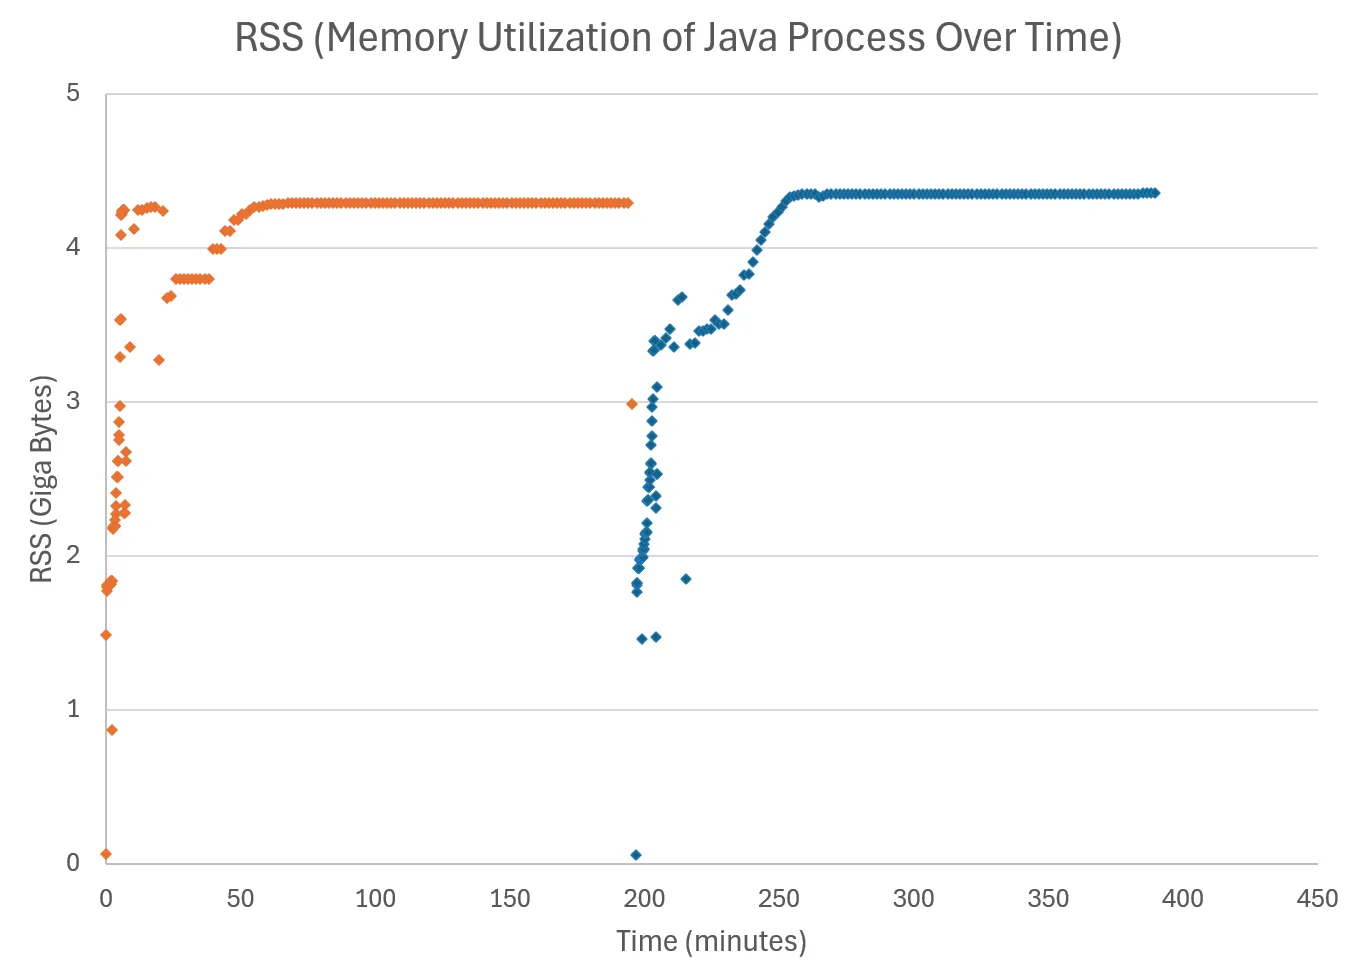
The following visualizations illustrate how telemetry tracks memory behavior in sync with its adaptive sampling cadence. As the runtime transitions from startup to steady state, the tool automatically increases the time between samples—reducing interference while preserving meaningful visibility into trends.

Figure 1 shows how the interval between telemetry samples (Sample Δt) increases as the runtime stabilizes. Both Process A and Process B exhibit the same pattern: a high-frequency sampling phase during startup followed by a steady-state phase with larger, consistent sampling intervals. This adaptive behavior reduces interference while maintaining meaningful visibility into runtime behavior.

Figure 2 shows the resident set size (RSS) of the Java process in GB, captured through adaptive telemetry. The visualization highlights the expected growth during warmup and stabilization during steady state. By adjusting sampling frequency intelligently, the tool provides production-grade observability of memory behavior without disrupting application performance or exceeding resource budgets.
Benchmark Validation
SPEC JBB2015 Results
All SPEC JBB measurements in this study were run on Azure Linux/Arm64 virtual machines.

-
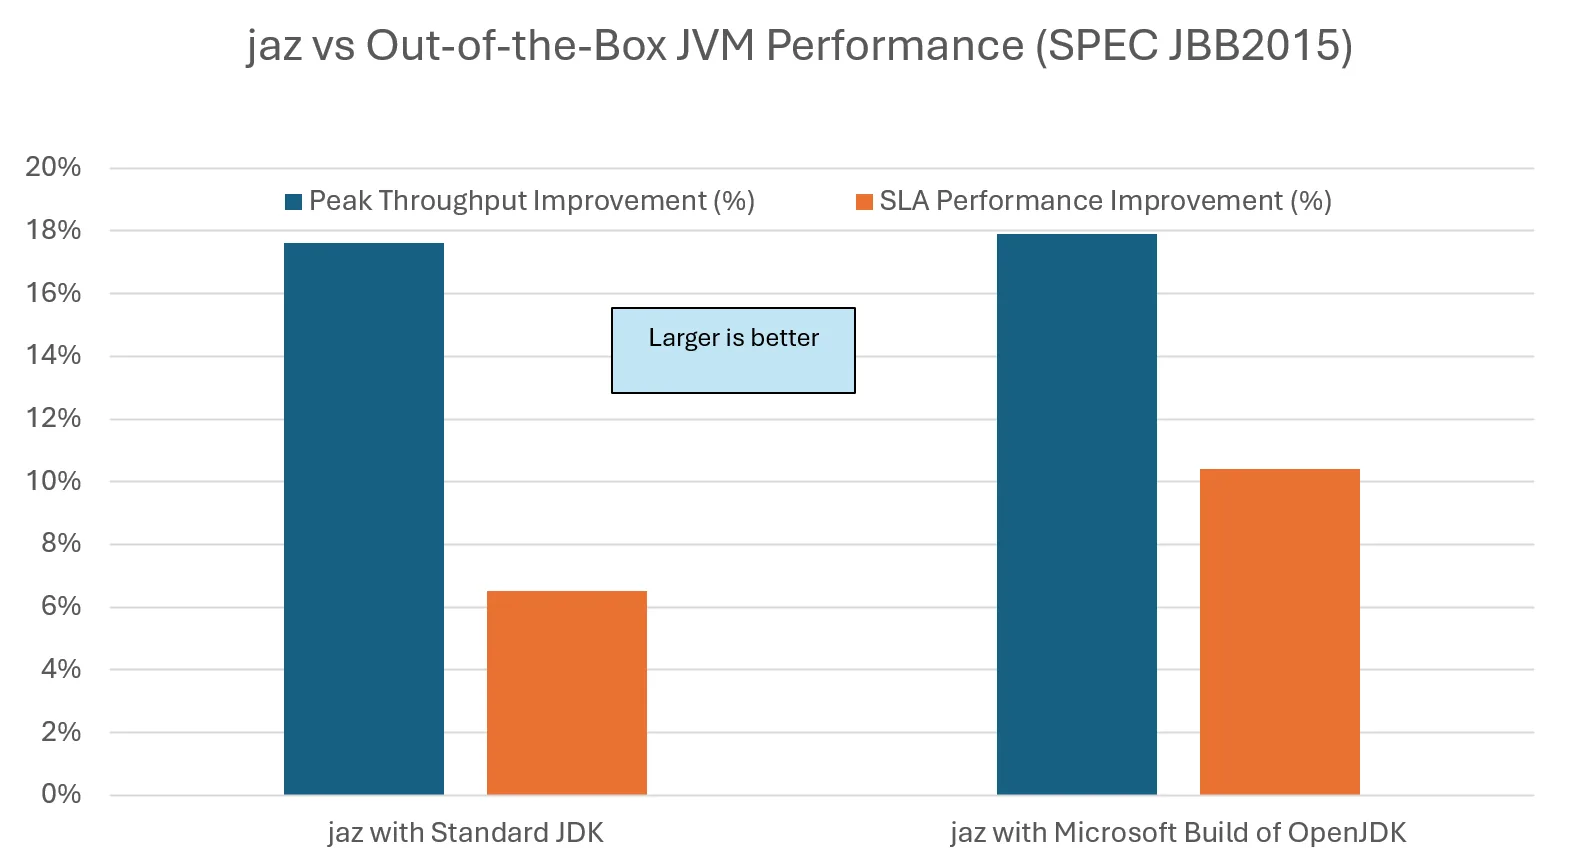
The tool delivers double-digit peak throughput gains across all configurations tested—well over 17% relative to out-of-the-box JVM ergonomics
-
SLA-constrained performance improves as well, with the largest gains observed when paired with the Microsoft Build of OpenJDK (around 10% in our tests)
In SPEC JBB2015, SLA performance represents latency-sensitive throughput—how much work is sustained while meeting service-level response-time requirements.
-
No regressions or stability issues were observed across repeated trials and JDK versions
Spring PetClinic REST API Results
These measurements were run in containers with the tool applying cgroup-aware ergonomics under fixed CPU and memory limits.
The Spring PetClinic REST backend provides a lighter-weight request/response workload that complements SPEC JBB2015 rather than replacing it. It exposes CRUD endpoints for owners, pets, vets, visits, pet types, and specialties (GET/POST/PUT/DELETE), documented via Swagger/OpenAPI, and backed by H2 by default. The repository includes Apache JMeter test plans under src/test/jmeter, which we run headless to generate steady read/write traffic across the API surfaces.
To evaluate stability under resource contention, we also ran stress-ng in a companion container to introduce CPU and memory pressure alongside the JMeter-driven workload.
| Performance Domain | Impact | Stability Assessment |
|---|---|---|
| Mean Response Time | 1–5% improvement | Consistent across scenarios |
| Tail Latency (90–99th) | Neutral/minimal | Maintained under stress—including stress-ng |
| Throughput Capacity | No degradation | Scales with resources |
| Stress Resilience | Excellent | Production-ready |
| Memory Efficiency | Resource-aware | Validated from 2–8GB |
In other words, the tool is effectively throughput-neutral on this microservice workload while delivering small improvements in mean response time and keeping tail latency and stability intact—even when additional load is introduced via stress-ng.
Taken together, the SPEC JBB2015 and Spring PetClinic REST results confirm that the tool enhances throughput, preserves tail latency, and maintains robust performance across both VM-based and containerized deployments—even under additional system pressure.
Enterprise Deployment Model
The tool supports a safe, incremental adoption strategy designed for production environments:
| Phase | Approach | Command Example | Risk Level |
|---|---|---|---|
| Coexistence | Respect existing tuning | jaz -Xmx2g -jar myapp.jar |
Minimal |
| Optimization | Remove manual flags | jaz -jar myapp.jar |
Low |
| Validation | Verify tuning safely | JAZ_DRY_RUN=1 jaz -jar myapp.jar |
Zero |
This phased design lets teams adopt the tool at their own pace—and roll back at any time without risk.
Technical Architecture
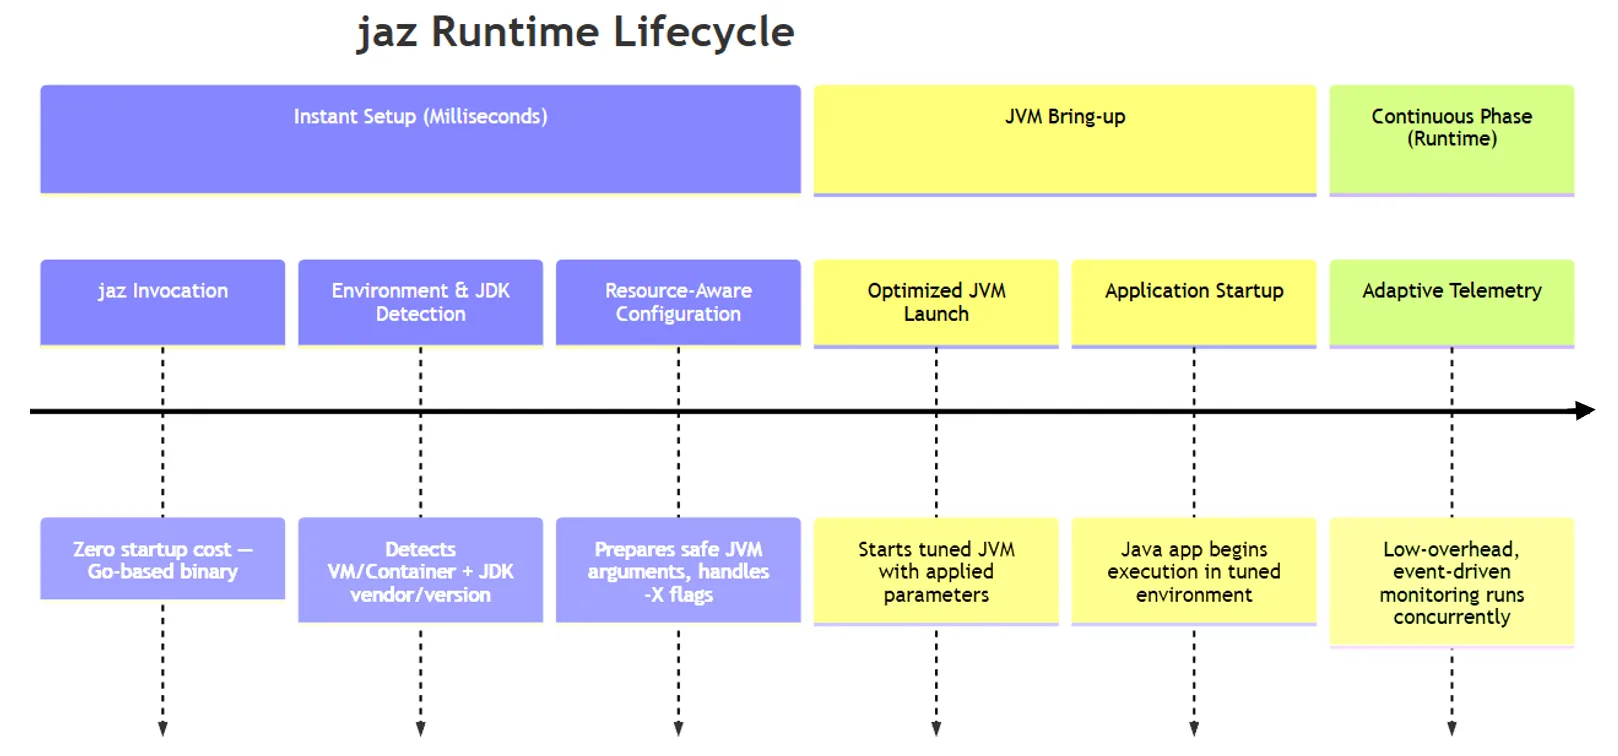
When invoked, the launcher detects the runtime environment and JDK version, applies resource-aware JVM configuration, and launches the optimized JVM in which the application executes. Built-in telemetry operates with low overhead, providing observability without affecting startup or runtime performance.

jaz runtime lifecycle showing instant setup, JVM bring-up, and continuous telemetry
Figure 4 illustrates the end-to-end lifecycle of jaz during application startup and execution. The tool performs an instant setup phase—detecting the environment and JDK version, applying resource-aware configuration, and preparing safe JVM arguments—all within milliseconds. It then launches the optimized JVM, after which the Java application begins execution in a tuned environment. During the continuous runtime phase, low-overhead, event-driven telemetry runs concurrently, providing observability with minimal interference.
Get Started
Key Benefits
-
Immediate throughput improvements (17%+)
-
Consistent, resource-aware behavior across JDKs
-
Safe, incremental adoption model
-
Foundation for adaptive, self-optimizing behavior through runtime awareness
While telemetry is currently used only to improve the launcher internally, it lays the groundwork for future self-healing features that can inform runtime components such as GC ergonomics and heap-sizing heuristics.
Azure Command Launcher for Java turns JVM optimization from a specialized task into a built-in capability—bringing Java simplicity, safety, and performance to the Azure cloud.
For installation, configuration, supported JDKs, and environment variables, see the Microsoft Learn documentation:
https://learn.microsoft.com/en-us/java/jaz/overview
A forthcoming performance analysis blog will present detailed results from extended performance testing, covering heap and GC behavior, and scaling trends across Azure VMs.


0 comments
Be the first to start the discussion.