Complete observability for your AI application
Monitor your entire AI application stack—not just LLM calls. See LLM interactions, agent behavior, API requests, database queries, and everything in between. Built on OpenTelemetry with native integrations for AI frameworks, plus comprehensive observability for any workload in any language. From local dev to production.
Companies who trust Pydantic Logfire
Pydantic Logfire shows your complete application, AI to API. Observe LLM calls, agent reasoning, API latency, database queries, vector searches, and everything in between. Real AI applications are complex systems, and problems often hide in the seams between components. Get full visibility across your entire stack, catch issues before production, and understand the complete picture from local development to production monitoring.
Complete AI Application Observability
Discover how Logfire provides end-to-end observability for AI applications—from LLM calls and agent reasoning to your entire application stack.
Explore AI Observability Features →A more intuitive way to understand your
Pydantic Logfire is a window into the inner workings of your application. Smooth to set up and easy to understand, with ready integrations for many popular libraries.


Insights
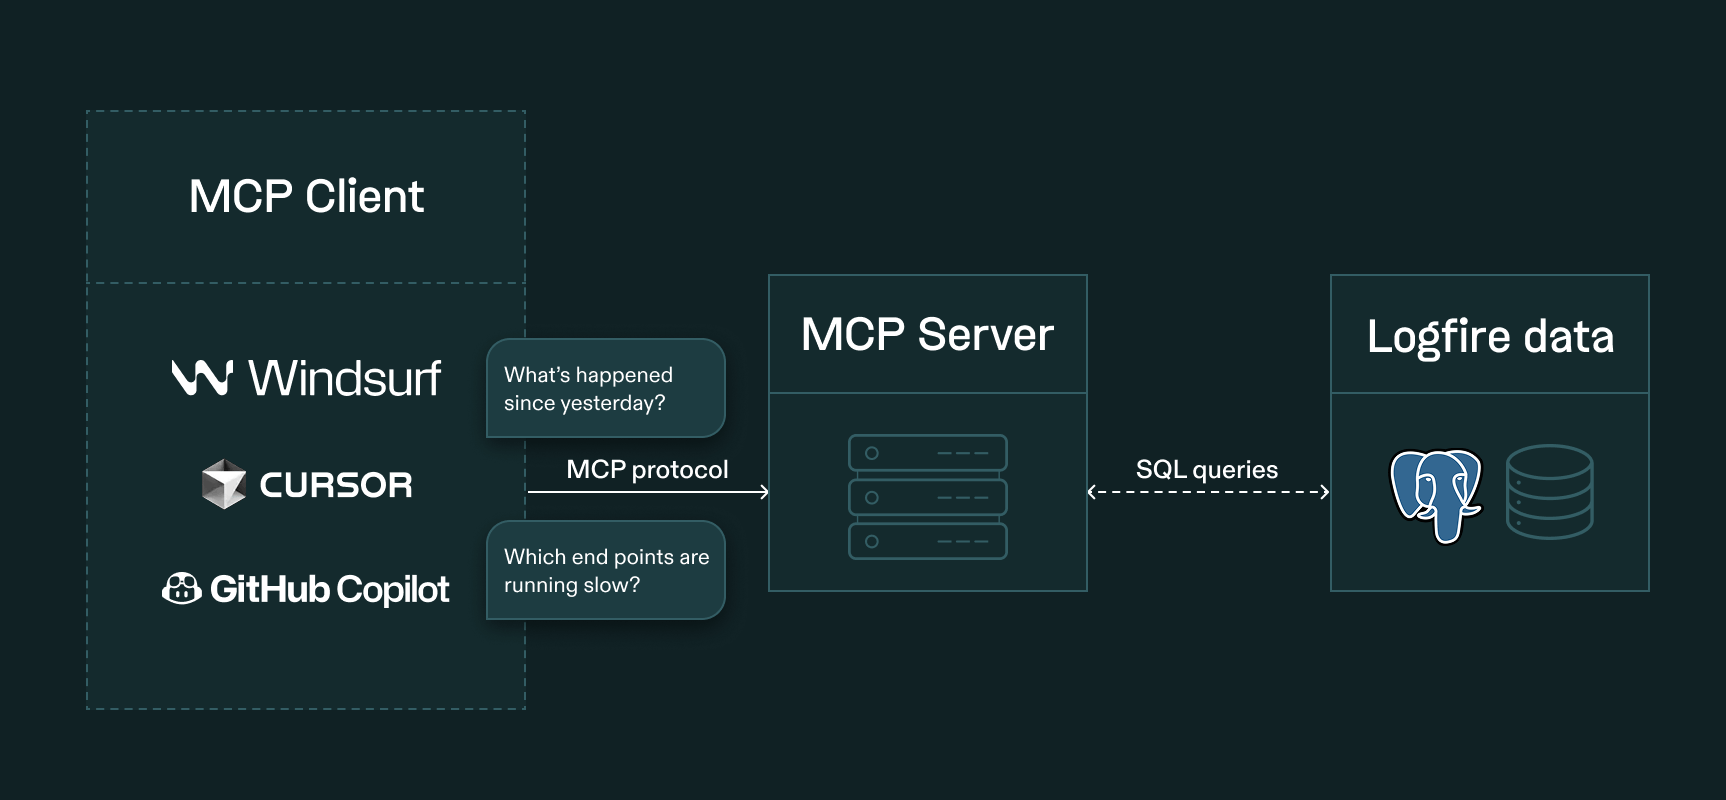
Query your data with full SQL
Query your data with full Postgres flavored SQL — all the control and (for many) nothing new to learn. Even if you don’t like writing SQL, LLMs do, so SQL plus an MCP server lets your IDE use Pydantic Logfire as a window into your app’s execution. Search for obstacles and opportunities, as you (or the AI) writes code.
From local to prod
See your application traces appear in real time. Spin up Pydantic Logfire in your local development environment and carry it through your entire dev-lifecycle, from initial debugging to production monitoring. The same observability platform that helps you catch bugs as you code keeps your production systems healthy too. No tool switching, no context loss, no friction.
Built on open standards, usable in 3-10 LOC
Pydantic Logfire is built on OpenTelemetry , which you’d expect for a modern observability tool. What you might not expect is how verbose it can be to work directly with OTel’s SDKs, compared to our custom streamlined and ergonomic SDKs for Python, Rust and Typescript. Plus, our SDKs make the live view more powerful, like rendering spans before they’ve completed.
import logfire

logfire.configure()

logfire.info('Hello, {name}!', name='world')
Visibility is more than classic Observability
Beyond devops and responding to incidents, for quality over time you also want integrated analytics. You should be able to use the same view to see exceptions and why a customer downgraded. Or see a chart of payment volume in the same dashboard that shows you a chart of API response times. Pydantic Logfire is flexible and powerful enough to do both so you can understand your code and visualise its impact. For AI applications specifically, explore our AI observability capabilities.
Integrates with the tools you love
Get a robust, consistent view into your application, regardless of your stack.
logfire.instrument_system_metrics()
logfire.instrument_pydantic_ai()
logfire.instrument_pydantic()
logfire.instrument_mcp()
logfire.instrument_fastapi(...)
logfire.instrument_openai()
logfire.instrument_openai_agents()
logfire.instrument_anthropic()
logfire.instrument_httpx()
logfire.instrument_requests()
logfire.instrument_aiohttp_client()
logfire.instrument_django(...)
logfire.instrument_flask(...)
logfire.instrument_starlette(...)
logfire.instrument_asgi(...)
logfire.instrument_wsgi(...)
logfire.instrument_psycopg()
logfire.instrument_asyncpg()
logfire.instrument_sqlite3()
logfire.instrument_redis()
logfire.instrument_mysql()
logfire.instrument_pymongo()
logfire.instrument_sqlalchemy(...)
logfire.instrument_celery()
logfire.instrument_aws_lambda(...)