 PostgreSQL 17 introduced streaming I/O – grouping multiple page reads into a single system call and using smarter posix_fadvise() hints. That alone gave up to ~30% faster sequential scans in some workloads, but it was still strictly synchronous: each backend process would issue a read and then sit there waiting for the kernel to return data before proceeding. Before PG17, PostgreSQL typically read one 8kB page at a time.
- Heap sequential scans, like plain SELECT and COPY operations that stream lots of data
- VACUUM on big tables and indexes
- ANALYZE sampling
- Bitmap heap scans
Autovacuum benefits from this change too, since its workers share the same VACUUM/ANALYZE code paths. Other operations still remain synchronous for now:
- B‑tree index scans / index‑only scans
- Recovery & replication
- All write operations INSERT, UPDATE, DELETE, WAL writes
- Small OLTP lookups that touch a single heap page
Future work is expected to widen coverage, especially index‑only scans and some write‑path optimizations.
Significant improvements for cloud volumes
Community benchmarks show that PostgreSQL 18 AIO significantly improves cold cache data reads in cloud setups with network‑attached storage where latency is high. AWS documentation states that average latency of Block Express volumes is “under 500 microseconds for 16 KiB I/O size”, when latency of General Purpose volumes can exceed 800 microseconds. Some articles suggest that under high load each physical block read from disk can cost around 1ms, while page processing in PostgreSQL is much cheaper. By combining many pages into one read, all these pages together now cost around 1ms. And by performing multiple reading requests at the same time in parallel, we effectively pay that 1ms latency just once per the whole batch.
Asynchronous I/O methods
The new subsystem can run in one of three modes, configured via io_method parameter with possible values “worker” (default), “io_uring“, and “sync“. We will cover how each works and then show how to monitor asynchronous I/O in our environment.
io_method = sync
This mode effectively turns AIO off. Reads are executed through the same AIO API but synchronously, using regular preadv or pwritev methods on the backend process that issued the I/O. This method does not use any extra shared memory and is intended mainly for regression testing or if we suspect AIO is misbehaving. It is also used internally as fall back to the synchronous I/O for operations which cannot use asynchronous I/O. PostgreSQL core functions issue an error, if some extension would try to force asynchronous I/O through AIO API when global io_method is set to “sync”. Available benchmarks show that this PostgreSQL 18 mode performs similarly to PostgreSQL 17’s streaming I/O.
io_method = io_uring (Linux only)
SELECT pg_config FROM pg_config() where pg_config::text ilike ’%liburing%’;
- Backends write requests via API into a submission ring in shared memory
- The kernel performs I/O asynchronously and writes results into a completion ring
- Completion ring content is consumed by the backend with fewer context switches
Execution still happens in the same process, like with the “sync” method, but it uses kernel worker threads for parallel processing. This typically shines on very fast NVMe SSDs.
However, io_uring Linux feature also has had a rough security history. It bypasses traditional syscall audit paths and therefore has been involved in a large share of Linux kernel exploits. Google reported that 60% of Linux kernel vulnerabilities in 2022 involved io_uring and some security tools were unable to uncover these types of attacks. Therefore some container environments disable io_uring entirely.
io_method = worker
This is the cross‑platform, “safe” implementation and the default in PostgreSQL 18. Mechanism is very similar to existing parallel query processing. The main difference is that background I/O workers are long‑lived independent processes created at server start, not short‑lived processes spawned per query.
- At server start, the postmaster creates a pool of I/O worker processes. Number is controlled by io_workers parameter with a default of 3. However, benchmarks suggest this number should be higher on many‑core machines, typically between ¼ and ½ of available CPU threads. Best value depends on workload and storage latency.
- Backends submit read requests into a shared memory submission queue. This submission queue is generally a ring buffer that multiple backends can write into concurrently. It contains only metadata about the request – handle indices, not full request record. There is only one submission queue for the entire cluster, not per database or per backend. The actual details of the request are stored in separate memory structure.
- Request is checked if it must be executed synchronously or can be handled asynchronously. Synchronous execution can also be chosen if the submission queue is full. This avoids problems with shared memory usage under extreme load. In case of synchronous execution, code uses path for “sync” method described above.
- Request submission in shared memory wakes up one I/O worker, which pops request and executes traditional blocking read() / pread() calls. If queue is still not empty, woken worker can wake up 2 additional workers to process it in parallel. Note in code mentions that this can be in the future extended to configurable N workers. This limit helps to avoid so called “thundering herd problem”, when single submitter would wake up too many workers causing havoc and locks for other backends.
- One limitation for asynchronous I/O is the fact, that workers cannot simply reuse file descriptors opened by backends, they must reopen files in their own context. If this is not possible for some types of operations, synchronous I/O path is used for that specific request.
- When workers finish a request without an error, they write data blocks into share buffers, put result into a completion queue and signal the backend.
- From the perspective of the backend, I/O becomes “asynchronous”, because the “waiting” happens in worker processes, not in the query process itself.
- Works on all supported OSes
- Simple error handling: if a worker crashes, requests are marked as failed, worker exits and a new worker is spawned by postmaster
- Avoids the security concerns around Linux io_uring interface
- The downside is extra context switches and possible shared‑memory queue contention, but for many workloads the ability to overlap reads easily pays for that
- This method improves performance even in the case when all blocks are just copied from local Linux memory cache, because it is now done in parallel
Tuning the New I/O Parameters
PostgreSQL 18 adds or updates several parameters related to disk I/O. We already covered io_method and io_workers; let’s look at the others. Another new parameters are io_combine_limit and io_max_combine_limit. They control how many data pages PostgreSQL groups into a single AIO request. Larger requests typically yield better throughput, but can also increase latency and memory usage. Values without units are interpreted in 8kB data blocks. With units (kB, MB), they directly represent size – however, should be multiples of 8kB.
Parameter io_max_combine_limit is a hard server‑start cap, io_combine_limit is the user‑tunable value that can be changed at runtime but cannot exceed the max. Default values of both is 128kB (16 data pages). But documentation recommends setting up to 1MB on Unix (128 data pages) and 128kB on Windows (16 data pages – due to limitations in internal Widows buffers). We can experiment with higher values, but based on HW and OS limits AIO benefits plateau after some chunk size; pushing this too high doesn’t help and can even increase latency.
PostgreSQL 18 introduces also io_max_concurrency setting, which controls max number of IOs that one process can execute simultaneously. Default setting -1 means value will be selected automatically based on other settings, but it cannot exceed 64.
Other related parameter is effective_io_concurrency – number of concurrent I/O operations that can be executed simultaneously on storage. Range of values is from 1 to 1000, value 0 disables asynchronous I/O requests. Default value is now 16, some community articles suggest to go up to 200 on modern SSDs. Best setting depends on specific hardware and OS, however, some articles also warn that too high value may significantly increase I/O latency for all queries.
How to Monitor Asynchronous I/O
pg_stat_activity
SELECT pid, backend_start, wait_event_type, wait_event, backend_type
FROM pg_stat_activity
WHERE backend_type = 'io worker';


  pid |        backend_start          | wait_event_type |  wait_event  | backend_type
------+-------------------------------+-----------------+--------------+--------------
   34 | 2025-12-09 11:44:23.852461+00 | Activity        | IoWorkerMain | io worker
   35 | 2025-12-09 11:44:23.852832+00 | Activity        | IoWorkerMain | io worker
   36 | 2025-12-09 11:44:23.853119+00 | IO              | DataFileRead | io worker
   37 | 2025-12-09 11:44:23.8534+00   | IO              | DataFileRead | io worker
SELECT a.pid, a.usename, a.application_name, a.backend_type, a.state, a.query,
ai.operation, ai.state AS aio_state, ai.length AS aio_bytes, ai.target_desc
FROM pg_aios ai
JOIN pg_stat_activity a ON a.pid = ai.pid
ORDER BY a.backend_type, a.pid, ai.io_id;


-[ RECORD 1 ]----+------------------------------------------------------------------------
             pid | 58
         usename | postgres
application_name | psql
    backend_type | client backend
           state | active
           query | explain analyze SELECT ........
       operation | readv
       aio_state | SUBMITTED
       aio_bytes | 704512
     target_desc | blocks 539820..539905 in file "pg_tblspc/16647/PG_18_202506291/5/16716"
-[ RECORD 2 ]----+------------------------------------------------------------------------
             pid | 159
         usename | postgres
application_name | psql
    backend_type | parallel worker
           state | active
           query | explain analyze SELECT ........
       operation | readv
       aio_state | SUBMITTED
       aio_bytes | 704512
     target_desc | blocks 536326..536411 in file "pg_tblspc/16647/PG_18_202506291/5/16716"
pg_aios: Current AIO handles
- pid: backend issuing the I/O
- io_id, io_generation: identify a handle across reuse
- state: HANDED_OUT, DEFINED, STAGED, SUBMITTED, COMPLETED_IO, COMPLETED_SHARED, COMPLETED_LOCAL
- operation: invalid, readv (vectored read) or writev (vectored write)
- off, length: offset and size of I/O operation
- target, target_desc: what we’re reading/writing (typically relations)
- result: UNKNOWN, OK, PARTIAL, WARNING, ERROR
-- Summary of current AIO handles by state and result
SELECT state, result, count(*) AS cnt, pg_size_pretty(sum(length)) AS total_size
FROM pg_aios GROUP BY state, result ORDER BY state, result;

       state      |  result | cnt | total_size
------------------+---------+-----+------------
 COMPLETED_SHARED | OK      |   1 | 688 kB
 SUBMITTED        | UNKNOWN |   6 | 728 kB

-- In-flight async I/O handles
SELECT COUNT(*) AS aio_handles, SUM(length) AS aio_bytes FROM pg_aios;

 aio_handles | aio_bytes
-------------+-----------
           7 |     57344

-- Sessions currently waiting on I/O
SELECT COUNT(*) AS sessions_waiting_on_io FROM pg_stat_activity WHERE wait_event_type = 'IO';

 sessions_waiting_on_io
------------------------
9SELECT pid, state, operation, pg_size_pretty(length) AS io_size, target_desc, result FROM pg_aios ORDER BY pid, io_id; pid | state | operation | io_size | target_desc | result -----+-----------+-----------+------------+-------------------------------------------------------------------------+--------- 51 | SUBMITTED | readv | 688 kB | blocks 670470..670555 in file "pg_tblspc/16647/PG_18_202506291/5/16716" | UNKNOWN 63 | SUBMITTED | readv | 8192 bytes | block 1347556 in file "pg_tblspc/16647/PG_18_202506291/5/16719" | UNKNOWN 65 | SUBMITTED | readv | 688 kB | blocks 671236..671321 in file "pg_tblspc/16647/PG_18_202506291/5/16716" | UNKNOWN 66 | SUBMITTED | readv | 8192 bytes | block 1344674 in file "pg_tblspc/16647/PG_18_202506291/5/16719" | UNKNOWN 67 | SUBMITTED | readv | 8192 bytes | block 1337819 in file "pg_tblspc/16647/PG_18_202506291/5/16719" | UNKNOWN 68 | SUBMITTED | readv | 688 kB | blocks 672002..672087 in file "pg_tblspc/16647/PG_18_202506291/5/16716" | UNKNOWN 69 | SUBMITTED | readv | 688 kB | blocks 673964..674049 in file "pg_tblspc/16647/PG_18_202506291/5/16716" | UNKNOWN
pg_stat_io: Cumulative I/O stats
SELECT backend_type, context, sum(reads) AS reads,
pg_size_pretty(sum(read_bytes)) AS read_bytes,
round(sum(read_time)::numeric, 2) AS read_ms, sum(writes) AS writes,
pg_size_pretty(sum(write_bytes)) AS write_bytes,
round(sum(write_time)::numeric, 2) AS write_ms, sum(extends) AS extends,
pg_size_pretty(sum(extend_bytes)) AS extend_bytes
FROM pg_stat_io
WHERE object = 'relation' AND backend_type IN ('client backend')
GROUP BY backend_type, context
ORDER BY backend_type, context;

   backend_type |  context  |  reads  | read_bytes |  read_ms  | writes | write_bytes | write_ms | extends | extend_bytes
----------------+-----------+---------+------------+-----------+--------+-------------+----------+---------+--------------
 client backend | bulkread  |   13833 | 9062 MB    | 124773.28 |      0 | 0 bytes     |     0.00 |         |
 client backend | bulkwrite |       0 | 0 bytes    |      0.00 |      0 | 0 bytes     |     0.00 |       0 | 0 bytes
 client backend | init      |       0 | 0 bytes    |      0.00 |      0 | 0 bytes     |     0.00 |       0 | 0 bytes
 client backend | normal    | 2265214 | 17 GB      | 553940.57 |      0 | 0 bytes     |     0.00 |       0 | 0 bytes
 client backend | vacuum    |       0 | 0 bytes    |      0.00 |      0 | 0 bytes     |     0.00 |       0 | 0 bytes


-- Top tables by heap blocks read and cache hit ratio
SELECT relid::regclass AS table_name, heap_blks_read, heap_blks_hit,
ROUND( CASE WHEN heap_blks_read + heap_blks_hit = 0 THEN 0
ELSE heap_blks_hit::numeric / (heap_blks_read + heap_blks_hit) * 100 END, 2) AS cache_hit_pct
FROM pg_statio_user_tables
ORDER BY heap_blks_read DESC LIMIT 20;

      table_name      | heap_blks_read | heap_blks_hit | cache_hit_pct
----------------------+----------------+---------------+---------------
 table1               |       18551282 |       3676632 |         16.54
 table2               |        1513673 |     102222970 |         98.54
 table3               |          19713 |       1034435 |         98.13
...


-- Top indexes by index blocks read and cache hit ratio
SELECT relid::regclass AS table_name, indexrelid::regclass AS index_name,
idx_blks_read, idx_blks_hit
FROM pg_statio_user_indexes
ORDER BY idx_blks_read DESC LIMIT 20;

 table_name |    index_name   | idx_blks_read | idx_blks_hit
------------+-----------------+---------------+--------------
 table1     | idx_table1_date |        209289 |          141
 table2     | table2_pkey     |         37221 |      1223747
 table3     | table3_pkey     |          9825 |      3143947
...SELECT pg_stat_reset_shared('io');Then run our workload and query pg_stat_io again to see how many bytes were read/written and how much time was spent waiting on I/O.
Conclusion
PostgreSQL is a registered trademark oftThe PostgreSQL Community Association of Canada.
In the past there have been many discussions about using UUID as a primary key in PostgreSQL. For some applications, even a BIGINT column does not have sufficient range: it is a signed 8‑byte integer with range −9,223,372,036,854,775,808 to +9,223,372,036,854,775,807. Although these values look big enough, if we think about web services that collect billions or more records daily, this number becomes less impressive. Simple integer values can also cause conflicts of values in distributed system, in Data Lakehouses when combining data from multiple source databases etc.
However, the main practical problem with UUIDv4 as a primary key in PostgreSQL was not lack of range, but the complete randomness of the values. This randomness causes frequent B‑tree page splits, a highly fragmented primary key index, and therefore a lot of random disk I/O. There have already been many articles and conference talks describing this problem. What many of these resources did not do, however, was dive deep into the on‑disk structures. That’s what I wanted to explore here.

What are UUIDs
UUID (Universally Unique Identifier) is a 16‑byte integer value (128 bits), which has 2^128 possible combinations (approximately 3.4 × 10^38). This range is so large that, for most applications, the probability of a duplicate UUID is practically zero. Wikipedia shows a calculation demonstrating that the probability to find a duplicate within 103 trillion version‑4 UUIDs is about one in a billion. Another often‑quoted rule of thumb is that to get a 50% chance of one collision, you’d have to generate roughly 1 billion UUIDs every second for about 86 years.
Values are usually represented as a 36‑character string with hexadecimal digits and hyphens, for example: f47ac10b-58cc-4372-a567-0e02b2c3d479. The canonical layout is 8‑4‑4‑4‑12 characters. The first character in the third block and the first character in the fourth block have special meaning: xxxxxxxx-xxxx-Vxxx-Wxxx-xxxxxxxxxxxx – V marks UUID version (4 for UUIDv4, 7 for UUIDv7, etc.), W encodes the variant in its upper 2 or 3 bits (the layout family of the UUID).
Until PostgreSQL 18, the common way to generate UUIDs in PostgreSQL was to use version‑4 (for example via gen_random_uuid() or uuid_generate_v4() from extensions). PostgreSQL 18 introduces native support for the new time‑ordered UUIDv7 via uuidv7() function, and also adds uuidv4() as a built‑in alias for older gen_random_uuid() function. UUID version 4 is generated completely randomly (except for the fixed version and variant bits), so there is no inherent sequence in the values. UUID version 7 generates values that are time‑ordered, because the first 48 bits contain a big‑endian Unix epoch timestamp with roughly millisecond granularity, followed by additional sub‑millisecond bits and randomness.

Test setup in PostgreSQL 18
I will show concrete results using a simple test setup – 2 different tables with column “id” containing generated UUID value (either v4 or v7), used as primary key, column “ord” with sequentially generated bigint, preserving the row creation order.
-- UUIDv4 (completely random keys)
CREATE TABLE uuidv4_demo (
    id uuid PRIMARY KEY DEFAULT uuidv4(), -- alias of gen_random_uuid()
    ord bigint GENERATED ALWAYS AS IDENTITY
);

-- UUIDv7 (time-ordered keys)
CREATE TABLE uuidv7_demo (
    id uuid PRIMARY KEY DEFAULT uuidv7(),
    ord bigint GENERATED ALWAYS AS IDENTITY
);

-- 1M rows with UUIDv4
INSERT INTO uuidv4_demo (id) SELECT uuidv4() FROM generate_series(1, 1000000);

-- 1M rows with UUIDv7
INSERT INTO uuidv7_demo (id) SELECT uuidv7() FROM generate_series(1, 1000000);

VACUUM ANALYZE uuidv4_demo;
VACUUM ANALYZE uuidv7_demo;
Query‑level performance: EXPLAIN ANALYZE
As the first step, let’s compare the costs of ordering by UUID for the two tables:
-- UUIDv4
EXPLAIN (ANALYZE, BUFFERS) SELECT * FROM uuidv4_demo ORDER BY id;

Index Scan using uuidv4_demo_pkey on uuidv4_demo (cost=0.42..60024.31 rows=1000000 width=24) (actual time=0.031..301.163 rows=1000000.00 loops=1)
  Index Searches: 1
  Buffers: shared hit=1004700 read=30
Planning Time: 0.109 ms
Execution Time: 318.005 ms

-- UUIDv7
EXPLAIN (ANALYZE, BUFFERS) SELECT * FROM uuidv7_demo ORDER BY id;

Index Scan using uuidv7_demo_pkey on uuidv7_demo (cost=0.42..36785.43 rows=1000000 width=24) (actual time=0.013..96.177 rows=1000000.00 loops=1)
  Index Searches: 1
  Buffers: shared hit=2821 read=7383
Planning Time: 0.040 ms
Execution Time: 113.305 ms
The exact buffer numbers depend on caching effects, but one thing is clear in this run: the index scan over UUIDv7 needs roughly 100 times less buffer hits and is around three times faster (113 ms vs 318 ms) for the same million‑row ORDER BY id. This is the first sign that UUIDv7 is a very viable solution for a primary key when we need to replace a BIGINT column with something that has a much larger space and uniqueness, while still behaving like a sequential key from the point of view of the index.
Speed of Inserts – simple benchmarking
Originally I wanted to make more sophisticated tests, but even very basic naive benchmark showed huge difference in speed of inserts. I compared time taken to insert 50 million rows into empty table, then again, into the table with 50 million existing rows.
INSERT INTO uuidv4_demo (id) SELECT uuidv4() FROM generate_series(1, 50000000);
INSERT INTO uuidv7_demo (id) SELECT uuidv7() FROM generate_series(1, 50000000);

-- UUID v4                                 -- UUID v7
                                Empty table
Insert time: 1239839.702 ms (20:39.840)    Insert time: 106343.314 ms (01:46.343)
Table size: 2489 MB                        Table size: 2489 MB
Index size: 1981 MB                        Index size: 1504 MB

                            Table with 50M rows
Insert time: 2776880.790 ms (46:16.881)    Insert time: 100354.087 ms (01:40.354)
Table size: 4978 MB                        Table size: 4978 MB
Index size: 3956 MB                        Index size: 3008 MB
As we can see, speed of inserts is radically different. Insertion of the first 50 million rows into empty table took only 1:46 minutes for UUIDv7, but already 20 minutes for UUIDv4. Second batch showed even 2 times bigger difference.
How values are distributed in the table
These results indicate huge differences in indexes. So let’s analyze it. First we will check how the values are distributed in the table, I use the following query for both tables (just switching the table name):
SELECT
    row_number() OVER () AS seq_in_uuid_order,
    id,
    ord,
    ctid
FROM uuidv4_demo
ORDER BY id
LIMIT 20;
Column seq_in_uuid_order is just the row number in UUID order, ord is the insertion order, ctid shows the physical location of each tuple in the heap: (block_number, offset_in_block).
UUIDv4: random UUID order ⇒ random heap access
How do the results look for UUIDv4?
 seq_in_uuid_order |                 id                   |   ord  |    ctid
-------------------+--------------------------------------+--------+------------
                 1 | 00000abf-cc8e-4cb2-a91a-701a3c96bd36 | 673969 | (4292,125)
                 2 | 00001827-16fe-4aee-9bce-d30ca49ceb1d | 477118 | (3038,152)
                 3 | 00001a84-6d30-492f-866d-72c3b4e1edff | 815025 | (5191,38)
                 4 | 00002759-21d1-4889-9874-4a0099c75286 | 879671 | (5602,157)
                 5 | 00002b44-b1b5-473f-b63f-7554fa88018d | 729197 | (4644,89)
                 6 | 00002ceb-5332-44f4-a83b-fb8e9ba73599 | 797950 | (5082,76)
                 7 | 000040e2-f6ac-4b5e-870a-63ab04a5fa39 | 160314 | (1021,17)
                 8 | 000053d7-8450-4255-b320-fee8d6246c5b | 369644 | (2354,66)
                 9 | 00009c78-6eac-4210-baa9-45b835749838 | 463430 | (2951,123)
                10 | 0000a118-f98e-4e4a-acb3-392006bcabb8 |  96325 | (613,84)
                11 | 0000be99-344b-4529-aa4c-579104439b38 | 454804 | (2896,132)
                12 | 00010300-fcc1-4ec4-ae16-110f93023068 |  52423 | (333,142)
                13 | 00010c33-a4c9-4612-ba9a-6c5612fe44e6 |  82935 | (528,39)
                14 | 00011fa2-32ce-4ee0-904a-13991d451934 | 988370 | (6295,55)
                15 | 00012920-38c7-4371-bd15-72e2996af84d | 960556 | (6118,30)
                16 | 00014240-7228-4998-87c1-e8b23b01194a |  66048 | (420,108)
                17 | 00014423-15fc-42ca-89bd-1d0acf3e5ad2 | 250698 | (1596,126)
                18 | 000160b9-a1d8-4ef0-8979-8640025c0406 | 106463 | (678,17)
                19 | 0001711a-9656-4628-9d0c-1fb40620ba41 | 920459 | (5862,125)
                20 | 000181d5-ee13-42c7-a9e7-0f2c52faeadb | 513817 | (3272,113)
Values are distributed completely randomly. Reading rows in UUID order practically does not make sense here and leads directly into random heap access for queries that use the primary key index.
UUIDv7: UUID order follows insertion order
On the other hand, UUIDv7 values are generated in a clear sequence:
 seq_in_uuid_order |                  id                  | ord | ctid
-------------------+--------------------------------------+-----+--------
                 1 | 019ad94d-0127-7aba-b9f6-18620afdea4a |   1 | (0,1)
                 2 | 019ad94d-0131-72b9-823e-89e41d1fad73 |   2 | (0,2)
                 3 | 019ad94d-0131-7384-b03d-8820be60f88e |   3 | (0,3)
                 4 | 019ad94d-0131-738b-b3c0-3f91a0b223a8 |   4 | (0,4)
                 5 | 019ad94d-0131-7391-ab84-a719ca98accf |   5 | (0,5)
                 6 | 019ad94d-0131-7396-b41d-7f9f27a179c4 |   6 | (0,6)
                 7 | 019ad94d-0131-739b-bdb3-4659aeaafbdd |   7 | (0,7)
                 8 | 019ad94d-0131-73a0-b271-7dba06512231 |   8 | (0,8)
                 9 | 019ad94d-0131-73a5-8911-5ec5d446c8a9 |   9 | (0,9)
                10 | 019ad94d-0131-73aa-a4a3-0e5c14f09374 |  10 | (0,10)
                11 | 019ad94d-0131-73af-ac4b-3710e221390e |  11 | (0,11)
                12 | 019ad94d-0131-73b4-85d6-ed575d11e9cf |  12 | (0,12)
                13 | 019ad94d-0131-73b9-b802-d5695f5bf781 |  13 | (0,13)
                14 | 019ad94d-0131-73be-bcb0-b0775dab6dd4 |  14 | (0,14)
                15 | 019ad94d-0131-73c3-9ec8-c7400b5c8983 |  15 | (0,15)
                16 | 019ad94d-0131-73c8-b067-435258087b3a |  16 | (0,16)
                17 | 019ad94d-0131-73cd-a03f-a28092604fb1 |  17 | (0,17)
                18 | 019ad94d-0131-73d3-b4d5-02516d5667b5 |  18 | (0,18)
                19 | 019ad94d-0131-73d8-9c41-86fa79f74673 |  19 | (0,19)
                20 | 019ad94d-0131-73dd-b9f1-dcd07598c35d |  20 | (0,20)
Here, seq_in_uuid_order, ord, and ctid all follow each other nicely – ord increases by 1 for each row, ctid moves sequentially through the first heap page, and UUIDs themselves are monotonic because of the timestamp prefix. For index scans on the primary key, this means Postgres can walk the heap in a much more sequential way than with UUIDv4.
How sequential are these values statistically?
After VACUUM ANALYZE, I ask the planner what it thinks about the correlation between id and the physical order:
SELECT
    tablename,
    attname,
    correlation
FROM pg_stats
WHERE tablename IN ('uuidv4_demo', 'uuidv7_demo')
AND attname = 'id'
ORDER BY tablename, attname;
Result:
   tablename | attname | correlation
-------------+---------+---------------
 uuidv4_demo |      id | -0.0024808696
 uuidv7_demo |      id |             1
The statistics confirm what we just saw:
- For uuidv4_demo.id, the correlation is essentially 0 ⇒ values are random with respect to heap order.
- For uuidv7_demo.id, the correlation is 1 ⇒ perfect alignment between UUID order and physical row order in this test run.
That high correlation is exactly why UUIDv7 is so attractive as a primary key for B‑tree indexes.
Primary key indexes: size, leaf pages, density, fragmentation
Next I look at the primary key indexes – their size, number of leaf pages, density, and fragmentation – using pgstatindex:
SELECT 'uuidv4_demo_pkey' AS index_name, (pgstatindex('uuidv4_demo_pkey')).*;

        index_name | uuidv4_demo_pkey
           version | 4
        tree_level | 2
        index_size | 40026112
     root_block_no | 295
    internal_pages | 24
        leaf_pages | 4861
       empty_pages | 0
     deleted_pages | 0
  avg_leaf_density | 71
leaf_fragmentation | 49.99

SELECT 'uuidv7_demo_pkey' AS index_name, (pgstatindex('uuidv7_demo_pkey')).*;

        index_name | uuidv7_demo_pkey
           version | 4
        tree_level | 2
        index_size | 31563776
     root_block_no | 295
    internal_pages | 20
        leaf_pages | 3832
       empty_pages | 0
     deleted_pages | 0
  avg_leaf_density | 89.98      -- i.e. standard 90% fillfactor
leaf_fragmentation | 0
We can immediately see that the primary key index on UUIDv4 is about 26–27% bigger:
- index_size is ~40 MB vs ~31.6 MB
- leaf_pages are 4861 vs 3832 (again about 26–27% more)
- leaf pages in the v4 index have lower average density (71 vs ~90)
- leaf_fragmentation for v4 is about 50%, while for v7 it is 0
So UUIDv4 forces the B‑tree to allocate more pages and keep them less full, and it fragments the leaf level much more.
Deeper index analysis with bt_multi_page_stats
To go deeper, I examined the B‑tree indexes page by page and built some statistics. I used the following query for both indexes (just changing the index name in the CTE). The query calculates the minimum, maximum, and average number of tuples per index leaf page, and also checks how sequentially leaf pages are stored in the index file:
WITH leaf AS (
    SELECT *
    FROM bt_multi_page_stats('uuidv4_demo_pkey', 1, -1) -- from block 1 to end
    WHERE type = 'l'
)
SELECT
    count(*) AS leaf_pages,
    min(blkno) AS first_leaf_blk,
    max(blkno) AS last_leaf_blk,
    max(blkno) - min(blkno) + 1 AS leaf_span,
    round( count(*)::numeric / (max(blkno) - min(blkno) + 1), 3) AS leaf_density_by_span,
    min(live_items) AS min_tuples_per_page,
    max(live_items) AS max_tuples_per_page,
    avg(live_items)::numeric(10,2) AS avg_tuples_per_page,
    sum(CASE WHEN btpo_next = blkno + 1 THEN 1 ELSE 0 END) AS contiguous_links,
    sum(CASE WHEN btpo_next <> 0 AND btpo_next <> blkno + 1 THEN 1 ELSE 0 END) AS non_contiguous_links
FROM leaf;
Results for UUIDv4:
-- uuidv4_demo_pkey
          leaf_pages | 4861
      first_leaf_blk | 1
       last_leaf_blk | 4885
           leaf_span | 4885
leaf_density_by_span | 0.995
 min_tuples_per_page | 146
 max_tuples_per_page | 291
 avg_tuples_per_page | 206.72
    contiguous_links | 0
non_contiguous_links | 4860
Results for UUIDv7:
-- uuidv7_demo_pkey
          leaf_pages | 3832
      first_leaf_blk | 1
       last_leaf_blk | 3852
           leaf_span | 3852
leaf_density_by_span | 0.995
 min_tuples_per_page | 109
 max_tuples_per_page | 262
 avg_tuples_per_page | 261.96
    contiguous_links | 3812
non_contiguous_links | 19
As we can see- the UUIDv4 index has more leaf pages, spread over a larger span of blocks, and although it has higher minimum and maximum tuples per page, its average number of tuples per leaf page (206.72) is significantly lower than for UUIDv7 (261.96).
But these numbers can obscure the whole pictures. So, let’s look at histograms visualizing count of tuples in leaf pages. For this I will use following query with buckets between 100 and 300 and will list only non empty results:
WITH leaf AS (
    SELECT live_items
    FROM bt_multi_page_stats('uuidv4_demo_pkey', 1, -1)
    WHERE type = 'l'
),
buckets AS (
    -- bucket lower bounds: 100, 110, ..., 290
    SELECT generate_series(100, 290, 10) AS bucket_min
)
SELECT
    b.bucket_min AS bucket_from,
    b.bucket_min + 9 AS bucket_to,
    COUNT(l.live_items) AS page_count
FROM buckets b
LEFT JOIN leaf l
    ON l.live_items BETWEEN b.bucket_min AND b.bucket_min + 9
GROUP BY b.bucket_min HAVING count(l.live_items) > 0
ORDER BY b.bucket_min;
Result for UUIDv4:
 bucket_from | bucket_to | page_count
-------------+-----------+------------
         140 |       149 |        159
         150 |       159 |        435
         160 |       169 |        388
         170 |       179 |        390
         180 |       189 |        427
         190 |       199 |        466
         200 |       209 |        430
         210 |       219 |        387
         220 |       229 |        416
         230 |       239 |        293
         240 |       249 |        296
         250 |       259 |        228
         260 |       269 |        214
         270 |       279 |        171
         280 |       289 |        140
         290 |       299 |         21
Result for UUIDv7:
 bucket_from | bucket_to | page_count
-------------+-----------+------------
         100 |       109 |          1
         260 |       269 |       3831
There results nicely demonstrate huge fragmentation of UUIDv4 index and stable compact structure of UUIDv7 index. The lowest buckets in UUIDv4 histogram show cases of half empty leaf index pages, on the other hand pages with more than 270 tuples exceed 90% fillfactor, because PostgreSQL uses remaining free space to avoid split. In the UUIDv7 index all leaf pages except for one (the very last one in the tree) are filled up to 90% standard fillfactor.
Another important result is in the last two columns of index statistics:
- For UUIDv4: contiguous_links = 0, non_contiguous_links = 4860
- For UUIDv7: contiguous_links = 3812, non_contiguous_links = 19
btpo_next = blkno + 1 means the next leaf page in the logical B‑tree order is also the next physical block. With UUIDv4, that never happens in this test – the leaf pages are completely fragmented, randomly distributed over the index structure. With UUIDv7, almost all leaf pages are contiguous, i.e. nicely follow each other.
Also, when we examine the actual content of leaf pages, we can immediately see the randomness of UUIDv4 versus the sequential behavior of UUIDv7: UUIDv4 leaf pages point to heap tuples scattered all over the table, while UUIDv7 leaf pages tend to point into tight ranges of heap pages. The result is the same pattern we saw earlier when looking at ctid directly from the table, so I won’t repeat the raw dumps here.
A small gotcha: embedded timestamp in UUIDv7
There is one small gotcha with UUIDv7 values: they expose a timestamp of creation. PostgreSQL 18 exposes this explicitly via uuid_extract_timestamp():
SELECT
    id,
    uuid_extract_timestamp(id) AS created_at_from_uuid
FROM uuidv7_demo
ORDER BY ord
LIMIT 5;
Sample results:
                   id                 |       created_at_from_uuid
--------------------------------------+----------------------------
 019ad94d-0127-7aba-b9f6-18620afdea4a | 2025-12-01 09:44:53.799+00
 019ad94d-0131-72b9-823e-89e41d1fad73 | 2025-12-01 09:44:53.809+00
 019ad94d-0131-7384-b03d-8820be60f88e | 2025-12-01 09:44:53.809+00
 019ad94d-0131-738b-b3c0-3f91a0b223a8 | 2025-12-01 09:44:53.809+00
 019ad94d-0131-7391-ab84-a719ca98accf | 2025-12-01 09:44:53.809+00
If we look at the whole sequence of values, we can analyze the time deltas between record creations directly from the UUIDs, without any separate timestamp column. For some applications this could be considered a potential information leak (for example, revealing approximate creation times or request rates), while many others will most likely not care.
Summary
- UUIDs provide an enormous identifier space (128 bits, ~3.4 × 10^38 values) where the probability of collision is negligible for real‑world workloads.
- Traditional UUIDv4 keys are completely random. When used as primary keys in PostgreSQL, they tend to:
- fragment B‑tree indexes
- lower leaf page density
- cause highly random heap access patterns and more random I/O
- UUIDv7, introduced natively in PostgreSQL 18 as uuidv7(), keeps the 128‑bit space but reorders the bits so that:
- the most significant bits contain a Unix timestamp with millisecond precision (plus sub‑millisecond fraction)
- the remaining bits stay random
- In practical tests with 1M rows per table:
- The UUIDv7 primary key index was about 26–27% smaller, with fewer leaf pages and much higher average leaf density
- Leaf pages in the UUIDv7 index were overwhelmingly physically contiguous, whereas the UUIDv4 leaf pages were completely fragmented
- An ORDER BY id query over UUIDv7 was roughly three times faster in my run than the same query over UUIDv4, thanks to better index locality and more sequential heap access
The trade‑off is that UUIDv7 embeds a timestamp, which might expose approximate creation times, but for most use cases this is acceptable or even useful. So, UUIDv7 significantly improves the performance and physical layout of UUID primary keys in PostgreSQL, not by abandoning randomness, but by adding a time‑ordered prefix. In PostgreSQL 18, that gives us the best of both worlds: the huge identifier space and distributed generation benefits of UUIDs, with index behavior much closer to a classic sequential BIGINT primary key.
PostgreSQL is an open-source database provided by the PostgreSQL developers. The PostgreSQL Elephant Logo (“Slonik”), Postgres and PostgreSQL are registered trademarks by the PostgreSQL Community Association.
We at credativ provide comprehensive support and consulting services running PostgreSQL and other open-source systems.
The European PostgreSQL Conference (PGConf.EU) is one of the largest PostgreSQL events worldwide. In this year it was held 21–24 October in Riga, Latvia. Our company, credativ GmbH, was a bronze sponsor of the conference, and I had the privilege to represent credativ with my talk “Database in Distress: Testing and Repairing Different Types of Database Corruption.” In addition, I volunteered as a session host on Thursday and Friday. The conference itself covered a wide range of PostgreSQL topics – from cloud-native deployments to AI integration, from large-scale migrations to resiliency. Below are highlights from sessions I attended, organised by day.
My talk about database corruption
I presenting my talk on Friday afternoon. In it I dove into real-world cases of PostgreSQL database corruption I encountered over the past two years. To investigate these issues, I built a Python tool that deliberately corrupts database pages and then examined the results using PostgreSQL’s pageinspect extension. During the talk I demonstrated various corruption scenarios and the errors they produce, explaining how to diagnose each case. A key point was that PostgreSQL 18 now enables data checksums by default at initdb. Checksums allow damaged pages to be detected and safely “zeroed out” (skipping corrupted data) during recovery. Without checksums, only pages with clearly corrupted headers can be automatically removed using the zero_damaged_pages = on setting. Other types of corruption require careful manual salvage. I concluded by suggesting improvements (in code or settings) to make recovery easier on clusters without checksums.
Tuesday: Kubernetes and AI Summits
Tuesday began with two half-day Summits. The PostgreSQL on Kubernetes Summit explored running Postgres in cloud-native environments. Speakers compared Kubernetes operators (CloudNativePG, Crunchy, Zalando, etc.), backup/recovery in Kubernetes, scaling strategies, monitoring, and zero-downtime upgrades. They discussed operator architectures and multi-tenant DBaaS use cases. Attendees gained practical insight into trade-offs of different operators and how to run Kubernetes-based Postgres for high availability.
In the PostgreSQL & AI Summit, experts examined Postgres’s role in AI applications. Topics included vector search (e.g. pgvector), hybrid search, using Postgres as context storage for AI agents, conversational query interfaces, and even tuning Postgres with machine learning. Presenters shared best practices and integration strategies for building AI-driven solutions with Postgres. In short, the summit explored how PostgreSQL can serve AI workloads (and vice versa) and what new features or extensions are emerging for AI use cases.
Wednesday: Migrations, Modelling, and Performance
Joaquim Oliveira (European Space Agency) discussed moving astronomy datasets (from ESA’s Gaia and Euclid missions) off Greenplum. The team considered both scaling out with Citus and moving to EDB’s new Greenplum-based cloud warehouse. He covered the practical pros and cons of each path and the operational changes required to re-architect such exascale workloads. The key lesson was planning architecture, tooling, and admin shifts needed before undertaking a petabyte-scale migration.
Boriss Mejias (EDB) emphasised that data modelling is fundamental to software projects. Using a chess-tournament application as an example, he showed how to let PostgreSQL enforce data integrity. By carefully choosing data types and constraints, developers can embed much of the business logic directly in the schema. The talk demonstrated “letting PostgreSQL guarantee data integrity” and building application logic at the database layer.
Roberto Mello (Snowflake) reviewed the many optimizer and execution improvements in Postgres 18. For example, the planner now automatically eliminates unnecessary self-joins, converts IN (VALUES…) clauses into more efficient forms, and transforms OR clauses into arrays for faster index scans. It also speeds up set operations (INTERSECT, EXCEPT), window aggregates, and optimises SELECT DISTINCT and GROUP BY by reordering keys and ignoring redundant columns. Roberto compared query benchmarks across Postgres 16, 17, and 18 to highlight these gains.
Nelson Calero (Pythian) shared a “practical guide” for migrating 100+ PostgreSQL databases (from gigabytes to multi-terabytes) to the cloud. His team moved hundreds of on-prem VM databases to Google Cloud SQL. He discussed planning, downtime minimisation, instance sizing, tools, and post-migration tuning. In particular, he noted challenges like handling old version upgrades, inheritance schemas, PostGIS data, and service-account changes. Calero’s advice included choosing the right cloud instance types, optimising bulk data loads, and validating performance after migration.
Jan Wieremjewicz (Percona) recounted implementing Transparent Data Encryption (TDE) for Postgres via the pg_tde extension. He took the audience through the entire journey – from the initial idea, through patch proposals, to community feedback and design trade-offs. He explained why existing PostgreSQL hooks weren’t enough, what friction was encountered, and how customer feedback shaped the final design. This talk served as a “diary” of what it takes to deliver a core encryption feature through the PostgreSQL development process.
Stefan Fercot (Data Egret) demonstrated how to use Patroni (for high availability) together with pgBackRest (for backups). He walked through YAML configuration examples showing how to integrate pgBackRest into a Patroni-managed cluster. Stefan showed how to rebuild standby replicas from pgBackRest backups and perform point-in-time recovery (PITR) under Patroni’s control. The talk highlighted real-world operational wisdom: combining these tools provides automated, repeatable disaster recovery for Postgres clusters.
Thursday: Cloud, EXPLAIN, and Resiliency
Maximilian Stefanac and Philipp Thun (SAP SE) explained how SAP uses PostgreSQL within Cloud Foundry (SAP’s open-source PaaS). They discussed optimisations and scale challenges of running Postgres for SAP’s Business Technology Platform. Over the years, SAP’s Cloud Foundry team has deployed Postgres on AWS, Azure, Google Cloud, and Alibaba Cloud. Each provider’s offerings differ, so unifying automation and monitoring across clouds is a major challenge. The talk highlighted how SAP contributes Postgres performance improvements back to the community and what it takes to operate large-scale, cloud-neutral Postgres clusters.
In “EXPLAIN: Make It Make Sense,” Aivars Kalvāns (Ebury) helped developers interpret query plans. He emphasized that after identifying a slow query, you must understand why the planner chose a given plan and whether it is optimal. Aivars walked through EXPLAIN output and shared rules of thumb for spotting inefficiencies – for example, detecting missing indexes or costly operators. He illustrated common query anti-patterns he has seen in practice and showed how to rewrite them in a more database-friendly way. The session gave practical tips for decoding EXPLAIN and tuning queries.
Chris Ellis (Nexteam) highlighted built-in Postgres capabilities that simplify application development. Drawing on real-world use cases – such as event scheduling, task queues, search, geolocation, and handling heterogeneous data – he showed how features like range types, full-text search, and JSONB can reduce application complexity. For each use case, Chris demonstrated which Postgres feature or data type could solve the problem. This “tips & tricks” tour reinforced that leveraging Postgres’s rich feature set often means writing less custom code.
Andreas Geppert (Zürcher Kantonalbank) described a cross-cloud replication setup for disaster resilience. Faced with a requirement that at most 15 minutes of data could be lost if any one cloud provider failed, they could not use physical replication (since their cloud providers don’t support it). Instead, they built a multi-cloud solution using logical replication. The talk covered how they keep logical replicas up-to-date even as schemas change (noting that logical replication doesn’t automatically copy DDL). In short, logical replication enabled resilient, low-RPO operation across providers despite schema evolution.
Derk van Veen (Adyen) tackled the deeper rationale behind table partitioning. He emphasised the importance of finding the right partition key – the “leading figure” in your data – and then aligning partitions across all related tables. When partitions share a common key and aligned boundaries, you unlock multiple benefits: decent performance, simplified maintenance, built-in support for PII compliance, easy data cleanup, and even transparent data tiering. Derk warned that poorly planned partitions can hurt performance terribly. In his case, switching to properly aligned partitions (and enabling enable_partitionwise_join/_aggregate) yielded a 70× speedup on 100+ TB financial tables. All strategies he presented have been battle-tested in Adyen’s multi-100 TB production database.
Friday: Other advanced Topics
Nicholas Meyer (Academia.edu) introduced thin cloning, a technique for giving developers real production data snapshots for debugging. Using tools like DBLab Engine or Amazon Aurora’s clone feature, thin cloning creates writable copies of live data inexpensively. This lets developers reproduce production issues exactly – including data-dependent bugs – by debugging against these clones of real data. Nicholas explained how Academia.edu uses thin clones to catch subtle bugs early by having dev and QA teams work with near-production data.
Dave Pitts (Adyen) explained why future Postgres applications may use both B-tree and LSM-tree (log-structured) indexes. He outlined the fundamental differences: B-trees excel at point lookups and balanced reads/writes, while LSM-trees optimise high write throughput and range scans. Dave discussed “gotchas” when switching workloads between index types. The talk clarified when each structure is advantageous, helping developers and DBAs choose the right index for their workload.
A panel led by Jimmy Angelakos addressed “How to Work with Other Postgres People”. The discussion focused on mental health, burnout, and neurodiversity in the PostgreSQL community. Panelists highlighted that unaddressed mental-health issues cause stress and turnover in open-source projects. They shared practical strategies for a more supportive culture: personal “README” guides to explain individual communication preferences, respectful and empathetic communication practices, and concrete conflict resolution techniques. The goal was to make the Postgres community more welcoming and resilient by understanding diverse needs and supporting contributors effectively.
Lukas Fittl (pganalyze) presented new tools for tracking query plan changes over time. He showed how to assign stable Plan IDs (analogous to query IDs) so that DBAs can monitor which queries use which plan shapes. Lukas introduced the new pg_stat_plans extension (leveraging Postgres 18’s features) for low-overhead collection of plan statistics. He explained how this extension works and compared it to older tools (the original pg_stat_plans, pg_store_plans, etc.) and cloud provider implementations. This makes it easier to detect when a query’s execution plan changes in production, aiding performance troubleshooting.
Ahsan Hadi (pgEdge) described pgEdge Enterprise PostgreSQL, a 100% open-source distributed Postgres platform. pgEdge Enterprise Postgres provides built-in high availability (using Patroni and read replicas) and the ability to scale across global regions. Starting from a single-node Postgres, users can grow to a multi-region cluster with geo-distributed replicas for extreme availability and low latency. Ahsan demonstrated how pgEdge is designed for organizations that need to scale from single instances to large distributed deployments, all under the standard Postgres license.
Conclusion
PGConf.EU 2025 was an excellent event for sharing knowledge and learning from the global PostgreSQL community. I was proud to represent credativ and to help as a volunteer, and I’m grateful for the many insights gained. The sessions above represent just a selection of the rich content covered at the conference. Overall, PostgreSQL’s strong community and rapid innovation continue to make these conferences highly valuable. I look forward to applying what I learned in my work and to attending future PGConf.EU events.
As I explained in my talk on PostgreSQL Conference Europe 2025, data corruption can be silently present in any PostgreSQL database and will remain undetected until we physically read corrupted data. There can be many reasons why some data blocks in tables or other objects can be damaged. Even modern storage hardware is far from being infallible. Binary backups done with pg_basebackup tool – which is very common backup strategy in PostgreSQL environment – leave these problems hidden. Because they do not check data but copy whole data files as they are. With release of PostgreSQL 18, the community decided to turn on data‑checksums by default – a major step toward early detection of these failures. This post examines how PostgreSQL implements checksums, how it handles checksum failures, and how we can enable them on existing clusters.

Why checksums matter
A PostgreSQL table or index is stored in 8 KB pages. When a page is written to disk, PostgreSQL computes a 16‑bit checksum using every byte of the page (except the checksum field itself) and the page’s physical block address. The checksum is stored in the page header. On every read, PostgreSQL recalculates the checksum and compares it against the stored value. Because the block address is part of the calculation, the system detects both bit flips within the page and pages written to the wrong place. Checksums are not maintained while the page sits in shared buffers – they are computed only when the page is flushed from the buffer cache to the operating system page cache. Consequently, an incorrect in‑memory page cannot be detected until it is written and read again. PostgreSQL uses a fast FNV‑1a hash (with CRC32C on WAL records) that is optimized for performance. On typical hardware the cost of calculating checksum seems to be small. A benchmarking studies found the penalty is usually less than 2 % for normal workloads. PostgreSQL 18’s release notes acknowledge that the overhead is non‑zero but accept it for the benefit of data integrity.
Changes in PostgreSQL 18
- Cluster upgrades must match checksum settings (explicitly mentioned in PostgreSQL 18 release notes). When upgrading via pg_upgrade, the source and target clusters must both have checksums enabled or disabled. If you need to upgrade from an older cluster without checksums, initialise the new cluster with –no‑data‑checksums or enable checksums on the old cluster first.
- Statistics to monitor failures – PostgreSQL already has two columns in pg_stat_database: checksum_failures, counting the number of pages whose checksums failed, and checksum_last_failure, the timestamp of the most recent failure. These metrics allow you to alert on corruption events across all databases in the cluster.
To see whether our cluster uses data‑checksums, we shall inspect the read‑only system variable data_checksums using command: “SHOW data_checksums;” A result of “ON” means that data‑page checksums are active.
Enabling and disabling checksums with pg_checksums
- The cluster must be shut down cleanly before running pg_checksums.
- Verifying checksums (–check) scans every file in PGDATA and returns a non‑zero exit code if any mismatch is found.
- Enabling checksums (–enable) rewrites each relation block, updating the checksum field on disk. Disabling checksums (–disable) only updates the control file – it does not rewrite pages.
- Options such as –progress display progress, –no-sync skips fsync after modifications, and –filenode restricts verification to a specific relation.
- On large or replicated clusters, enabling checksums can take a long time; all standbys must be stopped or recreated so that all nodes maintain the same checksum state (explicitly mentioned in documentation).
Upgrade strategy
- Disable checksums on the new cluster: run initdb with –no‑data‑checksums so that pg_upgrade allows the migration. After the upgrade you can enable checksums offline using pg_checksums –enable.
- Enable checksums on the old cluster first: shut down the old server, run pg_checksums –enable -D $PGDATA (on every node if using streaming replication), then start the server and verify the new SHOW data_checksums value. When you initialise PostgreSQL 18, it will inherit the enabled state.
Handling checksum failures
- ignore_checksum_failure – When off (default), the server aborts the current transaction on the first checksum error. Setting it to on logs a warning and continues processing, allowing queries to skip over corrupted blocks. This option may hide corruption, cause crashes or return incorrect data; only superusers can change it.
- zero_damaged_pages – When a damaged page header or checksum is detected, setting this parameter to on causes PostgreSQL to replace the entire 8 KB page in memory with zeroes and then continue processing. The zeroed page is later written to disk, destroying all tuples on that page. Use this only when you have exhausted backup or standby options. Turning zero_damaged_pages off does not restore data and only affects how future corrupt pages are handled.
-- With ignore_checksum_failure=off the query stops on the first error:
test=# SELECT * FROM pg_toast.pg_toast_17453;
WARNING:  page verification failed, calculated checksum 19601 but expected 152
ERROR:    invalid page in block 0 of relation base/16384/16402

-- With ignore_checksum_failure=on, the server logs warnings and continues scanning until it find good data:
test=# SET ignore_checksum_failure = ON;
test=# SELECT * FROM pg_toast.pg_toast_17453;
WARNING:  page verification failed, calculated checksum 29668 but expected 57724
WARNING:  page verification failed, calculated checksum 63113 but expected 3172
WARNING:  page verification failed, calculated checksum 59128 but expected 3155
test=# SET zero_damaged_pages = ON;
test=# SELECT * FROM pg_toast.pg_toast_17453;
WARNING:  page verification failed, calculated checksum 29668 but expected 57724
WARNING:  invalid page in block 204 of relation base/16384/17464; zeroing out page
WARNING:  page verification failed, calculated checksum 63113 but expected 3172
WARNING:  invalid page in block 222 of relation base/16384/17464; zeroing out page
Internally the buffer manager performs this zeroing by calling memset() on the 8 KB page when the verification fails and the READ_BUFFERS_ZERO_ON_ERROR flag is set. If the flag is not set, the buffer is marked invalid and an error is thrown. We must of course understand, that checksums and ignore_checksum_failure and zero_damaged_pages settings cannot repair damages data blocks. These options are last resorts for salvaging remaining rows. Their usage will always lead to data loses. Once page is zeroed out in the memory, its previous corrupted content cannot be restored, even if we set zero_damaged_pages back to OFF. To get original good data back we must restore them from a known good backup or standby.
Autovacuum interaction
Vacuum processes may encounter corrupted pages while scanning tables. Because automatically zeroing pages could silently destroy data, the autovacuum launcher forcibly disables zero_damaged_pages for its workers. The source code calls SetConfigOption with “zero_damaged_pages”, “false” with a comment explaining that this dangerous option should never be applied non‑interactively. This way corrupted pages will be zeroed out only when we directly work with them.
Why we shall embrace checksums
/*
* The following checks don't prove the header is correct, only that
* it looks sane enough to allow into the buffer pool. Later usage of
* the block can still reveal problems, which is why we offer the
* checksum option.
*/
if ((p->pd_flags & ~PD_VALID_FLAG_BITS) == 0 &&
p->pd_lower <= p->pd_upper &&
p->pd_upper <= p->pd_special &&
p->pd_special <= BLCKSZ &&
p->pd_special == MAXALIGN(p->pd_special))
header_sane = true;

if (header_sane && !checksum_failure)
return true;
SELECT * FROM page_header(get_raw_page('pg_toast.pg_toast_32840', 100));
    lsn     | checksum | flags | lower | upper | special | pagesize | version | prune_xid
------------+----------+-------+-------+-------+---------+----------+---------+-----------
 0/2B2FCD68 |        0 |     4 |    40 |    64 |    8192 |     8192 |       4 |         0
(1 row)ERROR: XX001-invalid page in block 578 of relation base/16384/28751
ERROR:  invalid memory alloc request size 18446744073709551594
DEBUG:  server process (PID 76) was terminated by signal 11: Segmentation fault
58P01 - could not access status of transaction 3047172894
XX000 - MultiXactId 1074710815 has not been created yet -- apparent wraparound
WARNING:  Concurrent insert in progress within table "test_table_bytea"
With these errors, we can face difficult and time consuming manual repairs and data salvage if we do not have reliable backup which we could use for restoring data. These descriptions clearly show that enabling data checksums is a very important change for PostgreSQL community.
Conclusion
We are happy to help!
Whether it’s Ansible, Debian, Proxmox, Kubernetes or PostgreSQL, with over 25+ years of development and service experience in the open source space, credativ GmbH can assist you with unparalleled and individually customizable support. We are there to help and assist you in all your open source infrastructure needs.
Do you have any questions about our article or would you like credativ’s specialists to take a look at another software of your choice?
Then stop by and get in touch via our contact form or drop us an email at [email protected].
About credativ
The credativ GmbH is a manufacturer-independent consulting and service company located in Moenchengladbach, Germany.
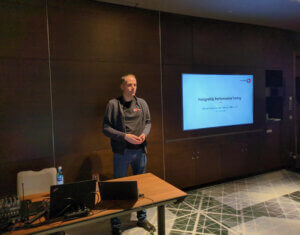
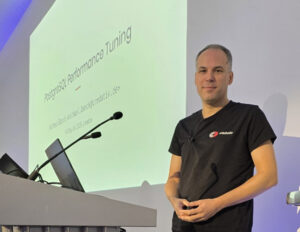
The third annual PGDay UK was (again) held at the Cavindish Conference Center in London this year, and I participated for the first time with an updated English version of my PGConf.DE talk, “PostgreSQL Performance Tuning”.

The conference is a one-day, one-track event with an auditorium and a sponsor hall for breaks. Around 75 visitors participated in this year’s conference.
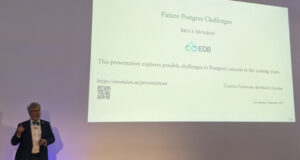
After the welcome session, the first talk was by Bruce Momjian on “Future Postgres Challenges” – a thoughtful compilation on the current status and possible future challenges for Postgres. It looks like the project is currently healthy, and some of the cautionary tales he cited from other open source projects (CentOS, GCC fork, etc.) probably will not apply to Postgres, at least not for a long while. He also mentioned some technological challenges however, and this part (especially attracting young talent to a C code base) looks more worrisome.
Besides the talks, there were also ample discussions with the participants, sponsors and other speakers. I had long discussions with Michael Christofides from pgMustard about his Postgres.FM podcast, and with our ex-colleague Robert Treat, besides others.


After the conference, some of the participants moved over to a nearby pub for beers and further socializing. Many of the speakers, sponsors and organizers travelled onwards the next day to PGDay Lowlands, which took place later in the week in Rotterdam (see our report from that event here). All in all, this was a very successful (albeit smallish) event.
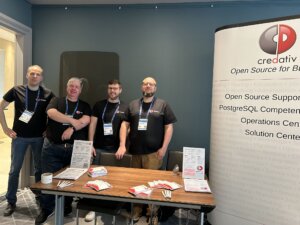
On Friday, September 12th, we attended PGDay Lowlands 2025 in Rotterdam and it was definitely a conference to remember. It took place at the Blijdorp Zoo in Rotterdam, in the Oceanium building. It was an unforgettable experience to discuss databases while surrounded by various fish, sharks, and rays. Our company credativ GmbH, as an enterprise-grade open-source support provider for PostgreSQL, was a sponsor of the event and we had a booth there to meet attendees. Our CTO Alexander Wirt and our PostgreSQL expert Joop Boonen met visitors on our booth and discussed with them many technical aspects of PostgreSQL.
My Talk about Database Corruption
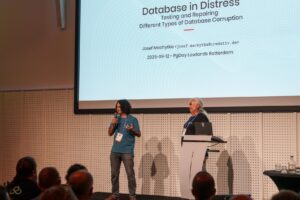
I represented our company also as a speaker, giving a talk titled “Database in Distress: Testing and Repairing Different Types of Database Corruption.” This talk summarized my experiences with database corruption. I’ve seen many corruption issues while repairing live systems. So I built a Python corruption simulator, which surgically damages selected parts of a data block in a testing table, and I used different PostgreSQL extensions to analyze these cases. The talk walked through examples of page-level corruption and discussed strategies for recovery. At the end of my talk, I discussed potential new Postgres features or settings that could make repairs less painful in the future. After the talk, many attendees came to our booth to discuss their experiences with specific corruption cases, which also sparked greater interest in credativ’s services.
Other Talks and Highlights
- Opening remarks – Boriss Mejias, as the organizer and guide, opened the conference by emphasizing the value of the community around PostgreSQL. Personally,
- Jimmy Angelakos – “How Do We Get Postgres to the Next Level?”
This talk was inspired by the one given by Simon Riggs in December 2023 in Prague. Jimmy offered different insights to keep improving PostgreSQL by making it more modular, boosting test coverage, creating a team specialized only in performance issues, and adding some new cutting-edge features. In particular, he mentioned goals like 100% regression testing, online major-version upgrades, and optional multi-threading – all part of a roadmap to solidify PostgreSQL’s lead. - Gulçin Yıldırım Jelinek – “Anatomy of Table-Level Locks in PostgreSQL”
This was an intermediate deep dive into DDL locks: explaining Access Share, Exclusive, Access Exclusive locks, and how they queue during ALTER or DROP commands. She showed how to interpret lock waits and deadlocks, and shared practical tips (like using online schema-change tools) to achieve near-zero downtime during migrations. - Chris Ellis – “Fun With UUIDs“
I very much enjoyed this talk. UUIDs have a bad reputation, mostly because randomly allocated UUIDs negatively affect indexes. But UUIDs also give us 16 bytes of space to play with, which can be to our advantage. Chris showed how to use the space of UUIDs to structure and encode data within identifiers to distinguish tenants, shards, or partitions. - Johannes Paul – “Actual trees, not b-trees – how I found PostgreSQL through PostGIS”
Speaker charmed the auditorium with the story of a neighbor’s climate-monitoring project mapping real-life tree data across Germany. Because he needed efficient geographic searches, Johannes switched to using PostGIS on PostgreSQL for his web app. - Dirk Krautschick – “Beyond Postgres – Insights about the PostgreSQL Extensibility”
Dirk emphasized that Postgres is designed to be lightweight yet powerful via extensions. He explained the extension framework and sketched out how to write a new extension for extra functionality. - Andreas Scherbaum – “What I learned interviewing the PostgreSQL Community”
I enormously enjoyed this talk . Andreas has been running the postgresql.life interview series and distilled some fun stats from them. It was a charming “state of the community” talk with interesting charts and quotes. - The final debate on “Autotuning in Postgres” was also very interesting. The PRO side (Luigi Nardi, Gianni Ciolli) argued that autotuning tools can save DBAs hours of manual work. But the CON side (Mayuresh S. Bagayatkar, Guy Gyles) countered that blindly auto-changing settings might over-tune and even hurt performance, since machines lack the human context for every deployment and current AI has no concept of truth.
Reflections
PGDay Lowlands 2025 was a fantastic experience. The mix of deep technical content and the relaxed zoo setting made for a friendly, engaging atmosphere. It was great to meet so many users and contributors and to hear about real-world problems, and even pick up new ideas for future work. I’m proud that credativ could play a role in such a great community event. PostgreSQL continues to grow and evolve, with people thinking hard about different issues, from locks and extensions to automatic tuning, and the community’s energy is truly inspiring. We are already looking forward to PGDay Lowlands 2026!
 With the release of the beta version of PostgreSQL 18, an exciting new feature was introduced: native support for OAuth2. Since I couldn’t find any guide or blog post online showing how to use this feature, I decided out of curiosity to try it out myself.
I created a new project directory and started experimenting.
Environment and Objective
The goal was to set up PostgreSQL 18 Beta with OAuth2 authentication; for the identity provider, I chose Keycloak.
I decided to use Docker Compose to quickly and easily spin up both services.
Docker Compose Configuration
Here is the docker-compose.yml, which I used:
services:
  mock-oauth2:
    image: quay.io/keycloak/keycloak:24.0
    command: start --https-port=8080 --https-key-store-file=/etc/x509/https/localhost.p12 --https-key-store-password=changeit --import-realm --hostname-strict=false --hostname-url=https://mock-oauth2:8080
    ports:
      - "8080:8080"
    environment:
      KEYCLOAK_ADMIN: admin
      KEYCLOAK_ADMIN_PASSWORD: admin
    volumes:
      - ./certs:/etc/x509/https
      - ./keycloak-realm.json:/opt/keycloak/data/import/realm.json
    networks:
      - pgnet

  postgres18:
    build: .
    ports:
      - "5432:5432"
    environment:
      POSTGRES_PASSWORD: postgres
    volumes:
      - ./postgres/postgresql.conf:/etc/postgresql/postgresql.conf
      - ./postgres/pg_hba.conf:/etc/postgresql/pg_hba.conf
    command: ["-c", "config_file=/etc/postgresql/postgresql.conf"]
    networks:
      - pgnet

networks:
  pgnet:
    driver: bridge
PostgreSQL expects a connection to the OAuth2 issuer via HTTPS. The same URL must also be accessible from the host, for example, when using the Keycloak UI. This means the certificate must be valid and trusted on both the host and in the container.
The hostname used (e.g., https://mock-oauth2:8080) must be correctly resolvable in both environments.
For this, I added the following line to my /etc/hosts file on the host:
127.0.0.1 mock-oauth2This allowed both the PostgreSQL container and my host to reach the Keycloak service at https://mock-oauth2:8080.
TLS Certificate for Keycloak
Keycloak absolutely requires an HTTPS endpoint for the OAuth2 issuer URL to be accepted by PostgreSQL.
For this, I created a self-signed certificate and converted it into a .p12 keystore package that Keycloak can use.
The .p12 certificate is integrated into the container via the following mount:
volumes:
  - ./certs:/etc/x509/https
In the certs directory, there is the localhost.p12 file, which I created from my self-signed key and certificate as follows:
openssl req -x509 -nodes -days 365 \
  -newkey rsa:2048 \
  -keyout server.key \
  -out server.crt \
  -subj "/CN=mock-oauth2" \
  -addext "subjectAltName = DNS:mock-oauth2,DNS:localhost,IP:127.0.0.1"
Keycloak Realm Configuration
I created a minimalist realm file for Keycloak. It contains a client named postgres and a user with corresponding credentials.
Content of keycloak-realm.json:
{
  "realm": "pg",
  "enabled": true,
  "clients": [
    {
      "clientId": "postgres",
      "enabled": true,
      "publicClient": false,
      "redirectUris": ["*"],
      "protocol": "openid-connect",
      "secret": "postgres",
      "directAccessGrantsEnabled": true,
      "standardFlowEnabled": true
    }
  ],
  "users": [
    {
      "username": "postgres",
      "enabled": true,
      "credentials": [
        {
          "type": "password",
          "value": "postgres"
        }
      ]
    }
  ]
}
After importing the realm, Keycloak was ready and the default scope was visible in the UI.
Installation of libpq-oauth and oauth_validator
I had to extend the official PostgreSQL image to include additional dependencies such as the extension libpq-oauth as well as the validator oauth_validator to install.
PostgreSQL 18 experimentally supports OAuth2 authentication. However, PostgreSQL does not provide its own validator library. The official documentation states:
The PostgreSQL distribution does not include libraries for validating OAuth2 tokens. Users must provide their own solution or compile one themselves.
PostgreSQL
Docs –oauth_validator_libraries
For testing, I used the following open-source implementation:
This minimalist C library can be compiled and used as oauth_validator_library in PostgreSQL.
Used Dockerfile
FROM postgres:18beta1

USER root

RUN apt-get update \
    && apt-get install -y libpq-oauth build-essential libkrb5-dev \
       libsasl2-dev libcurl4-openssl-dev postgresql-server-dev-18 git \
    && git clone https://github.com/TantorLabs/oauth_validator.git /tmp/oauth_validator \
    && cd /tmp/oauth_validator \
    && make && make install \
    && rm -rf /tmp/oauth_validator \
    && apt-get remove -y build-essential git \
    && apt-get autoremove -y && rm -rf /var/lib/apt/lists/*
I then used this image for the `postgres18` service in my Docker Compose setup.
Making PostgreSQL Trust the Keycloak CA
PostgreSQL must trust the certificate presented by Keycloak, otherwise the connection to the OAuth2 issuer will be rejected.
For this, I copied the `mock-oauth.crt` file into the PostgreSQL container and placed it in the typical CA path:
/usr/local/share/ca-certificates/Then, inside the container, I executed the following command:
update-ca-certificatesAfter that, the certificate was accepted, and PostgreSQL could successfully verify the connection to the HTTPS issuer.
PostgreSQL Configuration
In pg_hba.conf , I added the following line:
host all all all oauth scope="profile" issuer="https://mock-oauth2:8080/realms/pg" map="oauthmap"In pg_ident.conf, I mapped the identity provided by the token to the PostgreSQL user:
oauthmap "postgresID" "postgres"This mapping may need to be adjusted – depending on how your Keycloak client is configured and which field (e.g.,
preferred_username or sub) is passed in the token.
Connection Test with OAuth2
To test the connection, I used the following `psql` command:
psql "host=localhost \
      port=5432 \
      dbname=postgres \
      user=postgres \
      oauth_issuer=https://mock-oauth2:8080/realms/pg \
      oauth_client_id=postgres \
      oauth_client_secret=changeme \
      oauth_scope=profile"
After the call, a device code message appears, such as:
Visit `https://mock-oauth2:8080/realms/pg/device` and enter the code FBAD-XXYZ.
After logging in with the user credentials, `psql` successfully establishes a connection to PostgreSQL via OAuth2.
Insights and Tips
- PostgreSQL 18 requires HTTPS for the OAuth2 issuer URL – even in a local setup.
pg_hba.confis sensitive to formatting errors. I had to reload the configuration multiple times (SELECT pg_reload_conf();) and carefully analyze the logs.- To trust a local certificate authority, it is sufficient to copy the
.crtcertificate into the container and register it withupdate-ca-certificates. - Keycloak is well-suited for testing with OAuth2, but you may need to experiment with scopes, claims, and secrets until everything aligns with PostgreSQL.
Conclusion
This was an exciting, practical experiment with a promising new feature in PostgreSQL. OAuth2 integration brings PostgreSQL closer to modern identity management solutions and simplifies operations in environments with centralized authentication.
On Thursday, 26 June and Friday, 27 June 2025, my colleague Patrick Lauer and I had the amazing opportunity to attend Swiss PGDay 2025, held at the OST Eastern Switzerland University of Applied Sciences in Rapperswil. This two-day PostgreSQL conference featured two parallel tracks of presentations in English and German, bringing together users and experts primarily from across Switzerland. Our company, credativ, was among the supporters of this year’s conference.
During the event, Patrick delivered an engaging session titled “Postgres with many data: To MAXINT and beyond,” which built on past discussions about massive-scale Postgres usage. He highlighted the practical issues that arise when handling extremely large datasets in PostgreSQL – for instance, how even a simple SELECT COUNT(*) can become painfully slow, and how backups and restores can take days on very large datasets. He also shared strategies to manage performance effectively at these scales.
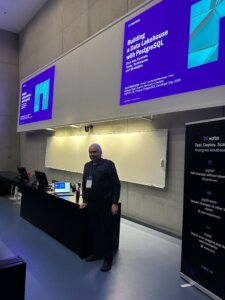
I presented a significantly updated version of my talk, “Building a Data Lakehouse with PostgreSQL: Dive into Formats, Tools, Techniques, and Strategies.” It covered modern data formats and frameworks such as Apache Iceberg, addressing key challenges in lakehouse architectures – from governance, privacy, and compliance, to data quality checks and AI/ML use cases. The talk emphasized PostgreSQL’s capability to play a central role in today’s data lakehouse and AI landscape. At the close of the conference, I delivered a brief lightning talk showcasing our new open-source migration tool, “credativ-pg-migrator.”
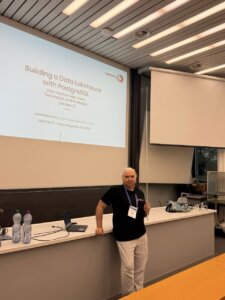
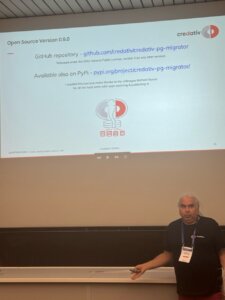
(c) photos by Gülçin Yıldırım Jelinek
The conference schedule was packed with many high-quality, insightful talks. We would particularly like to highlight:
* Bruce Momjian – “How Open Source and Democracy Drive Postgres”: In his keynote, Bruce Momjian outlined how PostgreSQL’s open-source development model and democratic governance have powered its success. He explained the differences between open-source and proprietary models, reviewed PostgreSQL’s governance history, and illustrated how democratic, open processes result in robust software and a promising future for Postgres.
* Gülçin Yıldırım Jelinek – “Anatomy of Table-Level Locks in PostgreSQL”: session covered the fundamentals of PostgreSQL’s table-level locking mechanisms. Explained how different lock modes are acquired and queued during schema changes, helping attendees understand how to manage lock conflicts, minimize downtime, and avoid deadlocks during high-concurrency DDL operations.
* Aarno Aukia – “Operating PostgreSQL at Scale: Lessons from Hundreds of Instances in Regulated Private Clouds”: the speaker shared lessons from running extensive Postgres environments in highly regulated industries. He discussed architectural patterns, automation strategies, and “day-2 operations” practices that VSHN uses to meet stringent availability, compliance, and audit requirements, including secure multi-tenancy, declarative deployments, backups, monitoring, and lifecycle management in mission-critical cloud-native setups.
* Bertrand Hartwig-Peillon – “pgAssistant”: Author introduced pgAssistant, an open-source tool designed to help developers optimize PostgreSQL schemas and queries before production deployment. He demonstrated how pgAssistant combines deterministic analysis with an AI-driven approach to detect schema inconsistencies and suggest optimizations, effectively automating best practices and performance tuning within development workflows.
* Gianni Ciolli – “The Why and What of WAL”: Gianni Ciolli provided in a great Italian style concise history and overview of PostgreSQL’s Write-Ahead Log (WAL). He explained WAL’s central role in PostgreSQL for crash safety, backups, and replication, showcasing examples of WAL-enabled features like fast crash recovery, efficient hot backups, physical replication, and logical decoding.
* Daniel Krefl – “Hacking pgvector for performance”: The speaker presented an enhanced version of the pgvector extension for massive data processing, optimized by maintaining the vector index outside PostgreSQL memory and offloading computations, including GPU integration. He detailed the process of moving pgvector’s core logic externally for improved speed, demonstrating notable performance gains in the EU AERO project context. He also talked about distributed PostgreSQL XC, XL and TBase, which are unfortunately stuck on the old version 10 and how he ported changes from these projects into the version 16.
* Luigi Nardi – “A benchmark study on the impact of PostgreSQL server parameter tuning”: Luigi Nardi presented comprehensive benchmark results on tuning PostgreSQL configuration parameters. Highlighting that many users default settings, he demonstrated how significant performance improvements can be achieved through proper tuning across various workloads (OLTP, OLAP, etc.), providing actionable insights tailored to specific environments.
* Renzo Dani – “From Oracle to PostgreSQL: A HARD Journey and an Open-Source Awakening”: Author recounted his experiences migrating a complex enterprise application from Oracle to PostgreSQL, addressing significant challenges such as implicit type casting, function overloading differences, JDBC driver issues, and SQL validation problems. He also highlighted the benefits, including faster CI pipelines, more flexible deployments, and innovation opportunities provided by open-source Postgres, along with practical advice on migration tools, testing strategies, and managing trade-offs.
(c) photo by Swiss PostgreSQL User Group
At the end of the first day, all participants enjoyed a networking dinner. We both want to sincerely thank the Swiss PGDay organizers (Swiss PostgreSQL User Group) for an amazing event. Swiss PGDay 2025 was a memorable and valuable experience, offering great learning and networking opportunities. We are also very grateful to credativ for enabling our participation, and we look forward to future editions of this excellent conference.
Many companies these days are thinking about migrating their databases from legacy or proprietary system to PostgreSQL. The primary aim is to reduce costs, enhance capabilities, and ensure long-term sustainability. However, even just the idea of migrating to PostgreSQL can be overwhelming. Very often, knowledge about the legacy applications is limited or even lost. In some cases, vendor support is diminishing, and expert pools and community support are shrinking. Legacy databases are also often running on outdated hardware and old operating systems, posing further risks and limitations. (more…)
PGConf.DE 2025, the 9th Annual PostgreSQL Conference Germany, was held on May 8–9, 2025, at the Marriott Hotel near Potsdamer Platz in Berlin. The event interconnected PostgreSQL enthusiasts, developers, DBAs, and industry sponsors for two days of fascinating talks across four parallel tracks. It was the biggest event so far, with 347 attendees. The whole conference was very well organized, and therefore special thanks are due to all the organizers—in particular Andreas Scherbaum, the main organizer—for their efforts and hard work.
Our company, credativ GmbH, being independent again, participated as a gold sponsor. The credativ CTO Alexander Wirt, Head of Sales & Marketing Peter Dreuw and team leader of Database team Tobias Kauder, were available for attendees at the credativ booth. Many thanks to our team colleague Sascha Spettmann for delivering all the stands and billboards to the conference and back again.
In total, we held four talks at the conference. Michael Banck, technical leader of our database team, presented the German-language talk “PostgreSQL Performance Tuning.” He provided a deep and comprehensive overview of the most important performance-tuning parameters in PostgreSQL and explained how they influence the database’s behavior. His talk attracted a large audience and was very well received.
I had an absolutely unique opportunity to present three different talks in the English track. In my regular talk “PostgreSQL Connections Memory Usage: How Much, Why and When,” I presented the results of my research and tests on PostgreSQL connections’ memory usage. After explaining the most important aspects of Linux memory management and measurements of memory usage reported by standard commands, I detailed PostgreSQL connection memory usage during query execution based on numbers reported in smaps files. I intend to publish detailed blog posts about my findings soon. My other talk, “Building a Data Lakehouse with PostgreSQL,” was originally chosen as a reserve talk in case of a last-minute cancellation. Unfortunately, this indeed happened: the talk “Creating a Board Game Chatbot with Postgres, AI, and RAG” by Matt Cornillon had to be replaced. The speaker could not attend because his flight was unexpectedly canceled at very short notice.
In the sponsor track, credativ CTO Alexander Wirt and I presented a talk titled “Your Data Deserves the Best: Migration to PostgreSQL.” It featured our new migration tool, “credativ-pg-migrator.” It is capable of migrating data models (tables, data, indexes, constraints, and views) from Informix, IBM DB2 LUW, MS SQL Server, Sybase ASE, SQL Anywhere, and MySQL/MariaDB. In the case of Informix, it can also convert stored procedures, functions, and triggers into PostgreSQL PL/pgSQL. We will share more details about this tool in a separate blog post.
Since there were always three or four parallel talks, I had to carefully choose which sessions to attend. I greatly enjoyed the talk “András in Windowsland – a DBA’s (mis)adventures” by András Váczi from Cybertec. The speaker presented many useful tips for accessing and troubleshooting PostgreSQL on Windows. I also enjoyed the German talk “Modern VACUUM,” delivered by Christoph Berg from Cybertec. He provided valuable insights into the history and implementation details of the VACUUM command and autovacuum background processes. Another very interesting talk was the German presentation “Modernes SSL ideal einsetzen” by Peter Eisentraut from EDB. The talk covered selecting appropriate protocol versions and cryptographic cipher suites, managing keys and certificates, and configuring client/server settings to meet contemporary security standards. The talk “Comparing the Oracle and PostgreSQL transaction systems,” delivered by Laurenz Albe from Cybertec, received a lot of well-deserved attention. Key topics included Oracle’s undo/redo mechanism versus PostgreSQL’s MVCC approach, differences in isolation level defaults and anomalies, and how each database implements constraints and transactional DDL. Last but not least, I want to mention the talk “What is an SLRU anyway?” delivered by major PostgreSQL contributor Álvaro Herrera. He explained that SLRUs are essentially circular logs with an in-memory cache used for tracking information such as committed transactions or snapshot data and he highlighted the significance of PostgreSQL 17’s innovations which made SLRU cache sizes configurable. Unfortunately, the talks were not recorded, but slides for the majority of the talks are already available on the conference website.
The whole event was highly informative and provided excellent networking opportunities. We are very much looking forward to participating in the next PGConf.DE. In the meantime, stay tuned to all credativ news, follow us on social media – LinkedIn and Mastodon.
If you are interested in our PostgreSQL related services, click here!
The Prague PostgreSQL Developer Day (P2D2) is a well-established Czech PostgreSQL conference. This year’s 17th edition was exceptional, with 275 registered visitors and 16 talks across two tracks. Notably, several major PostgreSQL contributors and core members were present, underlining the event’s significance. Tomas Vondra, as in previous years, organized the conference. Bruce Momjian, Vice President and Postgres Evangelist at EDB, led a half-day workshop titled “Postgres & AI: From the Trenches to the Sky.” Robert Haas delivered a really interesting talk on Incremental Backup in PostgreSQL 17, a feature he developed.
I had the fantastic opportunity to contribute to this conference with my new talk, “Building a Data Lakehouse with PostgreSQL: Dive into Formats, Tools, Techniques, and Strategies.” Given the still evolving nature of this topic and the varying definitions of data lakehouses, I covered the most important areas, highlighting the functionalities and extensions PostgreSQL offers. I received very positive feedback on my talk and had several insightful discussions about the topic with different people.
Among the talks I attended, I particularly enjoyed Robert Haas’s presentation on Incremental Backups, the practical demonstration of PostgreSQL statistics in the talk “Statistics: How PostgreSQL Counts Without Counting” by Sadeq Dousti, and the very interesting presentation “Anatomy of Table-Level Locks in PostgreSQL” by Gülçin Yıldırım Jelínek. She explained in detail the hierarchy of different locking levels and the events leading to delays in operations due to locks. Other notable talks included “Replicating Schema Changes with PostgreSQL” by Esther Miñano and “When Autovacuum Met FinOps: A Cloud Romance” by Mayuresh Bagayatkar. You can find summaries of all talks and soon also the slides on the P2D2 website. I want to express my gratitude to all the organizers of this amazing event, especially Tomas Vondra and Gülçin Yıldırım Jelínek, who both do a great job in organizing PostgreSQL events not only in the Czech Republic.
Version 17 of PostgreSQL has been released for a while. One of the many features is a change by Tom Lane called “Rearrange pg_dump’s handling of large objects for better efficiency”. In the past, we have seen our customers have several problems with a large number of large objects being a performance issue for dump/restore. The main reason for this is that large objects are quite unlike to TOAST (The Oversized Attribute Storage Technique): while TOASTed data is completely transparent to the user, large objects are stored out-of-line in a pg_largeboject table with a link to the particular row in that table being an OID in the table itself.
Introduction To Large
Objects
Here is an example on how large objects can be used:
postgres=# CREATE TABLE test(id BIGINT, blob OID);
CREATE TABLE
postgres=# INSERT INTO test VALUES (1, lo_import('/etc/issue.net'));
INSERT 0 1
postgres=# SELECT * FROM test;
 id | blob
----+-------
  1 | 33280
(1 row)

postgres=# SELECT * FROM pg_largeobject;
 loid  | pageno |                    data
-------+--------+--------------------------------------------
 33280 |      0 | \x44656269616e20474e552f4c696e75782031320a
(1 row)

postgres=# SELECT lo_export(test.blob, '/tmp/foo') FROM test;
 lo_export
-----------
         1
(1 row)

postgres=# SELECT pg_read_file('/tmp/foo');
    pg_read_file
---------------------
 Debian GNU/Linux 12+

(1 row)

postgres=# INSERT INTO test VALUES (1, lo_import('/etc/issue.net'));
INSERT 0 1
Now if we dump the database in custom format with both version 16 and 17 of pg_dump and then use pg_restore -l to display the table of contents (TOC), we see a difference:
$ for version in 16 17; do /usr/lib/postgresql/$version/bin/pg_dump -Fc -f lo_test_$version.dmp; \
> pg_restore -l lo_test_$version.dmp | grep -v ^\; > lo_test_$version.toc; done
$ diff -u lo_test_{16,17}.toc
--- lo_test_16.toc  2024-12-11 09:05:46.550667808 +0100
+++ lo_test_17.toc  2024-12-11 09:05:46.594670235 +0100
@@ -1,5 +1,4 @@
 215; 1259 33277 TABLE public test postgres
-3348; 2613 33280 BLOB - 33280 postgres
-3349; 2613 33281 BLOB - 33281 postgres
+3348; 2613 33280 BLOB METADATA - 33280..33281 postgres
 3347; 0 33277 TABLE DATA public test postgres
-3350; 0 0 BLOBS - BLOBS
+3349; 0 0 BLOBS - 33280..33281 postgres
The dump with version 17 combines the large object metadata into BLOB METADATA, creating only one entry in the TOC for them.
Further, if we use the directory dump format, we see that pg_dump creates a file for each large object:
$ pg_dump -Fd -f lo_test.dir
$ ls lo_test.dir/
3347.dat.gz  blob_33280.dat.gz  blob_33281.dat.gz  blobs.toc  toc.dat
If there are only a few large objects, this is not a problem. But if the large object mechanism is used to create hundreds of thousands or millions of large objects, this will become a serious problem for pg_dump/pg_restore.
Finally, in order to fully remove the large objects, it does not suffice to drop the table, the large object needs to be unlinked as well:
postgres=# DROP TABLE test;
DROP TABLE
postgres=# SELECT COUNT(*) FROM pg_largeobject;
 count
-------
     2
(1 row)

postgres=# SELECT lo_unlink(loid) FROM pg_largeobject;
 lo_unlink
-----------
         1
         1
(2 rows)

postgres=# SELECT COUNT(*) FROM pg_largeobject;
 count
-------
     0
(1 row)
Benchmark
We generate one million large objects in a PostgreSQL 16 instance:
lotest=# SELECT lo_create(id) FROM generate_series(1,1000000) AS id;
 lo_create
-----------
         1
         2
[...]
    999999
   1000000
(1000000 rows)

lotest=# SELECT COUNT(*) FROM pg_largeobject_metadata;
  count
---------
 1000000
(1 row)
(1 row)
We now dump the database with pg_dump from both version 16 and 17, first as a custom and then as a directory dump, using the time utility to track runtime and memory usage:
$ for version in 16 17; do echo -n "$version: "; \
> /usr/bin/time -f '%E %Mk mem' /usr/lib/postgresql/$version/bin/pg_dump \
> -Fc -f lo_test_$version.dmp lotest; done
16: 0:36.73 755692k mem
17: 0:34.69 217776k mem
$ for version in 16 17; do echo -n "$version: "; \
> /usr/bin/time -f '%E %Mk mem' /usr/lib/postgresql/$version/bin/pg_dump \
> -Fd -f lo_test_$version.dir lotest; done
16: 8:23.48 755624k mem
17: 7:51.04 217980k mem
Dumping using the directory format takes much longer than with the custom format, while the amount of memory is very similar for both. The runtime is slightly lower for version 17 compared to version 16, but the big difference is in the used memory, which is 3,5x smaller.
Also, when looking at the file size for the custom dump or the file size of the table-of-contents (TOC) file, the difference becomes very clear:
$ ls -lh lo_test_1?.dmp | awk '{print $5 " " $9}'
211M lo_test_16.dmp
29M lo_test_17.dmp
$ ls -lh lo_test_1?.dir/toc.dat | awk '{print $5 " " $9}'
185M lo_test_16.dir/toc.dat
6,9M lo_test_17.dir/toc.dat
The custom dump is roughly 7x smaller while the TOC file of the directory dump is around 25x smaller. We also tested for different numbers of large objects (from 50k to 1.5 million) and found only a slight variance in those ratios: the used memory ratio increases from around 2x at 50k to 4x at 1.5 million while the TOC ratio goes down from around 30x at 50k to 25x at 1.5 million.
Conclusion
The changes regarding dumps of large objects in Postgres 17 are very welcome for users with a huge number of large objects. Memory requirements are much lower on PostgreSQL 17 compared to earlier versions, both for dumps in custom and directory format.
Unfortunately, neither the number of files in the directory nor the directory size changes much, each large object is still dumped as its own file, which can lead to problems if there are a lot files:
$ for version in 16 17; do echo -n "$version: "; find lo_test_$version.dir/ | wc -l; done
16: 1000003
17: 1001002
$ du -s -h lo_test_??.dir
4,1G    lo_test_16.dir
3,9G    lo_test_17.dir
This might be an area for future improvements in Postgres 18 and beyond.


