

Overview
Why Invest in BATT ETF?
- Growing Global Opportunity: The global lithium ion battery market is estimated at $194.7 billion in 2025 and projected to reach $426.4 billion by 2033 driven by EV adoption, renewable energy storage, and electrification trends.1
- Diversified Battery Value Chain Exposure: Access exposure across battery storage solutions, battery metals and materials, and electric vehicles, offering diversification beyond a single commodity or segment.2
- Demand Drivers Beyond Electric Vehicles: Battery energy storage systems (BESS) grew 44% in 2025 and now represent nearly one quarter of total battery demand, supporting growth across grid scale storage and energy infrastructure.2
Objective & Strategy
BATT is a portfolio of companies generating significant revenue from the development, production and use of lithium battery technology, including: 1) battery storage solutions, 2) battery metals & materials, and 3) electric vehicles. BATT seeks investment results that correspond generally to the EQM Lithium & Battery Technology Index.
Key Information
Fund Details
| Ticker | BATT |
| Launch Date | 06/06/2018 |
| Primary Exchange | NYSE Arca |
| CUSIP | 032108805 |
| Net Assets | $113,021,079 |
| Shares Outstanding | 8,050,000 |
| Holdings (view all holdings) | 52 |
| Total Expense Ratio i | 0.59% |
Index Details
| Index Name | EQM Lithium & Battery Technology Index |
| Index Ticker | BATTIDX |
| Index Provider | EQM Indexes |
| Weighting Methodology | Modified market-cap |
| Rebalance Frequency | Quarterly |
| Index Website | eqmindexes.com |
Selection Methodology
The Index seeks to provide exposure to global companies associated with the development, production and use of lithium battery technology, including:
Companies deriving more than 50% of their revenue from the development and production of lithium battery technologies and/or battery storage solutions
Companies in the battery metals & materials supply chain that demonstrate beneficial interest in lithium battery technology
Companies deriving 90% of their revenue from the development and production of electric vehicles
Performance & Holdings
Performance
| Cumulative (%) | Annualized (%) | |||||||||
|---|---|---|---|---|---|---|---|---|---|---|
| 1MO | 3MO | 6MO | YTD | Since Inception | 1YR | 3YR | 5YR | 10YR | Since Inception | |
| NAV | -10.68% | 5.19% | 11.76% | 11.76% | -7.10% | 67.40% | 8.48% | -0.15% | — | -0.91% |
| Closing Price | -11.16% | 3.22% | 11.38% | 11.38% | -7.37% | 67.61% | 8.37% | -0.23% | — | -0.94% |
| EQM Lithium & Battery Technology Index | -10.64% | 5.73% | 12.37% | 12.37% | 0.00% | 69.05% | 8.47% | -0.19% | — | — |
| Cumulative (%) | Annualized (%) | |||||||||
|---|---|---|---|---|---|---|---|---|---|---|
| 1MO | 3MO | 6MO | YTD | Since Inception | 1YR | 3YR | 5YR | 10YR | Since Inception | |
| NAV | -10.68% | 5.19% | 11.76% | 11.76% | -7.10% | 67.40% | 8.48% | -0.15% | — | -0.91% |
| Closing Price | -11.16% | 3.22% | 11.38% | 11.38% | -7.37% | 67.61% | 8.37% | -0.23% | — | -0.94% |
| EQM Lithium & Battery Technology Index | -10.64% | 5.73% | 12.37% | 12.37% | 0.00% | 69.05% | 8.47% | -0.19% | — | — |
The performance data quoted represents past performance and does not guarantee future results. Investment return and principal value of an investment will fluctuate so that an investor’s shares, when sold or redeemed, may be worth more or less than the original cost. Current performance may be lower or higher than the performance quoted. Brokerage commissions will reduce returns. NAV is the sum of all its assets less any liabilities, divided by the number of shares outstanding. The closing price is the last price at which the fund traded.
Extraordinary performance is attributable in part to unusually favorable market conditions and may not be repeated or consistently achieved in the future.
Top 10 Holdings
| Name | Ticker | Market Value (%) | CUSIP | Shares | Market Value ($) |
|---|---|---|---|---|---|
| BHP Group Ltd | BHP AU | 7.81% | 6144690 | 219,710 | $8,831,128 |
| Tesla Inc | TSLA | 7.47% | 88160R101 | 22,166 | $8,441,699 |
| Contemporary Amperex Technology Co Ltd | 300750 C2 | 6.81% | BHQPSY7 | 144,792 | $7,691,361 |
| BYD Co Ltd | 1211 HK | 5.76% | 6536651 | 575,744 | $6,513,880 |
| Freeport-McMoRan Inc | FCX | 5.55% | 35671D857 | 107,460 | $6,273,515 |
| Bloom Energy Corp | BE | 3.92% | 093712107 | 20,613 | $4,430,970 |
| TDK Corp | 6762 JP | 3.05% | 6869302 | 188,591 | $3,446,981 |
| Grupo Mexico SAB de CV | GMEXICOB MM | 3.04% | 2643674 | 301,010 | $3,437,193 |
| Teck Resources Ltd | TECK | 2.44% | 878742204 | 50,021 | $2,753,656 |
| First Quantum Minerals Ltd | FM CN | 2.22% | 2347608 | 95,547 | $2,508,957 |
Fund holdings are subject to change at any time and should not be considered recommendations to buy or sell any security.
Allocation
| Market Allocation | Weight (%) |
|---|---|
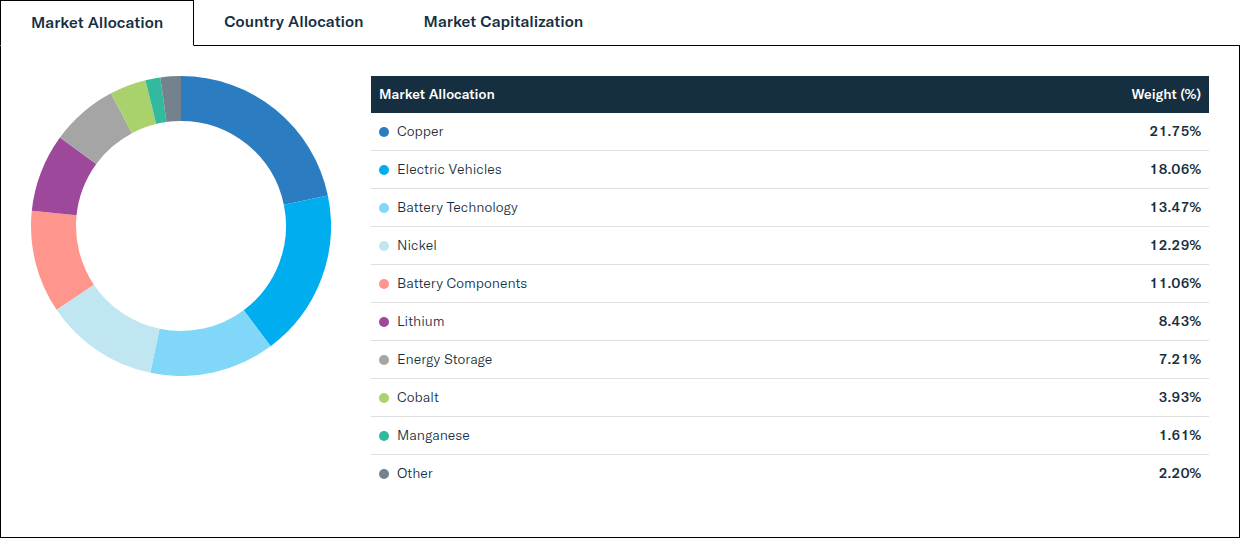
| Copper | 21.75% |
| Electric Vehicles | 18.06% |
| Battery Technology | 13.47% |
| Nickel | 12.29% |
| Battery Components | 11.06% |
| Lithium | 8.43% |
| Energy Storage | 7.21% |
| Cobalt | 3.93% |
| Manganese | 1.61% |
| Other | 2.20% |
| Market Capitalization | Weight (%) |
|---|---|
| Large Capitalization (> $10B) | 75.88% |
| Mid Capitalization ($2B - $10B) | 21.34% |
| Small Capitalization ($300M - < $2B) | 2.78% |
| Country Allocation | Weight (%) |
|---|---|
| China | 31.84% |
| United States | 23.66% |
| Australia | 15.02% |
| Canada | 10.17% |
| Japan | 7.10% |
| Korea | 4.14% |
| Chile | 3.15% |
| Mexico | 2.84% |
| Belgium | 1.27% |
| Viet Nam | 0.80% |
Distributions
| Ex-Date | Record Date | Payable Date | Amount (USD) |
|---|---|---|---|
| 12/30/2026 | 12/30/2026 | 12/31/2026 | — |
There is no guarantee that distributions will be made.
Price
NAV/Market Price
| Previous Day's NAV | |
|---|---|
| Net Asset Value: | $14.04 |
| Daily Change: | $-0.30 |
| % Daily Change: | -2.10% |
| 30-Day Median Bid/Ask Spread: | 0.30% |
| Previous Day's Market Price | |
|---|---|
| Closing Price: | $14.02 |
| Daily Change: | $-0.19 |
| % Daily Change: | -1.30% |
| % Premium/Discount: | -0.18% |
Daily Price/NAV Performance

Premium/Discount
| 2025 | Q1 2026 | Q2 2026 | Q3 2026 | Q4 2026 | |
|---|---|---|---|---|---|
| Days Traded at Premium | 104 | 40 | 41 | - | - |
| Days Traded at NAV | 0 | 0 | 0 | - | - |
| Days Traded at Discount | 147 | 21 | 21 | - | - |
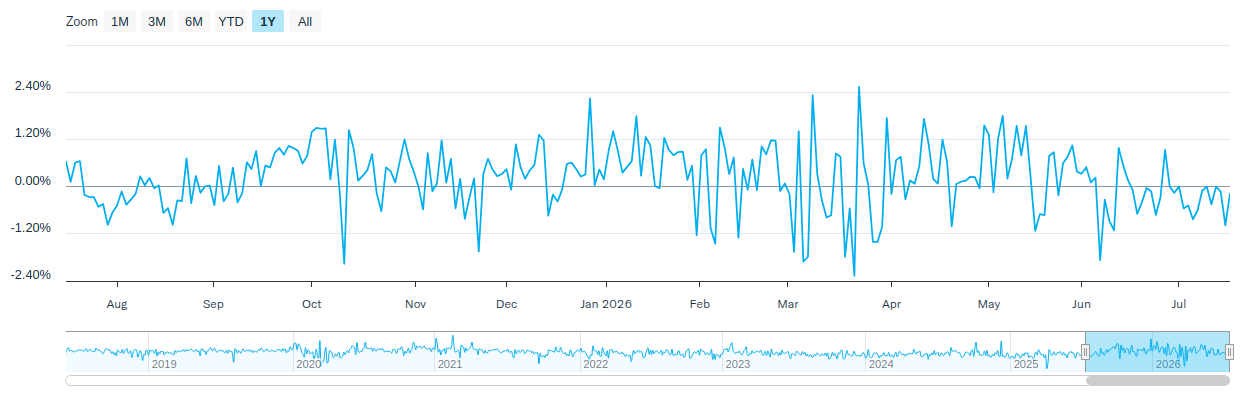
The table and line graph are provided to show the frequency at which the closing price of the Fund was at a premium (above) or discount (below) to the Fund’s daily net asset value (“NAV”). The table and line graph represent past performance and cannot be used to predict future results. Shareholders may pay more than NAV when buying Fund shares and receive less than an NAV when those shares are sold because shares are bought and sold at current market prices.
Literature
Fund Resources
Insights
International Insights: Investing Across the Globe - May 2026
June 8, 2026
Audio Commentary by Tim Seymour, IDVO Portfolio Manager
Climate Capital: The Case for ESG Investing
May 22, 2026
In an era where climate change debates heat the political sphere, many savvy business owners and investors are turning their focus toward a cooler, more sustainable future.
The Digital Economy Is Built on Real Assets
May 20, 2026
Artificial intelligence and the digital economy are driving unprecedented demand for electricity and critical materials—creating a new energy supercycle.
How to Invest
Amplify ETFs trade throughout the day, similar to publicly-traded stocks, on an exchange. There are multiple ways to invest in Amplify ETFs:
- Contact a Financial Advisor to discover how Amplify ETFs may fit within your portfolio.
- Amplify ETFs are available through various online platforms and brokerage accounts.
Connect with your ETF Specialist or call (855) 267-3837
1 https://www.marketsandmarkets.com/Market-Reports/lithium-ion-battery-market-49714593.html
2 https://blog.amplifyetfs.com/batt/amplify-lithium-battery-technology-etf-batt-4th-quarter-commentary-2025
Investing involves risk, including the possible loss of principal. Shares of any ETF are bought and sold at market price (not NAV), may trade at a discount or premium to NAV and are not individually redeemed from the Fund. The Fund is not actively managed. The Fund invests in securities included in its Index regardless of their investment merit. Narrowly focused investments typically exhibit higher volatility. A portfolio concentrated in a single industry, such as lithium battery technology, makes it vulnerable to factors affecting the companies.
The Fund may face more risks than if it were diversified broadly over numerous industries or sectors. The Fund has become more susceptible to potential operational risks through breaches in cybersecurity. The Fund invests in securities that are issued by and/or have exposure to, companies primarily involved in the metals and mining industry. Investments in metals and mining companies may be speculative and subject to greater price volatility than investments in other types of companies. The exploration and development of metals involves significant financial risks over a significant period of time, which even a combination of careful evaluation, experience and knowledge may not eliminate. Rare earth metals have more specialized uses and are often more difficult to extract. The increased demand for these metals has strained supply, which could adversely affect the companies in the Fund’s portfolio. Some of the companies in which the Fund will invest are engaged in other lines of business unrelated to the mining, refining and/or manufacturing of metals and these lines of business could adversely affect their operating results.
The Fund’s assets are concentrated in the materials sector, which means the Fund will be more affected by the performance of the materials sector than a fund that is more diversified. The Fund currently has fewer assets than larger funds, and like other relatively new funds, large inflows and outflows may impact the Fund’s market exposure for limited periods of time. The Fund will invest in the securities of non-U.S. companies. Investments in emerging market issuers are subject to a greater risk of loss than investments in issuers located or operating in more developed markets. The mining, refining and/or manufacturing of metals may be significantly affected by regulatory action and changes in governments. Small and/or mid-capitalization companies may be more vulnerable to adverse general market or economic developments. Electric vehicle technology is relatively new and is subject to risks associated with a developing industry.
The EQM Lithium & Battery Technology Index (BATTIDX) seeks to provide exposure to global companies associated the development and production of lithium battery technology and/or battery storage solutions; the exploration, production, development, processing, and/or recycling of the materials and metals used in lithium battery chemistries such as Lithium, Cobalt, Nickel, Manganese, Vanadium and/or Graphite; and/or the development and production of electric vehicles.
Amplify Investments LLC is the Investment Adviser to the Fund, and Toroso Investments, LLC serves as the Investment Sub-Adviser.
Amplify ETFs are distributed by Foreside Fund Services, LLC.
