



Medium article about this project
Highly customizable org chart built with d3 v7.


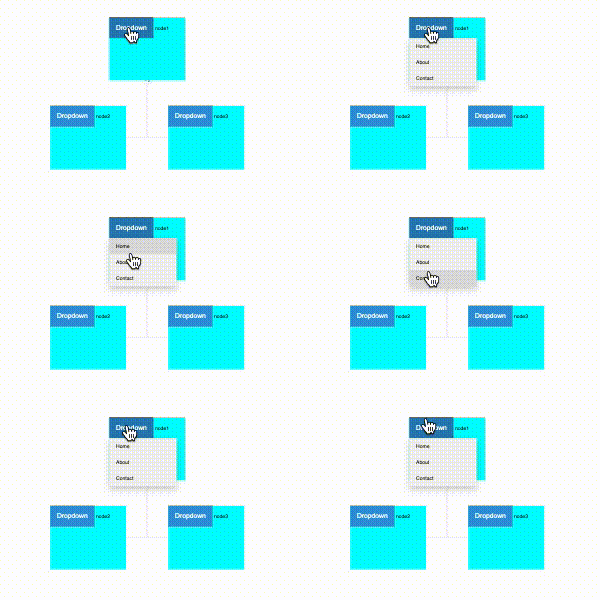
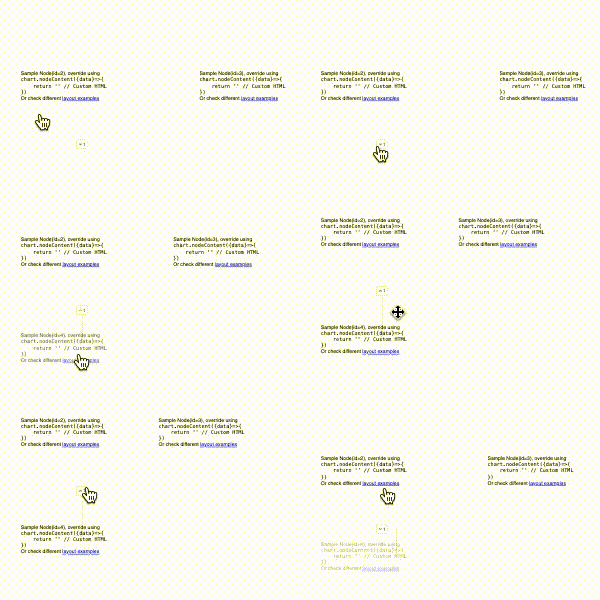
Drag & Drop Nodes 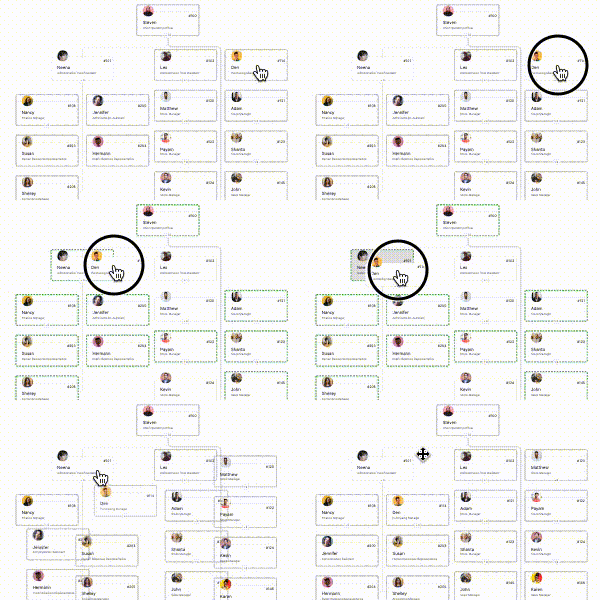
|
Just copy this code and paste at - https://realtimehtml.com/
<script src="https://d3js.org/d3.v7.min.js"></script>
<script src="https://cdn.jsdelivr.net/npm/d3-org-chart@3"></script>
<script src="https://cdn.jsdelivr.net/npm/d3-flextree@2.1.2/build/d3-flextree.js"></script>
<div class="chart-container"></div>

<script>
 var chart;
 d3
  .csv(
   "https://raw.githubusercontent.com/bumbeishvili/sample-data/main/org.csv"
  )
  .then((data) => {
   chart = new d3.OrgChart().container(".chart-container").data(data).render();
  });
</script>npm i d3-org-chart
import { OrgChart } from 'd3-org-chart';

 new OrgChart()
     .container(<DomElementOrCssSelector>)
     .data(<Data>) // https://github.com/bumbeishvili/sample-data/blob/main/data-oracle.csv
     .render();
In general, we encourage to look into the source code to understand how it works. The chart code is basically a single class. At the top of the class, we have a state object called attrs which stores the state of the org chart and each single property is overridable by the user.
For example, one of the property name inside attrs object is duration, which controls animation duration for chart, when expanding or collapsing nodes.
If we want to get the value, we can either do
chart.getChartState().durationor directly
chart.duration()chart in the above case is an instance of OrgChart class. We can get it using new OrgChart()
If we want to set property, we can pass argument to the same function and it will automatically set the value
chart.duration(3000) // This will become very slow moving chartYou can see list of all properties , their description of what each property does in the actual source code.
Line 41 in 5be7e09
Be aware that they are chainable, so if we wanted to set multiple properties, we would do this
const chart = new OrgChart()
                    .data(ourData)
                    .container(ourDomElementOrCssSelector)
                    .duration(ourDuration)
                    .render()


// We can keep chaining values in runtime
chart.data(updatedData).render()
Have you impressively customized an organizational chart and want to be featured on this page? Just email me at me@davidb.dev and include screenshot of your org chart and it will be featured on this page (dimensions of image should be 500 X 500).
 Default |
 Sky |
 Circles |
 Oval |
 Clean (Design by Anton) |
 Futuristic - Full Functionality |
 Prev version design |
Check out several libraries and frameworks integrations
Custom components & algorithms I used
Check the sample data here - https://github.com/bumbeishvili/sample-data/blob/main/data-oracle.csv
For the full functionality of exposed methods check Futuristic Example and button bound functions
For the high level overview of margins and content setting check the image bellow

I created this org-chart when I was hired by TeamApps.
Although this Org chart was specifically created for teamapps java web application framework , it's very flexible and can be used in any environment, where d3 and DOM is accessible.
Big thanks to Matthias and Yann, who assembled requirements for org-chart and had valuable pieces of advice afterwads.
Also, thanks all people who made generous donations, it gives me motivation to further improve this org chart component.
Thanks contractzen for the significant contribution, which made implementation of some of the most important features (optimal layout, exporting ) possible.
I am available for freelance data visualization work. Please contact me in case you'd like me to help you with my experience and expertise
You can also book data viz related consultation session with me.
You might not need a consultation, but you want to appreciate the time and effort I am putting into this library, and if you correspond with an organization, you might also want to enjoy private QA about org chart over emails. In that case, you can support the org chart via polar.sh/bumbeishvili
