Google Chrome Developer Tools is a great feature of Google Chrome for web developers. It is a set of tools directly built-in to Google Chrome to help the developers make changes to the webpage and diagnose problems with their websites on the fly. It helps web developers build and optimize websites faster.
In this article, I am going to show you how to open Google Chrome Developer Tools in Google Chrome and some of the features it offers.
Table of Contents:
- Opening Google Chrome Developer Tools
- Docking Google Chrome Developer Tools in Different Locations
- Some of the Features of Google Chrome Developer Tools
- Closing Developer Tools in Google Chrome
- Conclusion
- References
Opening Google Chrome Developer Tools
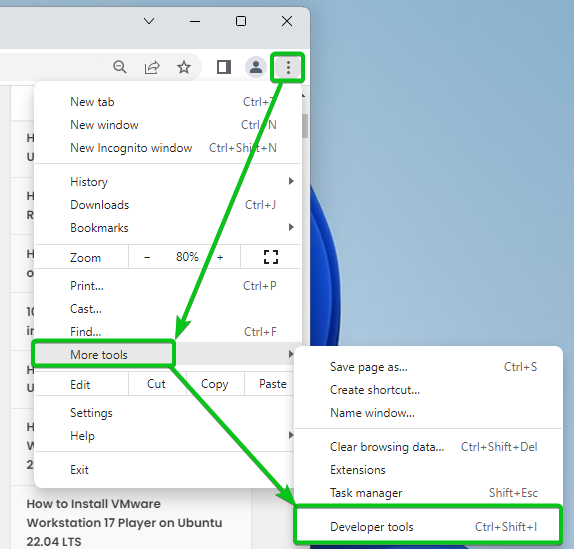
One way to open the Google Chrome developer tools is from the  of Google Chrome.
First, open Google Chrome and click on > More tools > Developer tools from the top-right corner of Google Chrome.
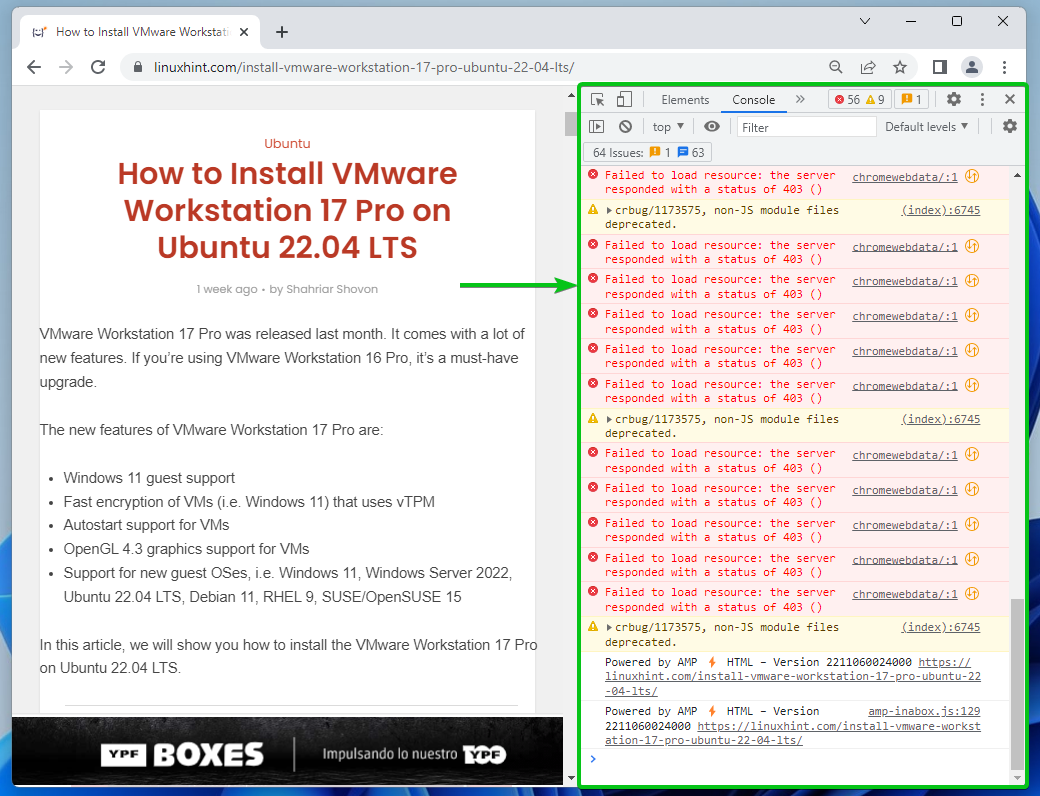
Google Chrome Developer Tools should be displayed.
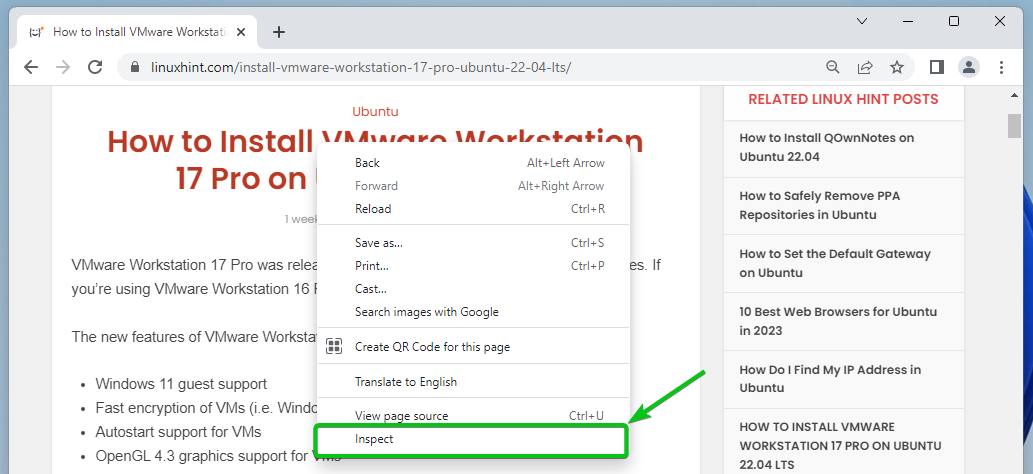
You can also visit a website from Google Chrome and inspect an element from the website to open the Developer Tools.
To inspect an element from a webpage, right-click (RMB) on it and click on Inspect.
You can also press <Ctrl> + <Shift> + C to inspect an element from a webpage and open the Google Chrome Developer Tools.
The Google Chrome Developer Tools should be opened.
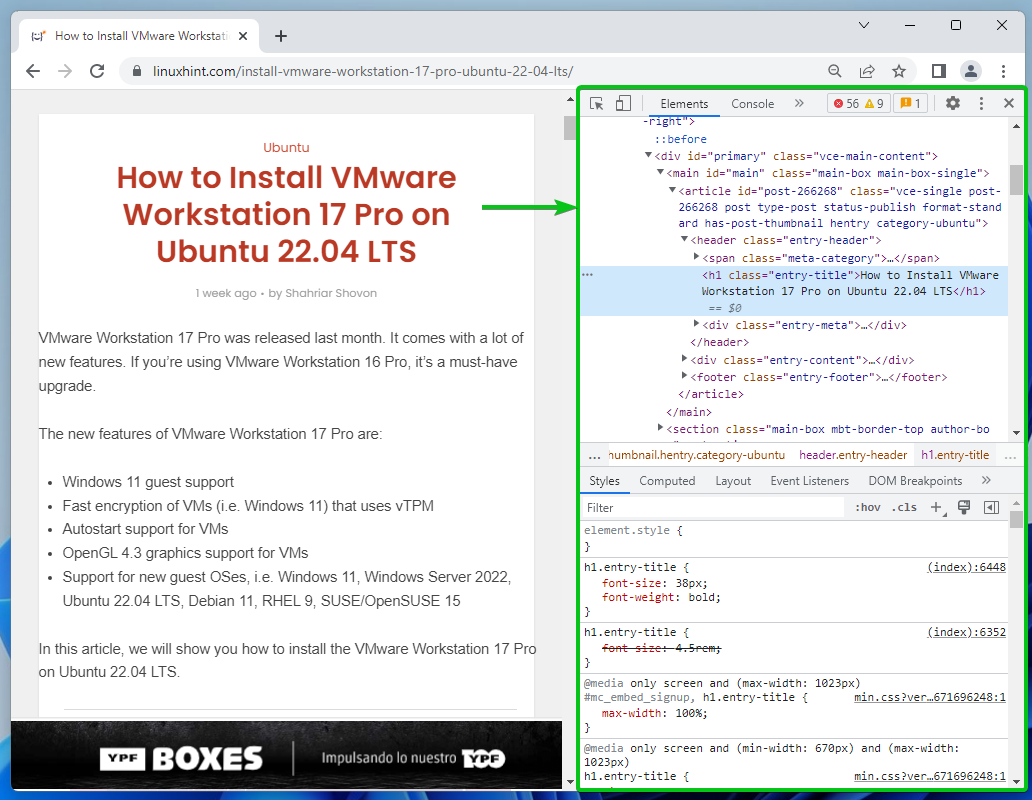
In the same way, you can open the Console of the Google Chrome Developer Tools by pressing <Ctrl> + <Shift> + J.

Docking Google Chrome Developer Tools in Different Locations
If you do not have a big enough monitor, you may not want the Google Chrome Developer Tools to be docked on the right side of Google Chrome.
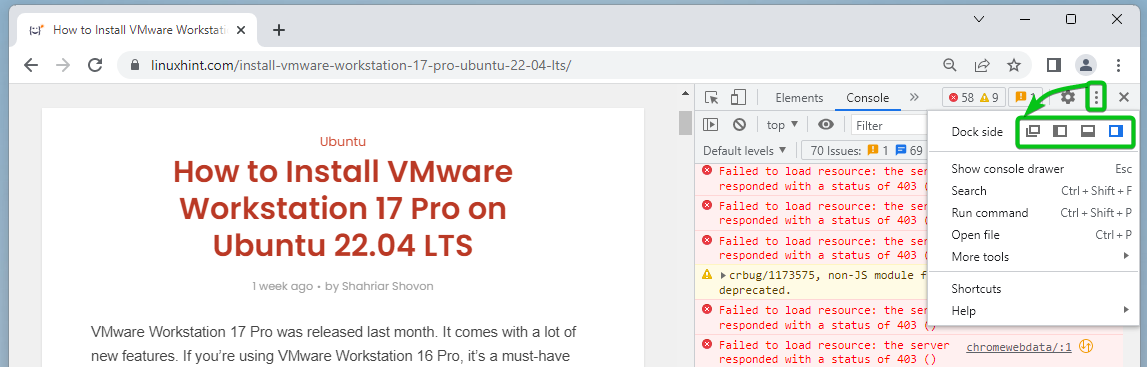
Click on and select a docking position from the Dock side section to change the docking position of Google Chrome.
 Undock Google Chrome Developer Tools into a separate window.
 Dock Google Chrome Developer Tools to the left.
 Dock Google Chrome Developer Tools to the bottom.
 Dock Google Chrome Developer Tools to the right.
Some of the Features of Google Chrome Developer Tools
Google Chrome Developer Tools has some tabs and you can do specific things from each of the tabs.
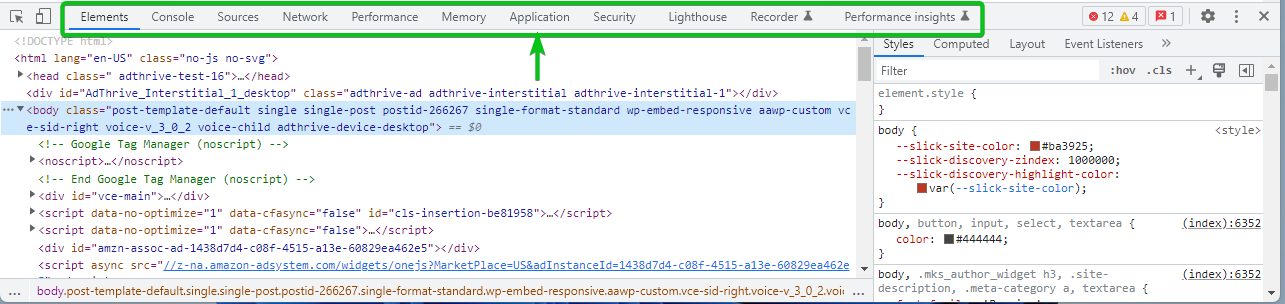
From the Elements tab, you can inspect different elements from the webpage; check the CSS Styles and computed size of the elements; make instant changes to the HTML DOM and CSS of the webpage and see the results; and many more.

From the Console tab, you can view log messages and run JavaScript codes.

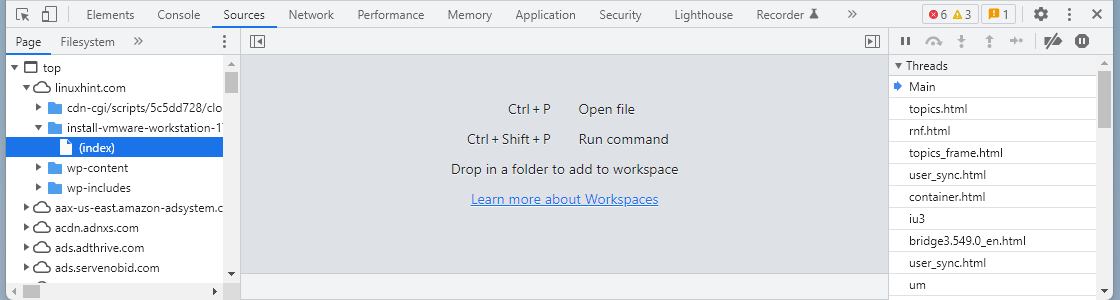
From the Sources tab, you can debug JavaScript codes, save and run JavaScript code snippets, persist changes made to the Google Chrome developer tools across page reloads, and save the changes that you have made using the Google Chrome Developer Tools to the disk.
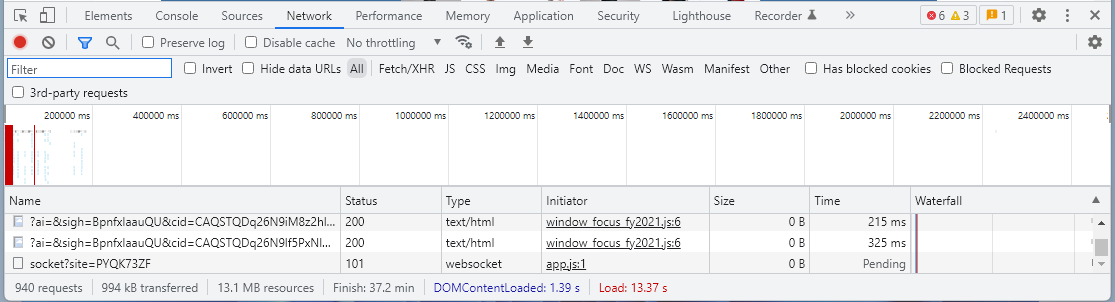
From the Network tab, you can monitor network activity, files requested by the webpage and the time it takes to load, and debug the network activity of the webpage.
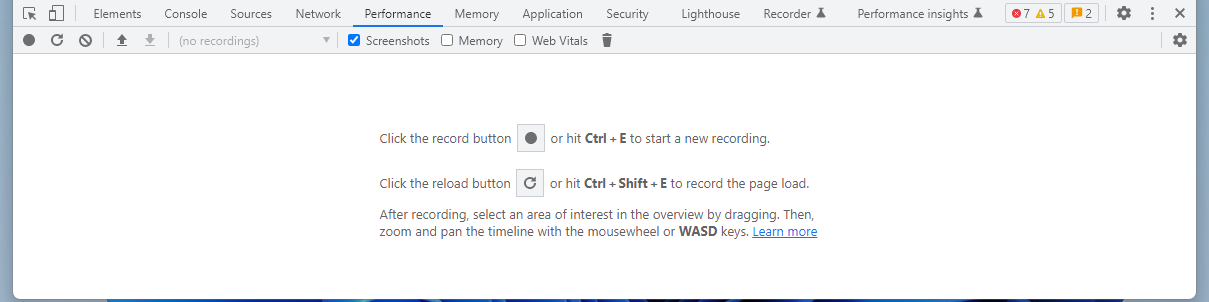
From the Performance tab, you can record the page load time and website performance. You can also find ways to improve them.
From the Memory tab, you can monitor the memory usage of your website and fix unusual memory problems.

From the Application tab, you can inspect all the loaded resources of your website such as:
- IndexedDB
- Web SQL databases
- Local storage
- Session storage
- Cookies
- Application cache
- Images
- Fonts
- Stylesheets
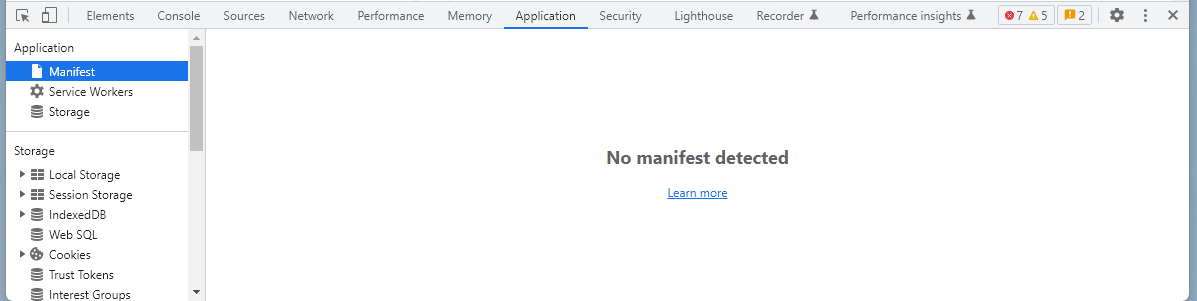
From the Security tab, you can debug certification problems, mixed content issues, and many other security problems of the website.

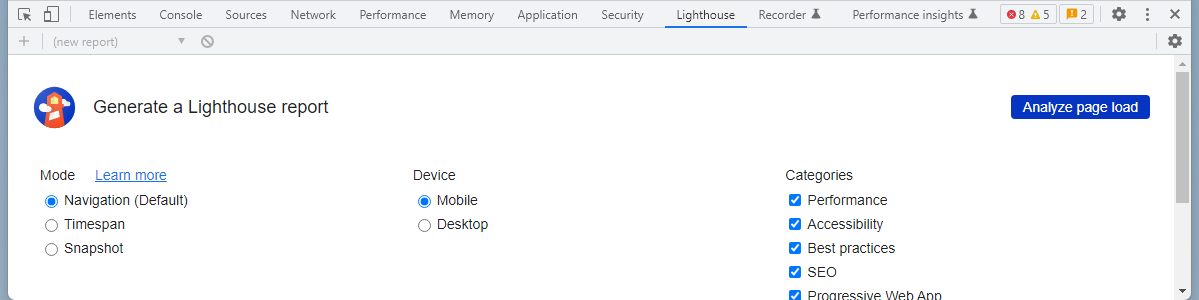
From the Lighthouse tab, you can generate a Lighthouse report.
From the Recorder tab, you can measure the performance across the entire user flow of the website.

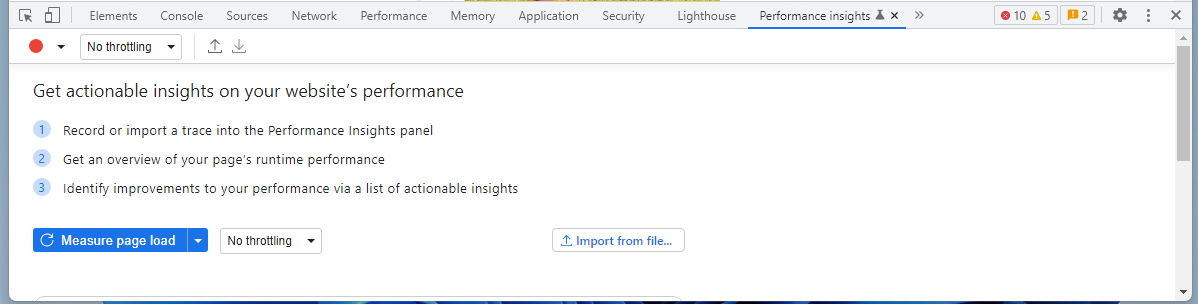
From the Performance Insight tab, you can get actionable performance insights on your website.
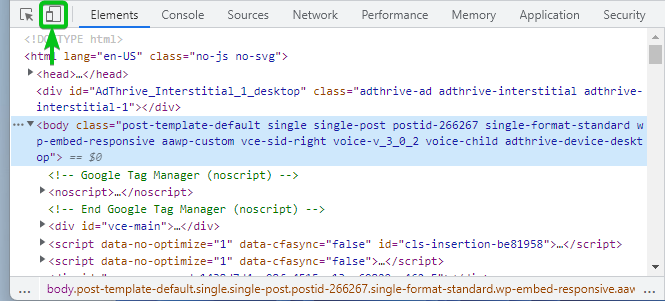
You can see how your website looks across devices of different screen sizes using the Device mode of Google Chrome Developer Tools.
To switch to Device mode, click on the toggle button.
Your website should be displayed in different screen sizes in device mode. You can change the screen size and see how the website will look on devices with that screen size.

Closing Developer Tools in Google Chrome
To close the Google Chrome Developer Tools, click on X.
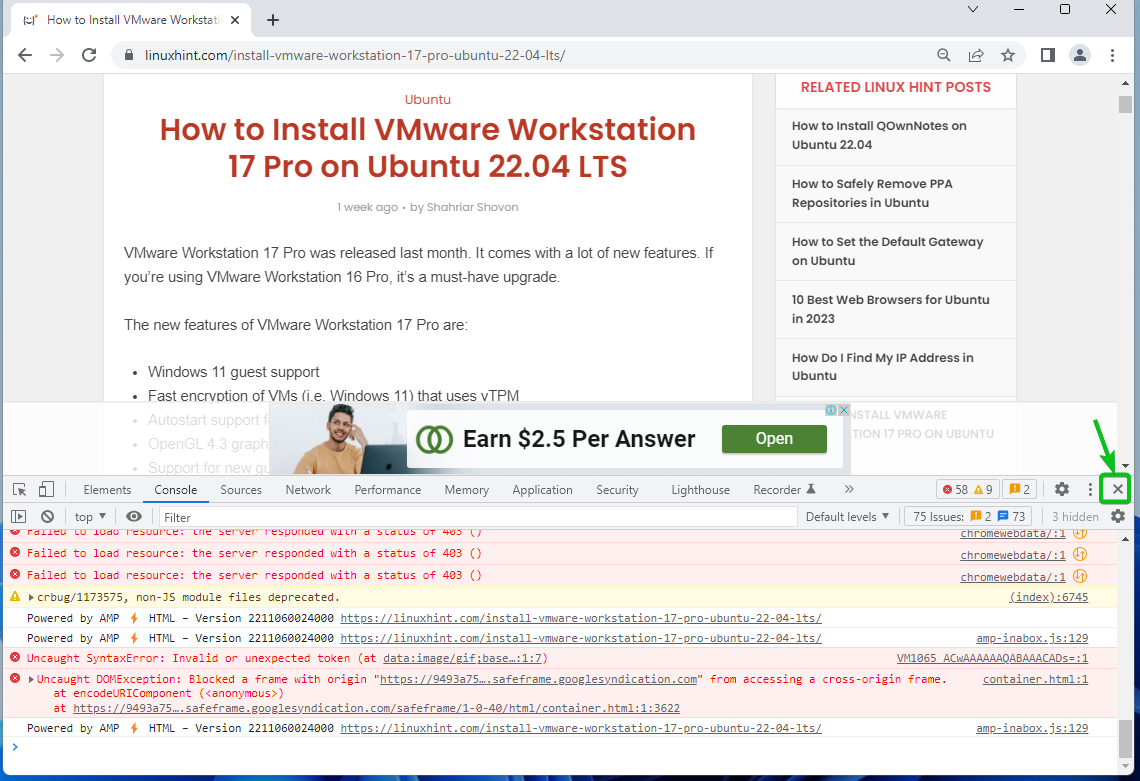
The Google Chrome Developer Tools should be closed.

Conclusion
I have shown you how to open the Google Chrome Developer Tools and discussed some of the features of the Google Chrome Developer Tools. To learn more about the Google Chrome Developer Tools and each of its features, check out the links in the References section below.
References:
- Overview – Chrome Developers
- Record, replay, and measure user flows – Chrome Developers
- Performance insights: Get actionable insights on your website’s performance – Chrome Developers

