ilert seamlessly connects with your tools using our pre-built integrations or via email. ilert integrates with monitoring, ticketing, chat, and collaboration tools.
See how industry leaders achieve 99.9% uptime with ilert
Organizations worldwide trust ilert to streamline incident management, enhance reliability, and minimize downtime. Read what our customers have to say about their experience with our platform.
For years, ilert has given our customers extensive analytics across their alerts, notifications, and on-call activity, a comprehensive overview of how their teams and services respond to incidents. These capabilities were backed by a separate analytical database running on Google BigQuery. It held the numbers behind every reporting dashboard in ilert, and for a long stretch it was perfectly fine.
Then three problems grew too big to ignore:
It was the slowest experience on our platform. Analytics dashboards aren’t on ilert’s hot path, but they were noticeably sluggish, several seconds on average, and up to twenty seconds for our largest customers. Not the experience we wanted to offer.
We paid per query. BigQuery bills by bytes scanned, and our workload is the same handful of dashboards run over and over, so we kept paying, again and again, to answer questions we’d already asked.
Updating a row was difficult. Some of our analytics aren’t append-only, for example, an alert’s state, TTA (time-to-accept) and TTR (time-to-resolve) all change as the alert is acknowledged and resolved, and we need the stored row to follow. BigQuery is built around appends and full rewrites; row-level updates there are slow and awkward.
There was a bonus reason too: BigQuery happened to be the last workload keeping us on Google Cloud, so retiring it let us drop a whole provider, and a subprocessor from our tech stack.
So we moved our analytics to ClickHouse, running on our own AWS infrastructure. Queries that used to take around ten seconds now come back in under two. Here’s how we got there.
Our workloads
Our analytical workload consists mainly of:
Events: the raw alerting events ilert ingests and handles. A high-volume, append-only stream, the source data everything else is built from.
Statistics: the aggregates behind our core capabilities: alerts, notifications, and on-call reports.
Entity state transitions: the history of how our core entities move through their lifecycle: call flows, event flows, incidents. We log what happened over time, with each transition as its own distinct row, one per entity per change.
Those three workloads shaped both the problems above and the design below. What we needed was a fast, columnar database, tuned for tenant-scoped, time-range reads, with a table engine that could also handle mutations. The shortlist also included Apache Druid, Apache Pinot, StarRocks, and TimescaleDB. But ClickHouse matched our access pattern most closely, and just as important, it wasn’t a risky bet. We had been following the project for years and watching it mature. In that time it has become a well-established choice for large enterprises like Uber, Cloudflare, and Cisco.
Why not just tune BigQuery?
It’s the fair question, and we asked it first. BigQuery has real answers for slow interactive dashboards, BI Engine, reservations, materialized views, and any of them would have helped with the speed, and probably the cost too.
But every one of them keeps us on Google Cloud. By this point BigQuery was our only remaining GCP workload; everything else already ran on our own AWS infrastructure. Tuning BigQuery would have fixed two of our three problems while permanently cementing a second cloud provider, and a second subprocessor, into the stack. Moving the workload instead let us fix the speed and the cost and collapse two providers into one. That is what decided it: migrate, rather than optimize in place.
Getting data in, Kafka in the middle
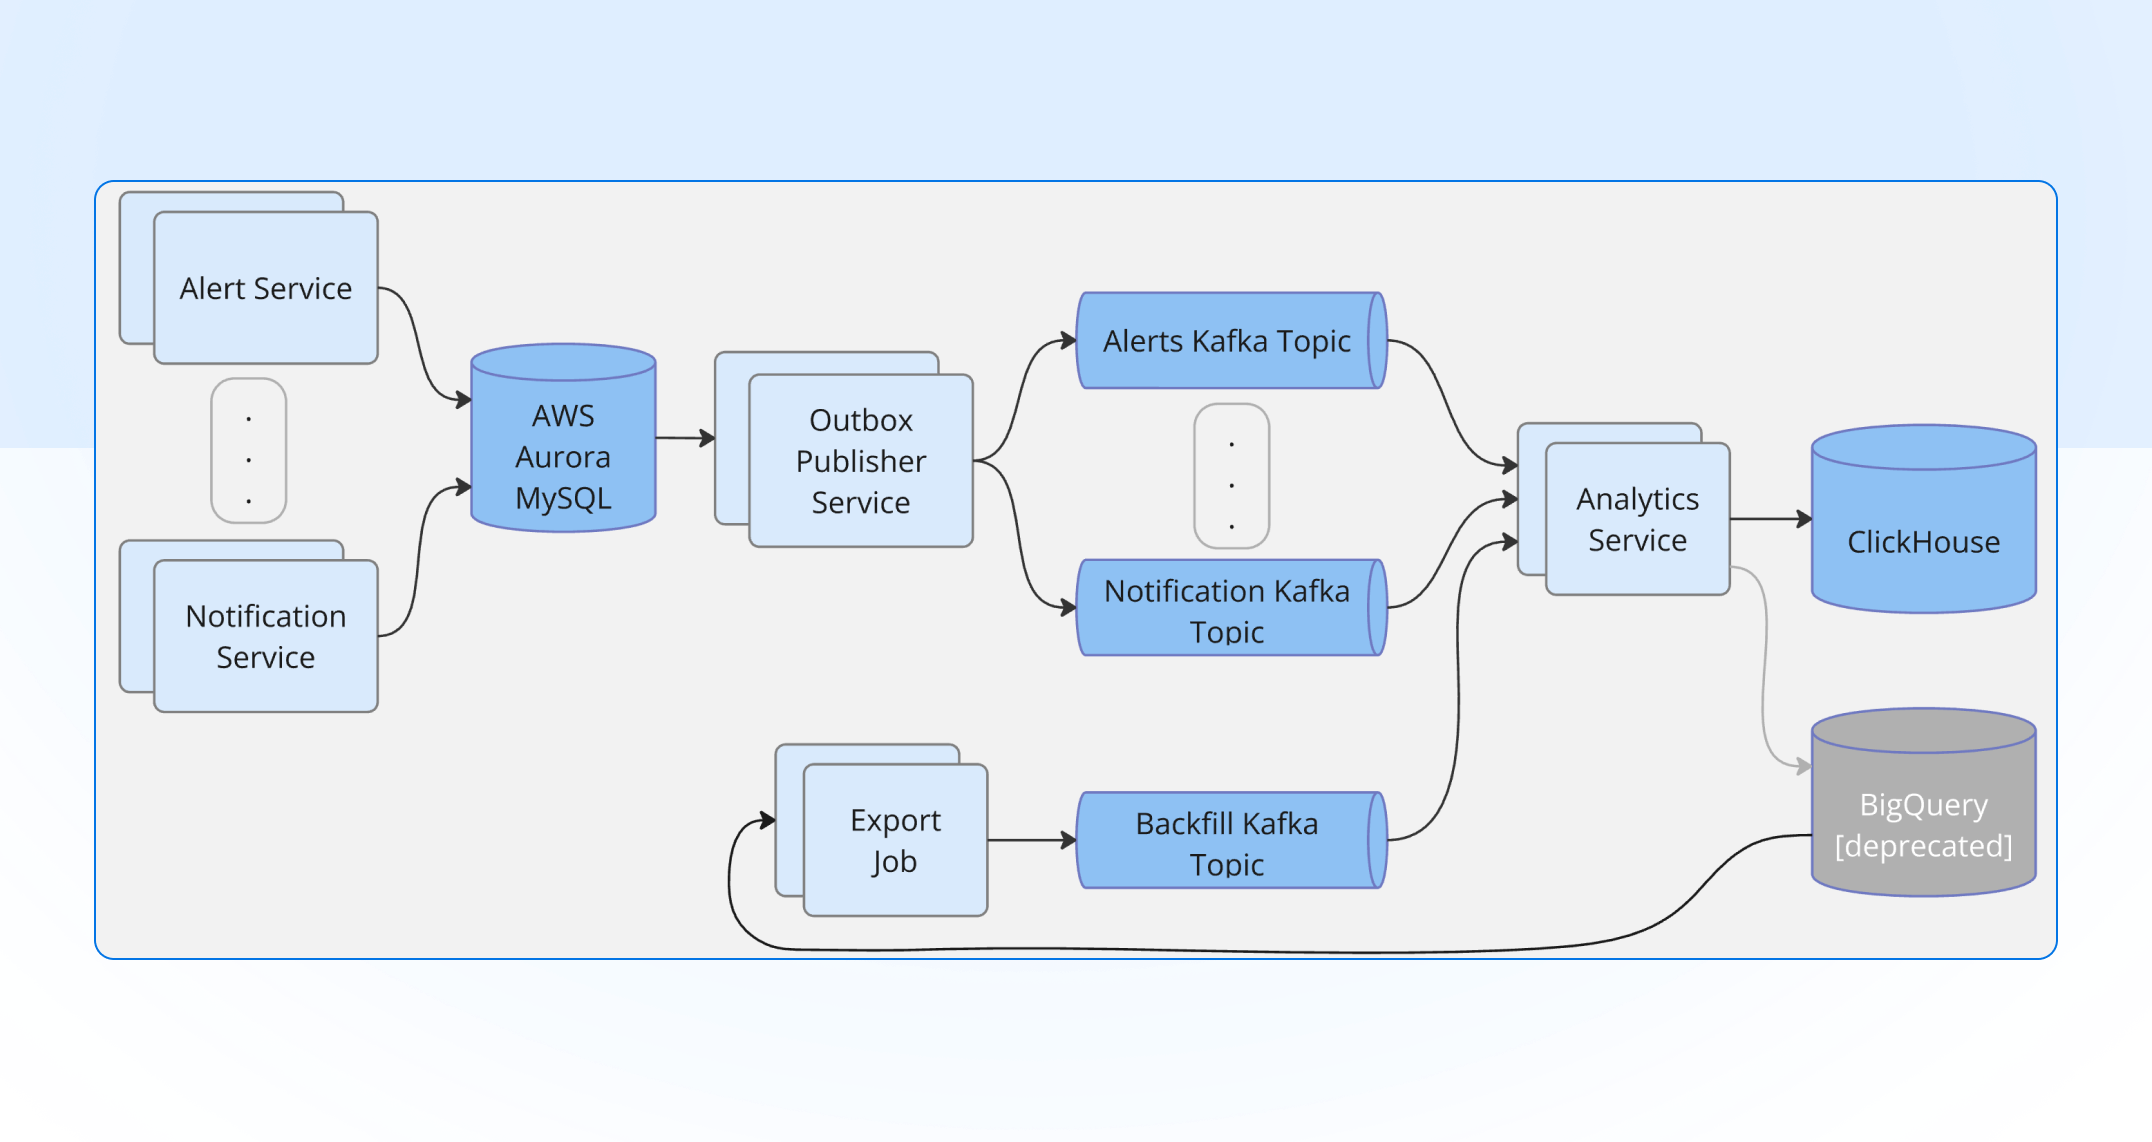
As is common in the industry, our operational and analytical data stores are decoupled and only eventually consistent, with a buffer in between. We were already using Kafka for that buffer, so it was the natural choice for feeding data into ClickHouse too.
The realtime flow:
Source services own their operational data as they always have.
A dedicated CDC (change data capture) service reads change events and exports them onto Kafka topics, one logical stream per workload.
Consumer workers read from Kafka, batch rows client-side, and insert into ClickHouse.
The backfill flow reused the same path, with a different source:
An export job reads the historical BigQuery tables, one by one, and streams the rows into a Kafka topic.
A backfill consumer batches those rows and inserts them into ClickHouse, the same way the realtime consumers do.
Those consumer workers needed to do one thing well: insert rows into ClickHouse efficiently. ClickHouse is fastest with large, infrequent inserts and slow with many small ones, so each consumer batches rows client-side, flushing on whichever comes first, a size threshold or a short timer, and commits its Kafka offset only after the batch lands. Offset and insert move together; otherwise a crash could acknowledge rows that never reached the table.
Why route through Kafka instead of dual-writing?
Decoupling. The source services don’t know or care that ClickHouse exists. If the analytical store is down for maintenance, events queue in Kafka; nothing upstream blocks.
Replayability. Getting a schema or a transform wrong is normal during a migration. With the stream retained in Kafka, we can rewind offsets and re-ingest into a corrected table instead of asking every source service to send its history again.
Backfill and cutover in parallel. We backfilled history into ClickHouse while the live stream kept flowing, then flipped reads over once the two agreed.
Natural batching boundary. ClickHouse wants large, infrequent inserts, not a trickle of single rows. A Kafka consumer is the ideal place to accumulate a batch and flush it.
Designing the ClickHouse schema
One of the main decisions each ClickHouse adopter has to make is the choice of table engine, which comes down to one question: can the data be mutated, and in what way.
Beyond the engine, our tables share a few conventions. Each one is sharded across the cluster and replicated for durability, partitioned by month, and sorted by tenant and then time, so a tenant’s date-range query touches the smallest slice of data possible. Columns are compressed with type-appropriate codecs, and every table carries a TTL that ages data out on its own retention schedule instead of letting it grow forever.
Analyzing our use cases, there is one that clearly requires mutability:
Alert analytics: as an alert moves from triggered to acknowledged to resolved, we simply insert it again with its new state; ClickHouse keeps the newest version and drops the older ones as it merges. Reads ask for the current state with FINAL, which removes those old versions at query time. This is ReplicatedReplacingMergeTree.
But keeping in mind the need to backfill, we decided to use the “replacing” engine for all other migrated tables as well.
Why this shape makes fixing migration issues safe
Migrating data is messy. You almost always get halfway through, notice a transform was subtly wrong, and have to run the whole backfill again. On a plain append-only table, re-running means every row you already inserted lands a second time, so re-ingesting the backfill turns into a truncate-and-start-over task, and it is risky every time.
The “replacing” engine changes this. Because it deduplicates by the full ORDER BY tuple and keeps the row with the highest version column, re-ingesting the same logical rows from the stream simply replaces them, while any rows missing the first time just get filled in. Re-ingesting the backfill stops being cleanup and becomes something you can safely repeat: rewind the consumer, let it run, and the table ends up in the correct state. Nothing duplicates, nothing needs truncating, and FINAL gives you the clean view even before background merges catch up.
The FINAL isn’t free, but it is acceptable for us because none of the APIs backed by these tables are on a hot path of the platform, so in practice the overhead is negligible.
The tricky part: porting the queries
Setting up the tables was the easy half. Porting the analytical queries from BigQuery’s SQL dialect to ClickHouse’s took far more attention, and the dangerous bugs weren’t the ones that raised an error. They were the ones that returned a perfectly plausible number that happened to be wrong. Even with the help of AI assistants, it took several iterations to map each one properly, leaning on our test data to make the new queries functionally identical to the old ones.
A few of the traps that bit us:
%M is the month, not the minute. In ClickHouse’s formatDateTime, %M prints the full month name and %i is the minute. We ended up using the provided shortcuts: %F = %Y-%m-%d, %T = %H:%i:%S
Non-aggregated columns. BigQuery lets you SELECT a column that isn’t in the GROUP BY, as long as it is functionally determined by it. ClickHouse refuses. Just adding the column to the GROUP BY silently splits rows and double-counts if that column ever varies within the group. The correct fix is to wrap it with aggregates like any() or min().
Indexing starts at 1. ClickHouse arrays and tuples are 1-based. BigQuery’s [OFFSET(0)] for the first element becomes [1], and tuple fields are t.1, t.2.
Averaging over “skipped” rows. In our data a TTA or TTR of 0 means the alert was never acknowledged or resolved, not that it took zero seconds. A plain AVG would count those zeros and drag the number down, so we had to use the following expression: COALESCE(ROUND(AVG(CASE WHEN x != 0 THEN x END)), 0).
The trade-offs we accepted
Self-hosting ClickHouse brings complexities of its own, and we took them on consciously:
We operate it now. Replication, ZooKeeper, server upgrades, backups, capacity planning, the things BigQuery did invisibly are our team’s job today. We took that on deliberately; it’s the cost of controlling performance and consolidating onto one provider.
We size for peak. There’s no serverless elasticity. The cluster is provisioned for our busy periods and sits under-used the rest of the time. For a workload as predictable as ours, that still comes out cheaper than paying per query.
The results
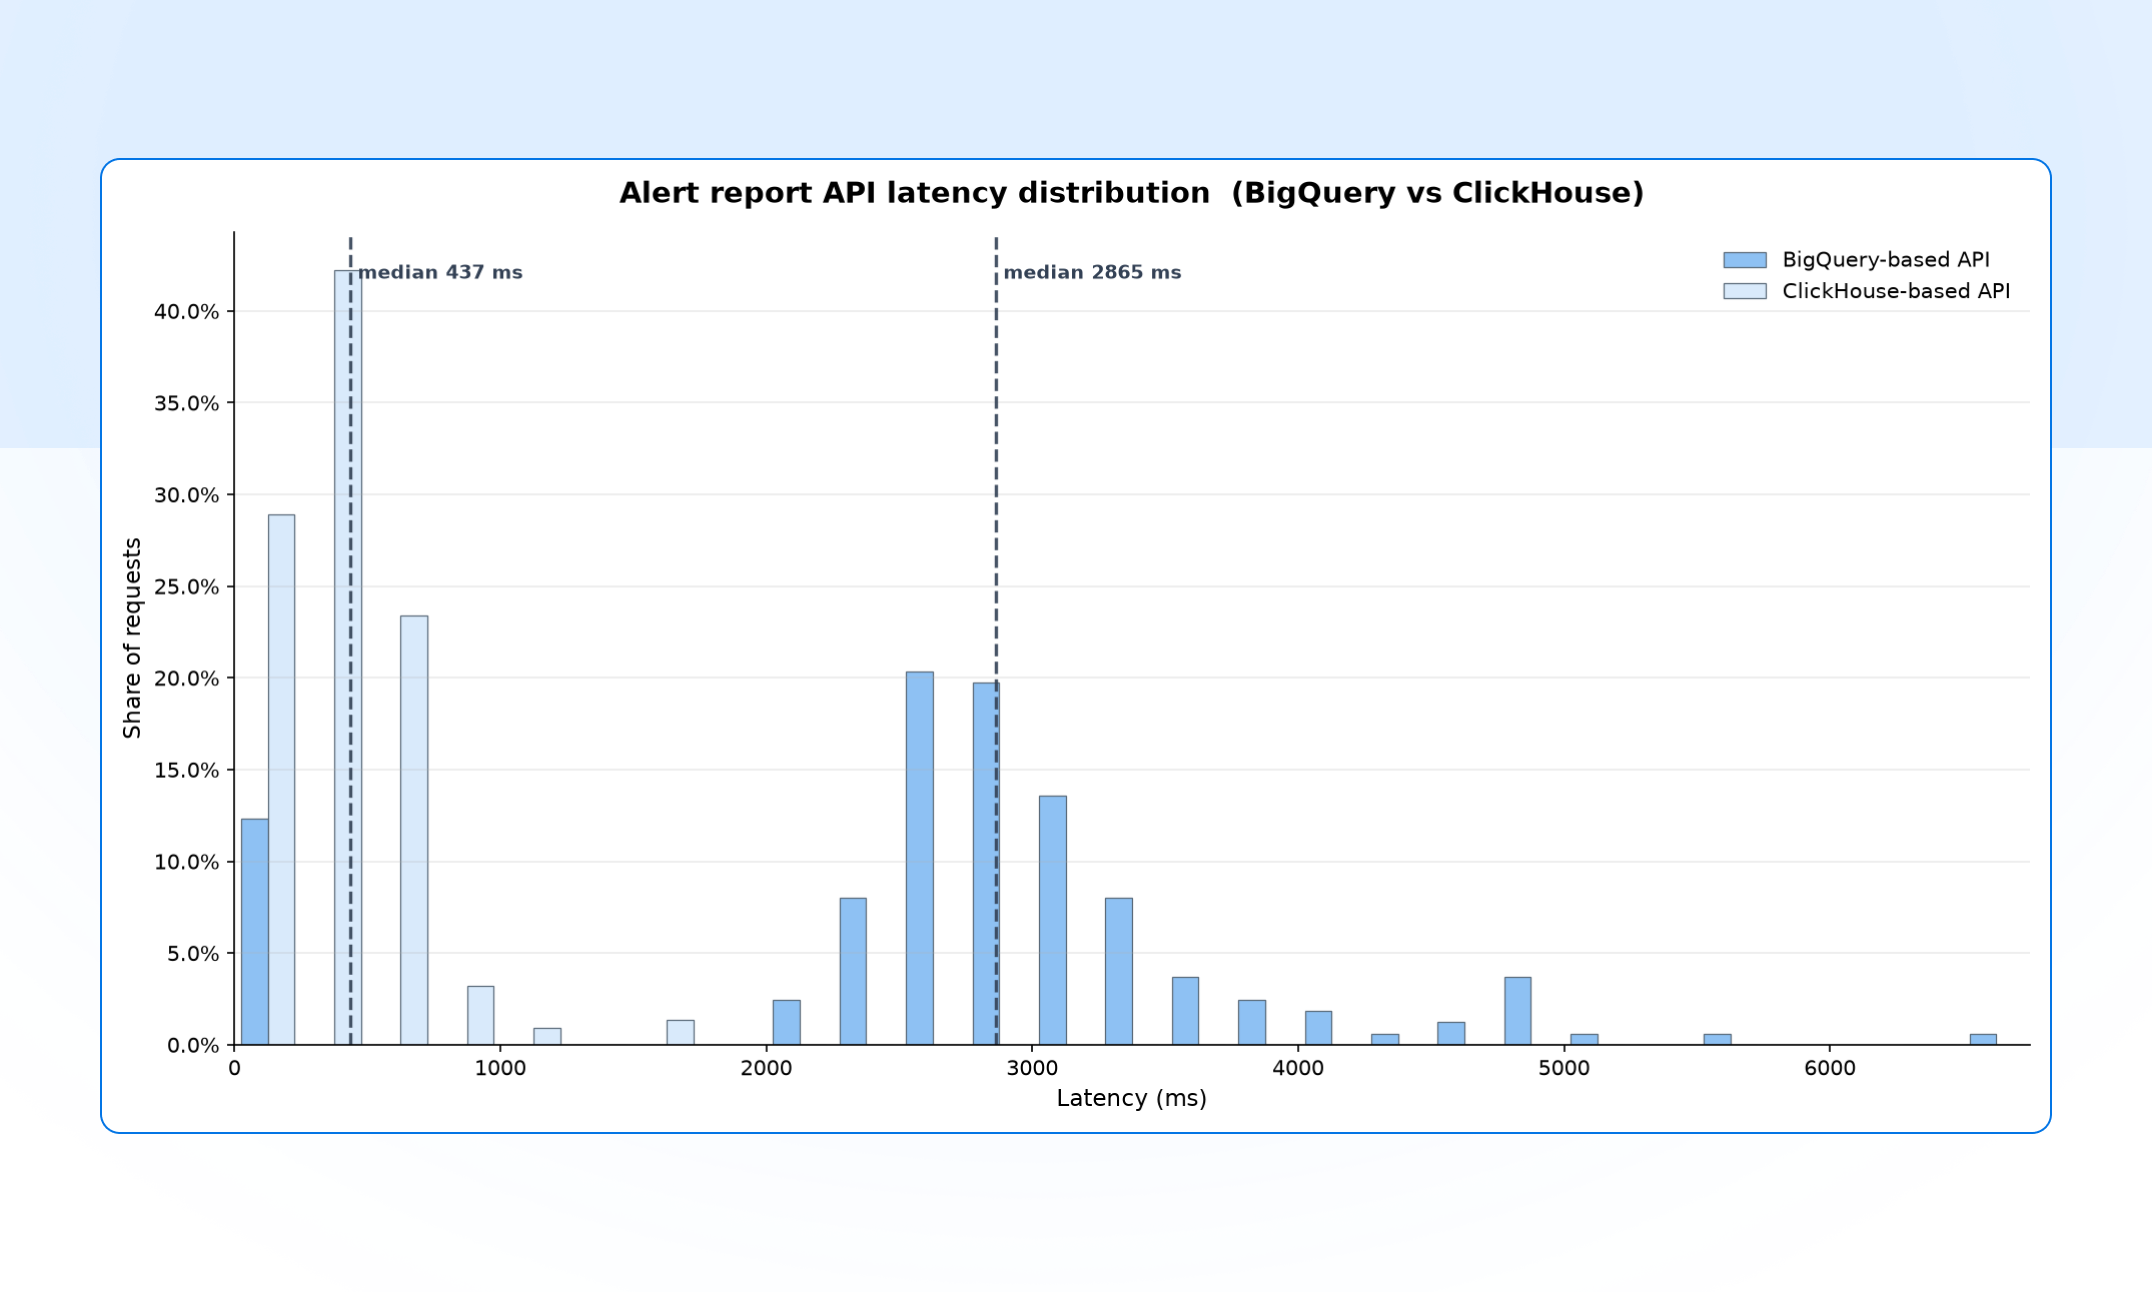
The number we cared about most improved the way we hoped: p95 dashboard query latency dropped from around ten seconds to under two, roughly a 5× speedup.
Everything else followed from the design:
Cost: per-query scan billing is gone, replaced by the fixed, predictable cost of a cluster running on hardware we already operate.
A leaner schema: being able to update the alert-state field through ReplacingMergeTree let us drop to a more compact table layout, instead of the append-and-rewrite workarounds BigQuery required.
Operational resilience: with Kafka buffering ingestion, a ClickHouse maintenance window is a queue that drains later, not lost data, and a bad transform is a replay, not an incident.
One less dependency: BigQuery was our last workload on GCP. Retiring it dropped a whole cloud provider from our tech stack.
All in all, we’re happy with the migration. The wins above were the goal, but the bigger payoff is what it opens up: with fast, affordable, real-time analytics as our new baseline, richer reporting and deeper insights are suddenly cheap to build. Expect a lot more analytical capabilities landing in the ilert platform soon.
Not all alerts are created equal. Some are resolved quickly by the on-call engineer. Others signal something serious enough to affect your business and require your whole team to coordinate. That is why we redesigned incidents as a dedicated coordination workspace for the alerts that have the most business impact.
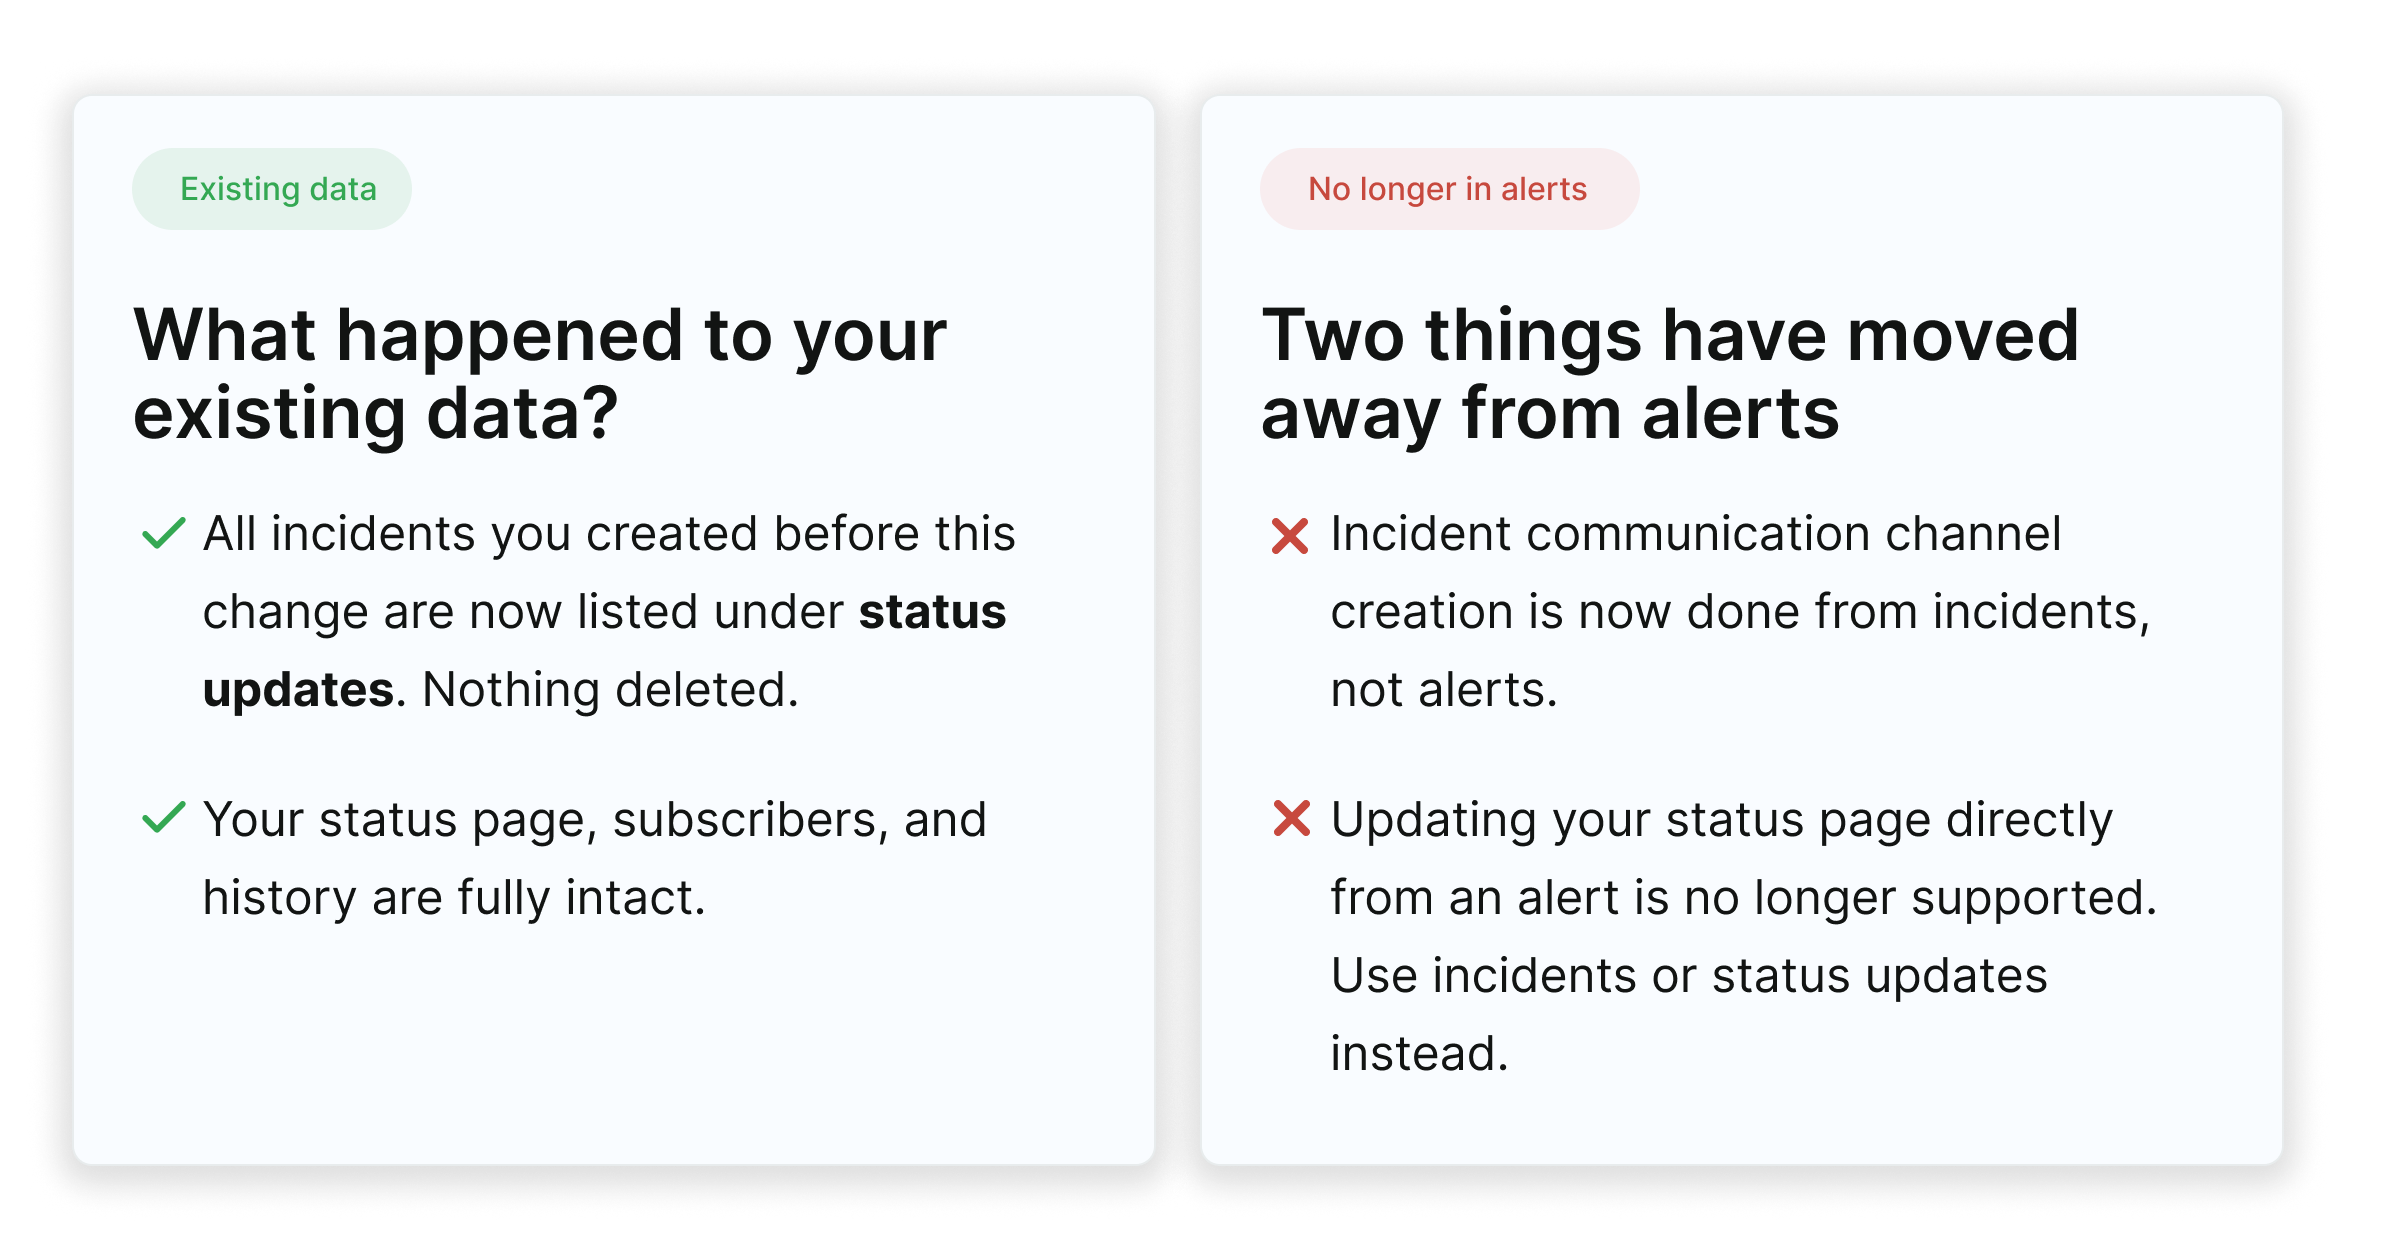
Until now, incidents in ilert were used to communicate status updates to customers and stakeholders. Creating one meant publishing to your status page. We have separated the two. Incidents are now internal. Status updates remain the way you communicate externally, and they go out only when you choose to post one.
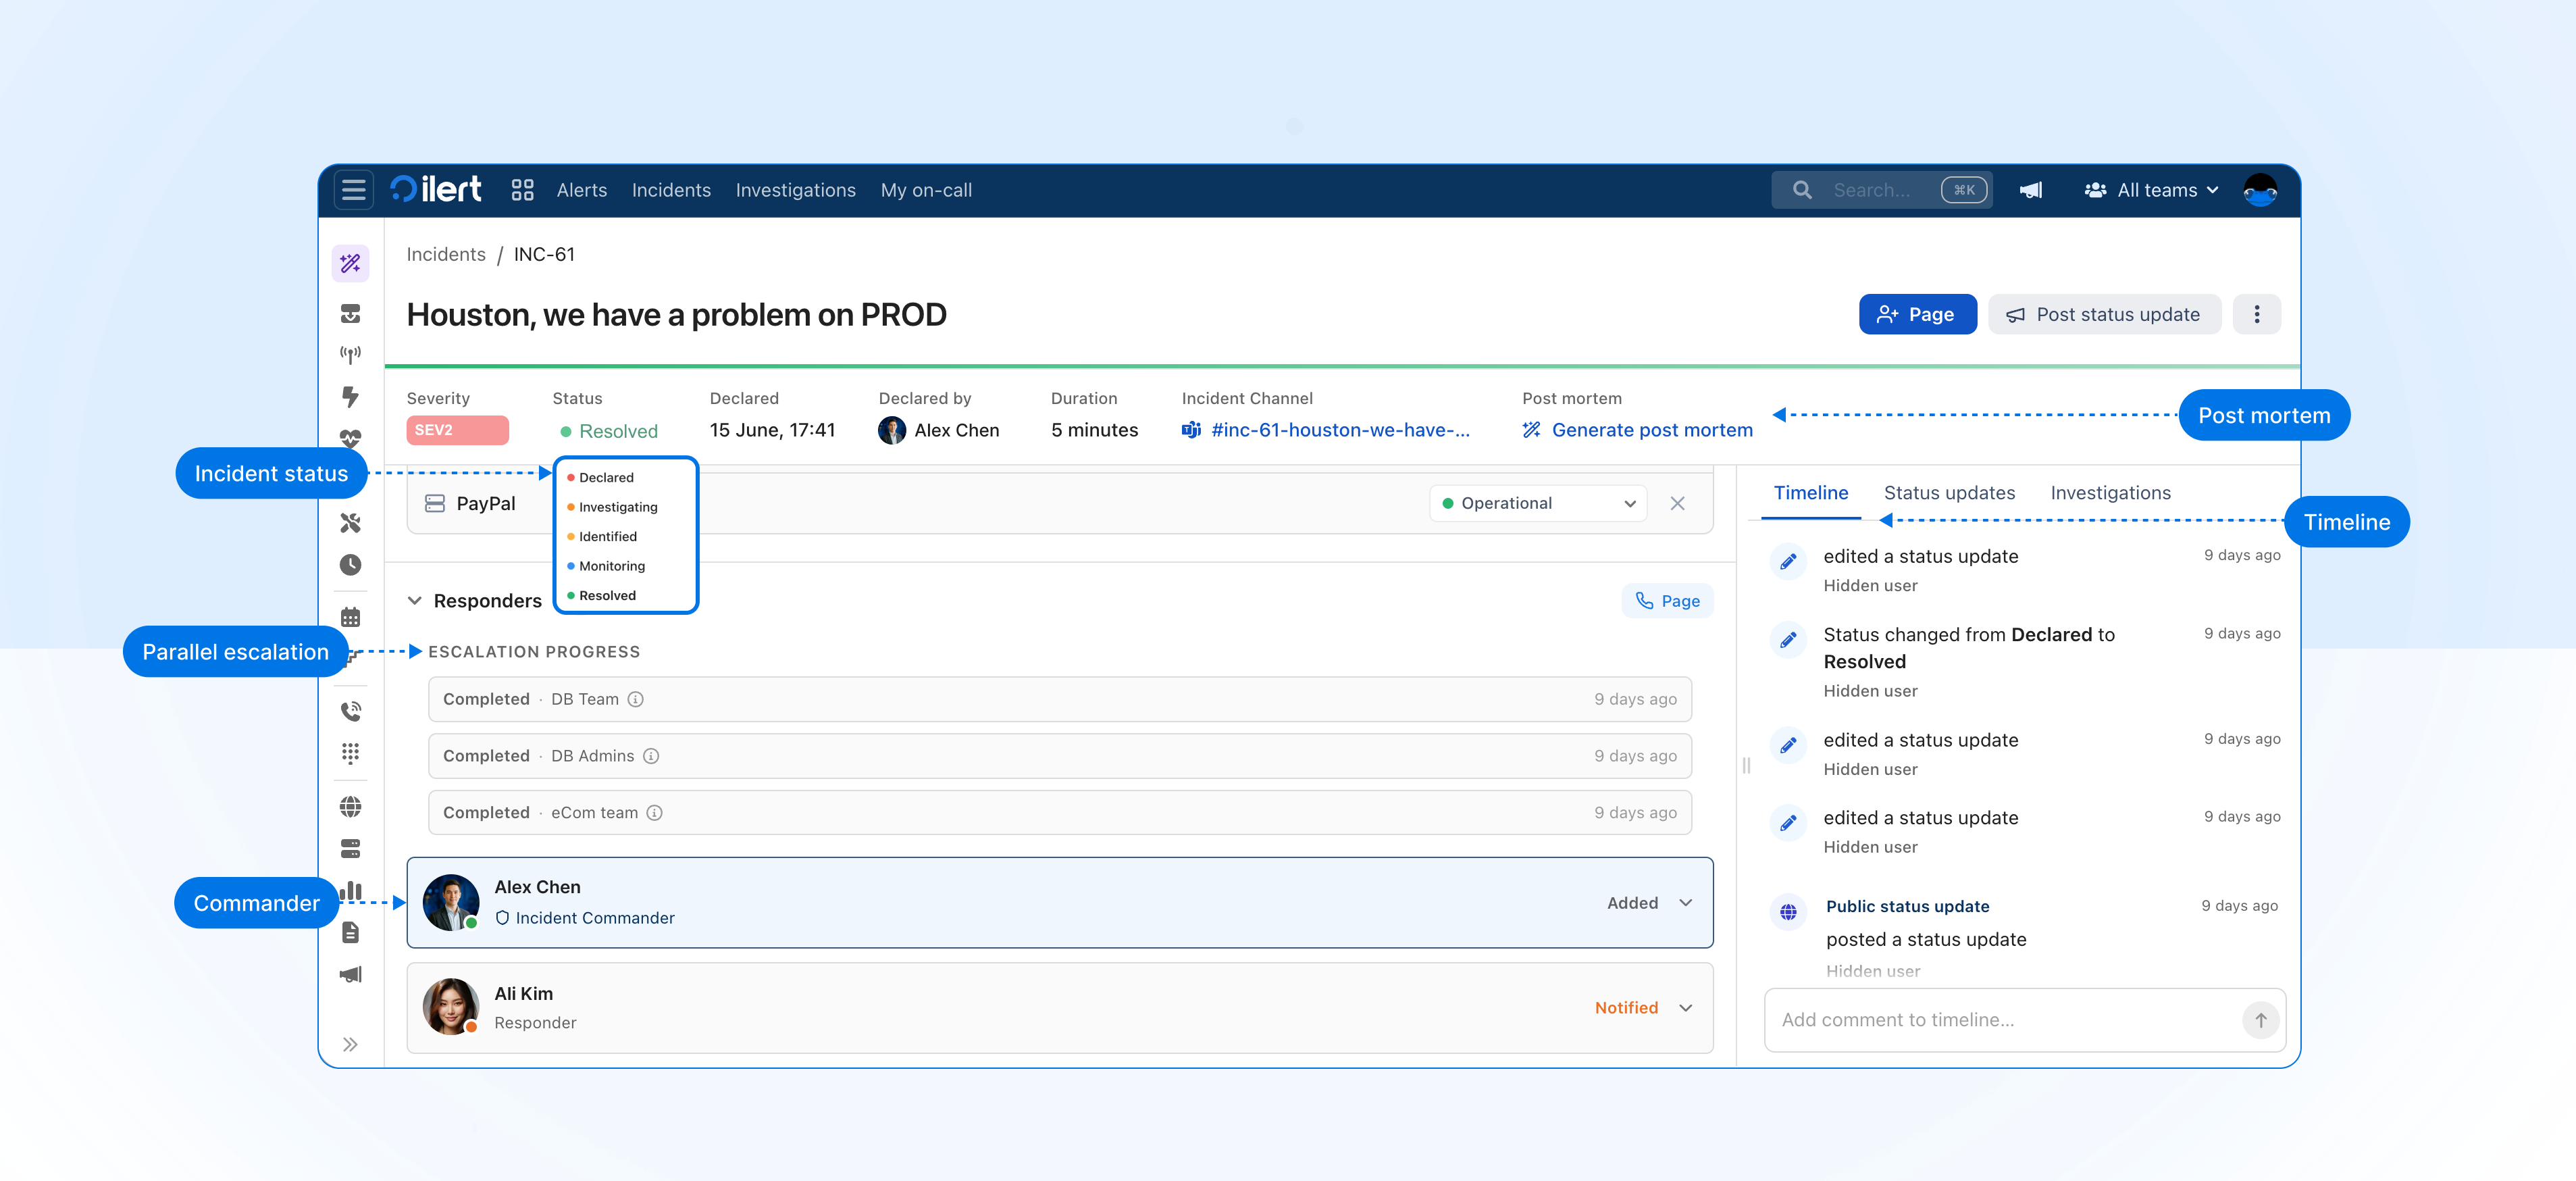
Inside an incident, your team can create an incident channel, run parallel escalations, track the timeline, manage status, and create post-mortems. Nothing reaches your customers until a status update is published.
Here is what changed and what is new.
Incidents are now your internal coordination workspace
Previously, creating an incident in ilert meant publishing an update to your status page directly. Incident coordination lived inside alerts, and information went public the moment an incident was created.
That's no longer the case, incidents are internal; nothing is public until you post a status update. Creating an incident opens an internal workspace for your response team, and nothing reaches your status page until you choose to publish a status update. The two are fully decoupled.
Alerts, incidents, and status updates
With this change, ilert now has three clearly separated objects, each with a different purpose:
Alerts have not changed. They signal issues and page your team.
Incidents are now a dedicated internal workspace for coordinating your response. They are no longer tied to your status page.
Status updates are now separate from incidents. They are how you communicate with customers and stakeholders when you are ready.
Your existing incidents will be migrated automatically to status updates. Nothing has been deleted.
Declare incidents with severity and a dedicated channel
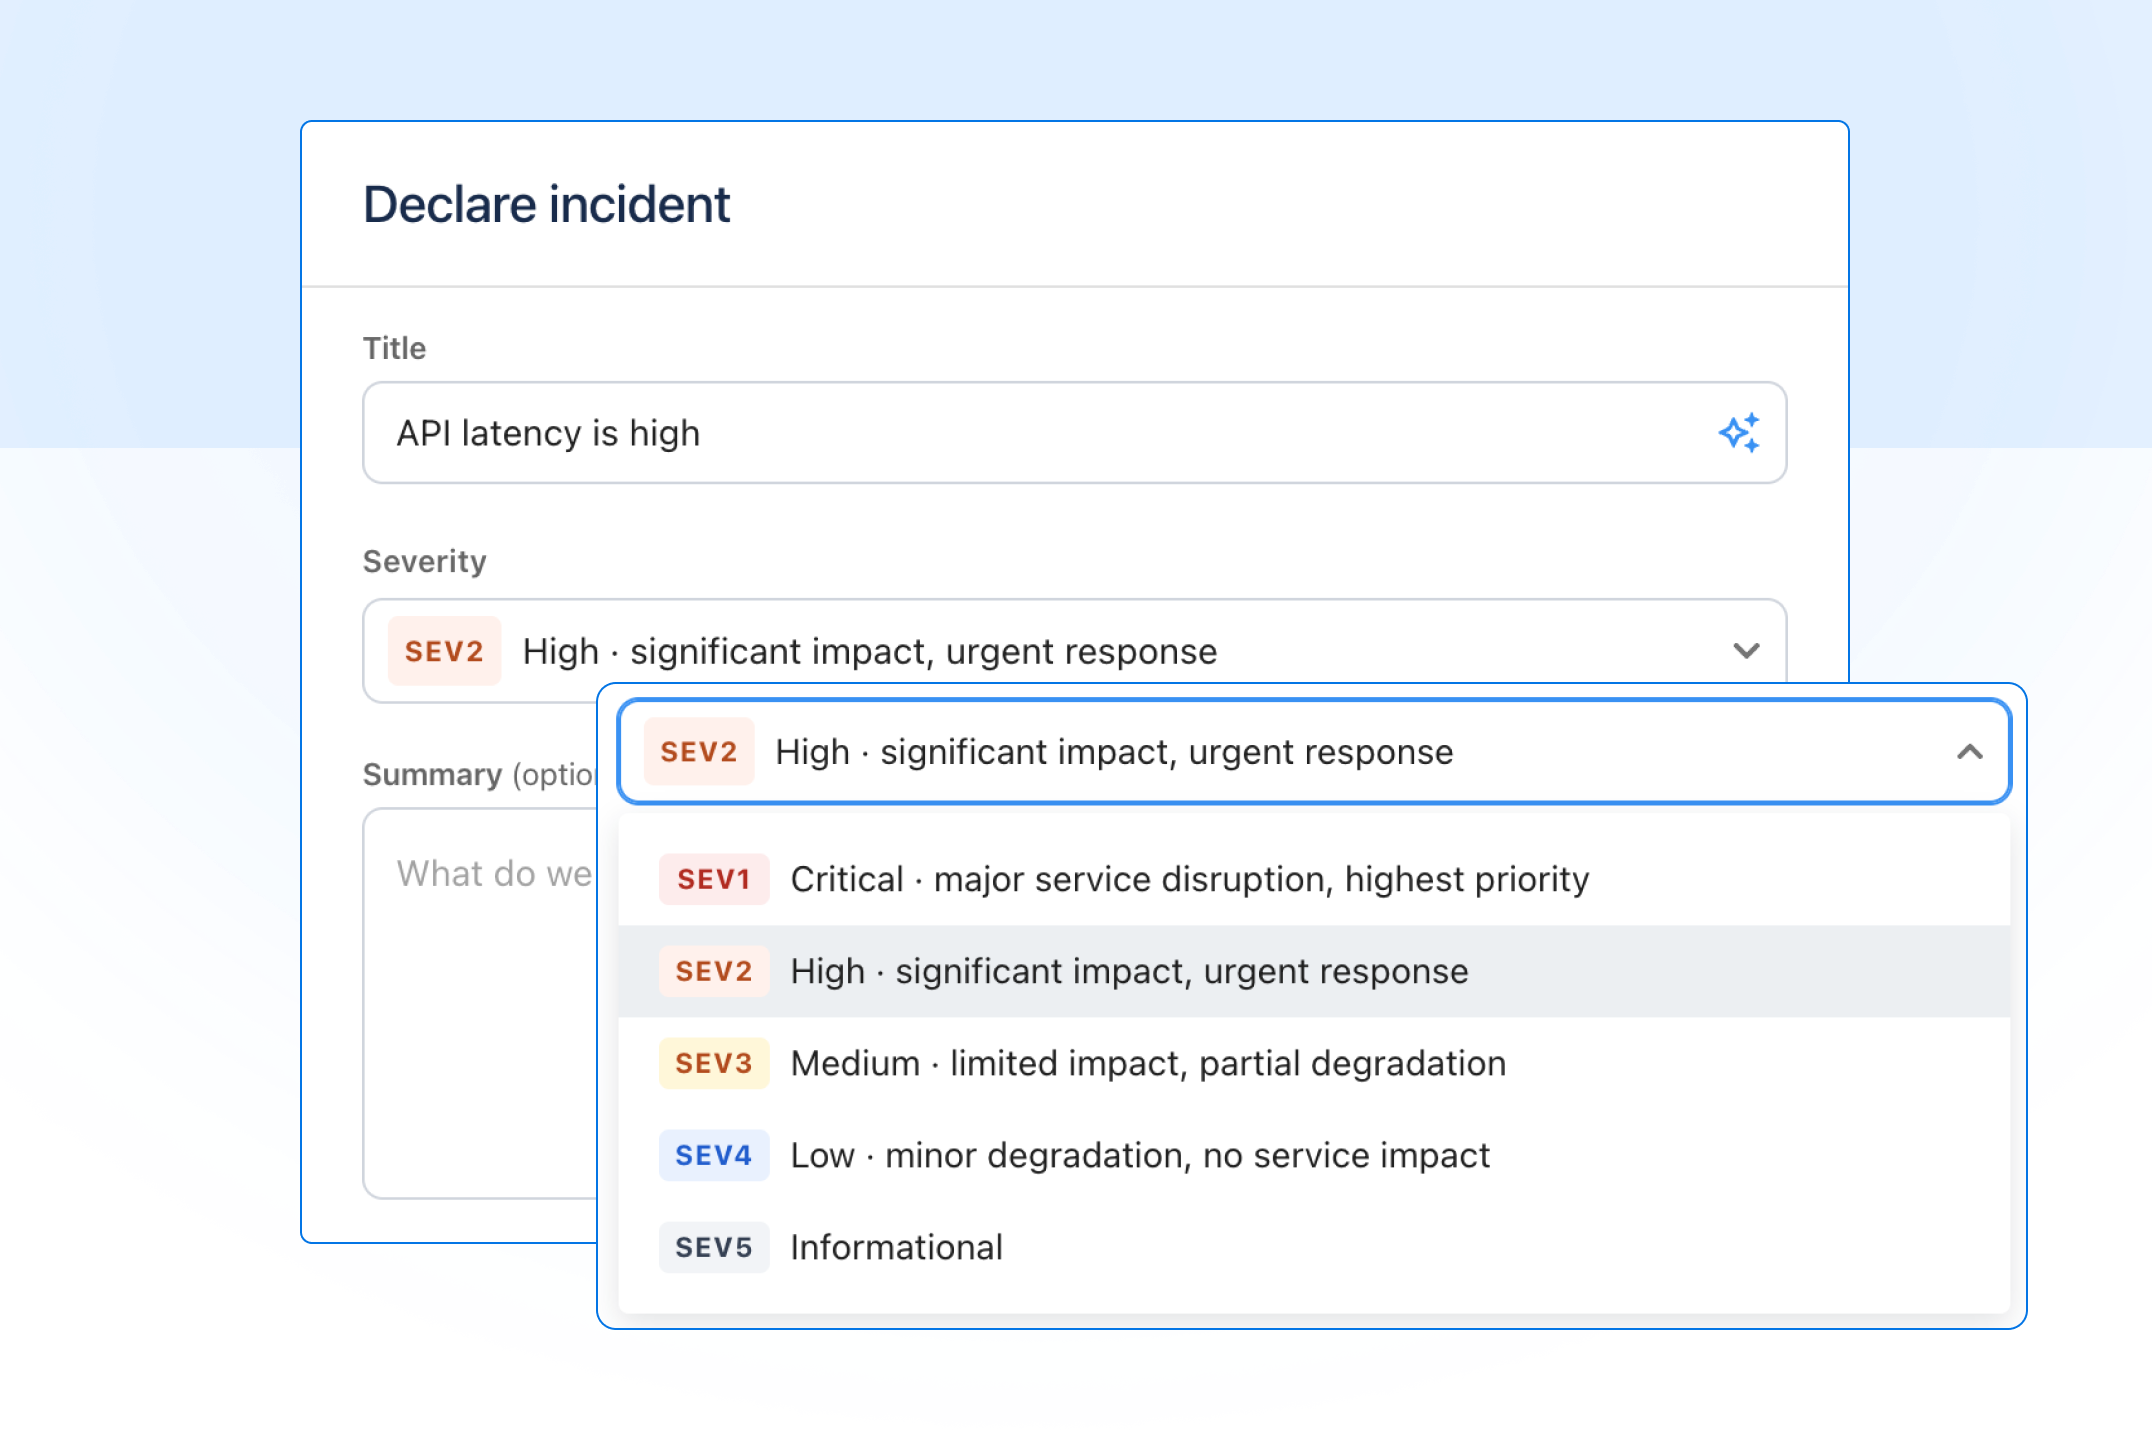
Two new fields appear when you declare an incident: severity and incident channel.
Severity
Severity lets you classify the business impact from the moment of declaration, which is useful for routing, reporting, and setting expectations with your team. When declaring an incident, severity is set to SEV3 by default and can be changed depending on your context.
Incident channel
A dedicated channel can be created when you declare an incident. Previously this was done from alerts. It now lives in the incident, where all the context for that response is kept in one place.
A full response workspace: parallel escalation, incident commander, status, timeline, and post mortems
Once declared, the incident becomes the single place your team coordinates the response.
Parallel escalation
Page multiple teams and individuals at the same time when you declare an incident. You do not have to wait for one escalation chain to step through before paging the next.
You can trigger all of these simultaneously:
An escalation policy
An on-call schedule
A full team, which pages every member at once
A specific user, directly
When paging a team directly, the first member to join the incident stops the page for others, who receive a "page resolved" notification.
Incident commander
Assign a named person to own the response, giving the team a single point of accountability from declaration through to resolution.
Incident status
Status can be tracked and updated as the team works on the situation, keeping everyone internally informed on where the response stands.
Incident timeline
The incident timeline records every action, page, and change automatically in real time. Useful while the incident is running, and essential when writing the post mortem.
Post mortems
Post mortemshave moved from status updates to incidents, where the full record of what happened actually lives. When you resolve an incident, a post mortem can be created and populated from the timeline, incident channel messages, and linked alerts.
Status updates: communicating with stakeholders
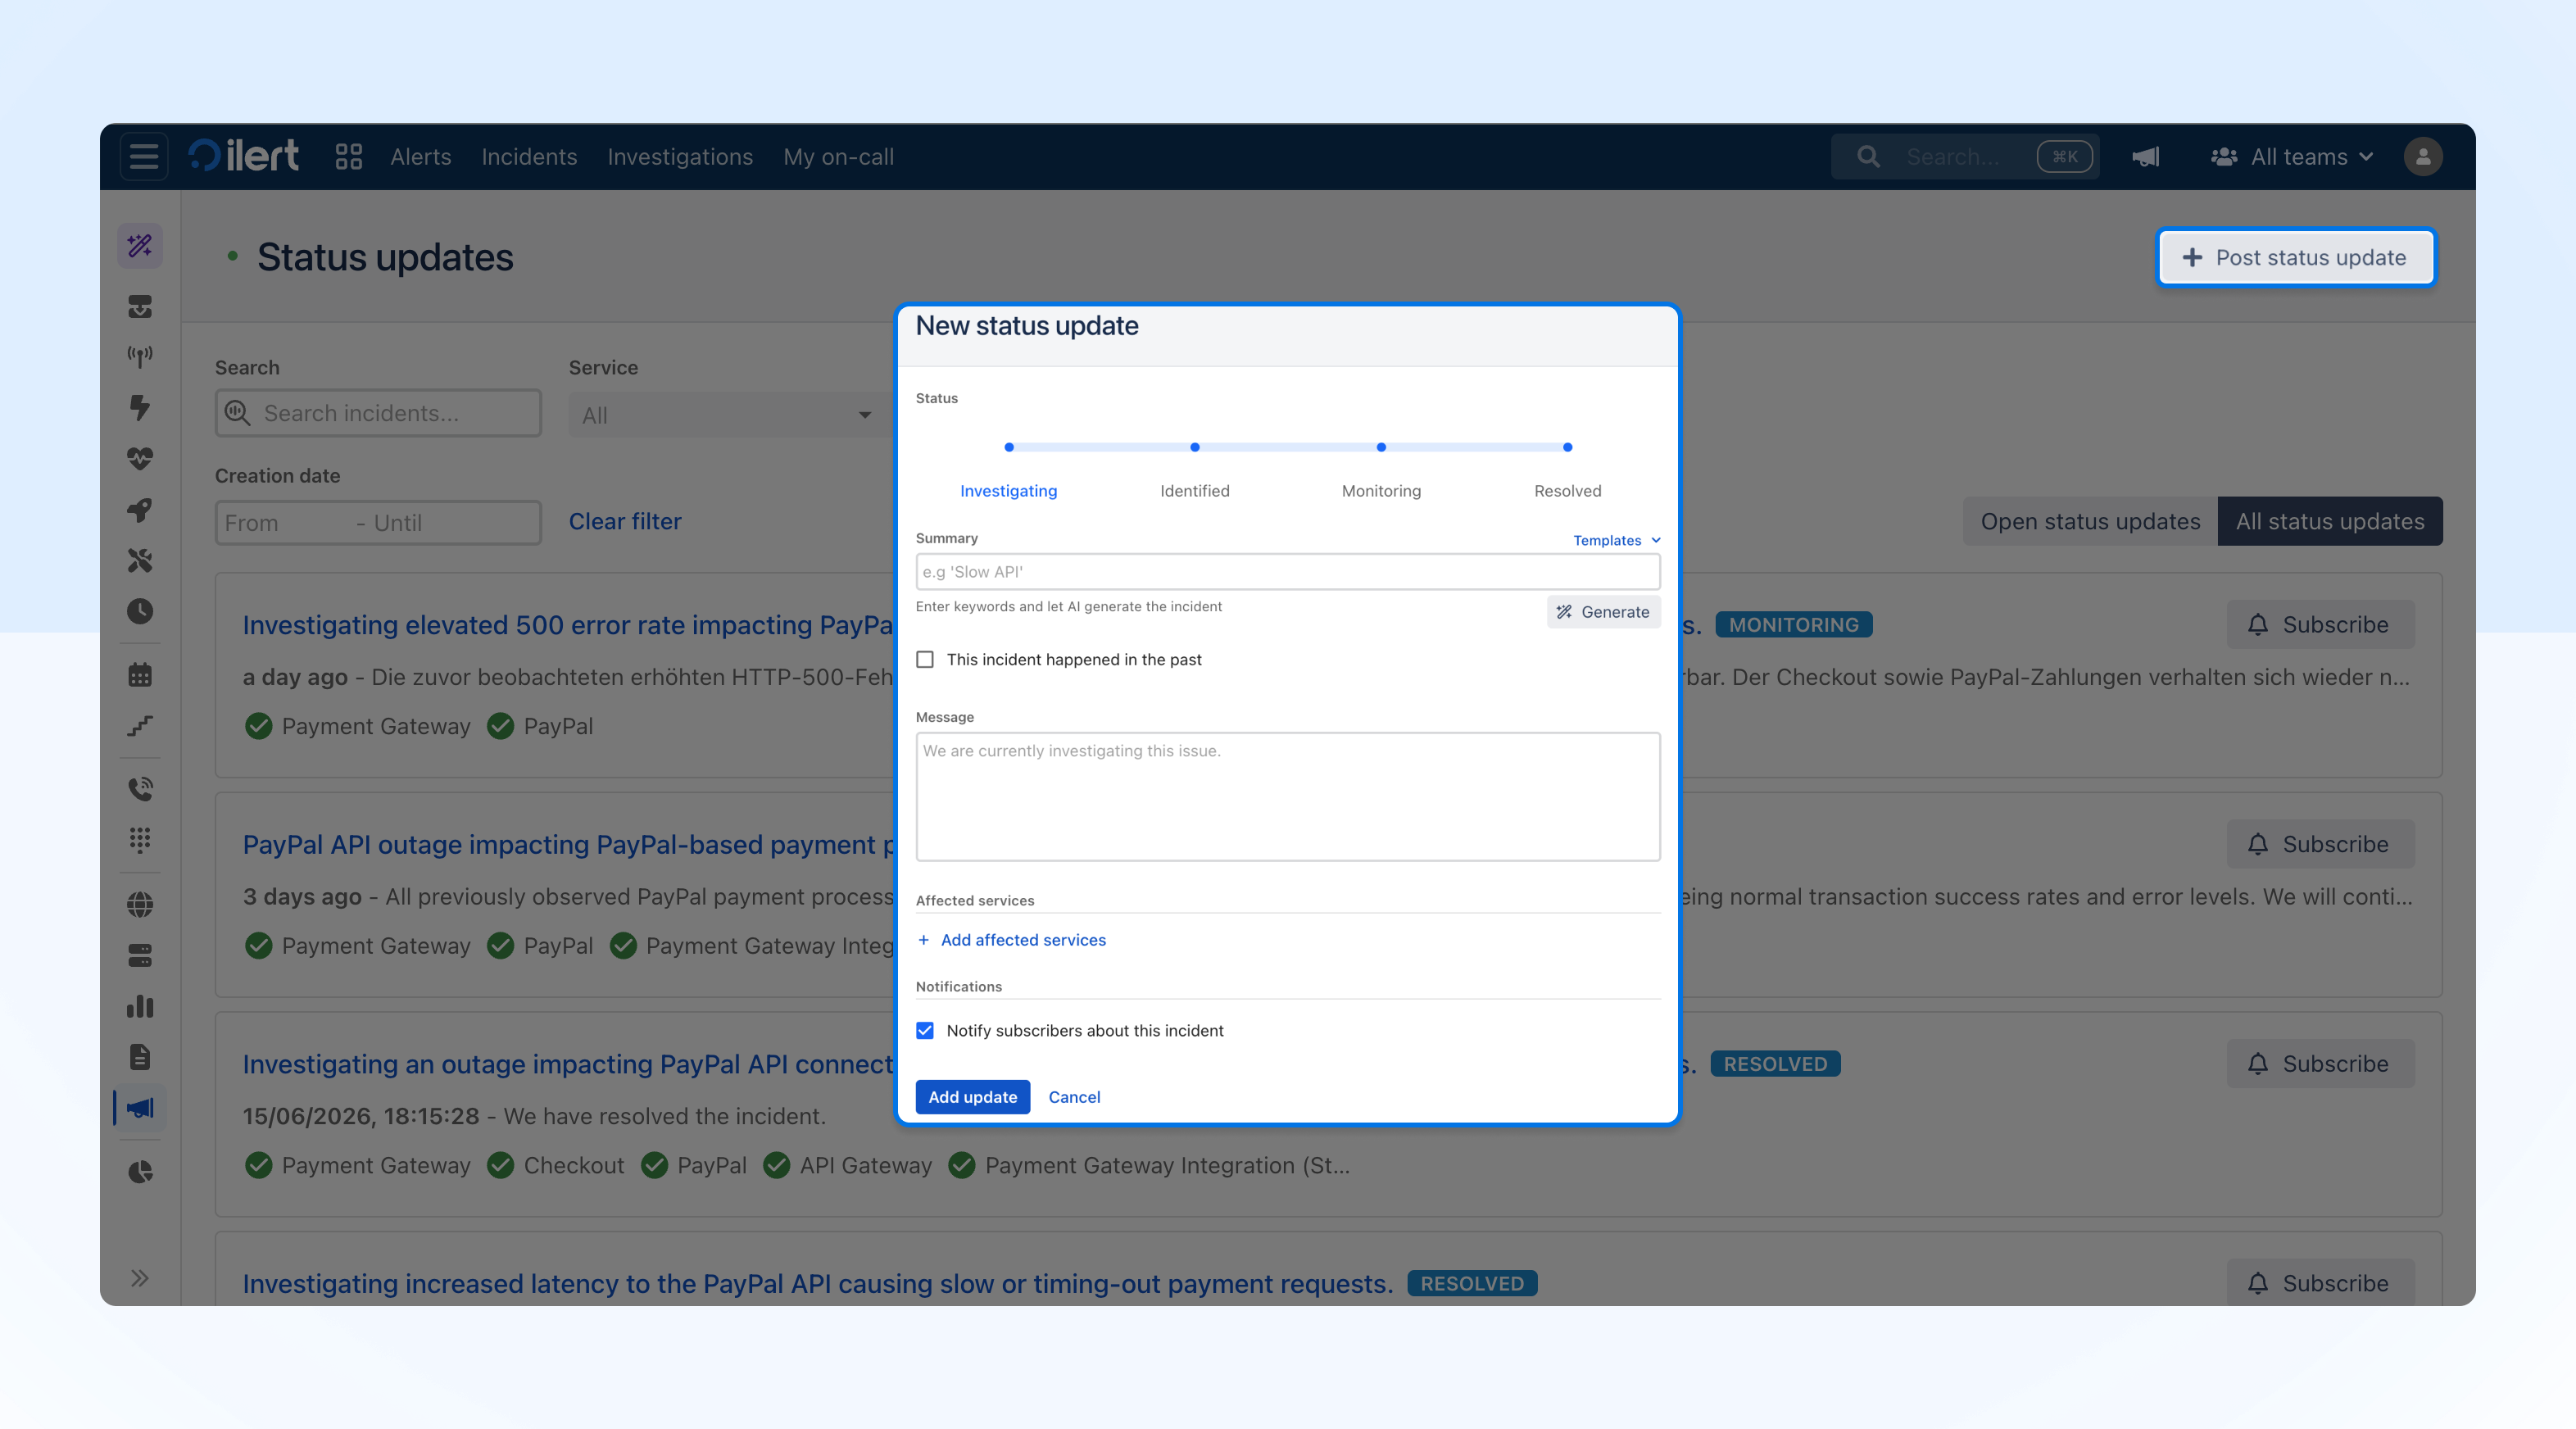
What was previously called an incident on your status page is now called a status update. The functionality is unchanged. Status updates now have their own dedicated page in ilert.
There are two ways to create a status update.
Post status update from status updates page
The status updates page gives you a dedicated view of all your published updates. Filter by service, status page, and creation date, and post new updates directly from there.
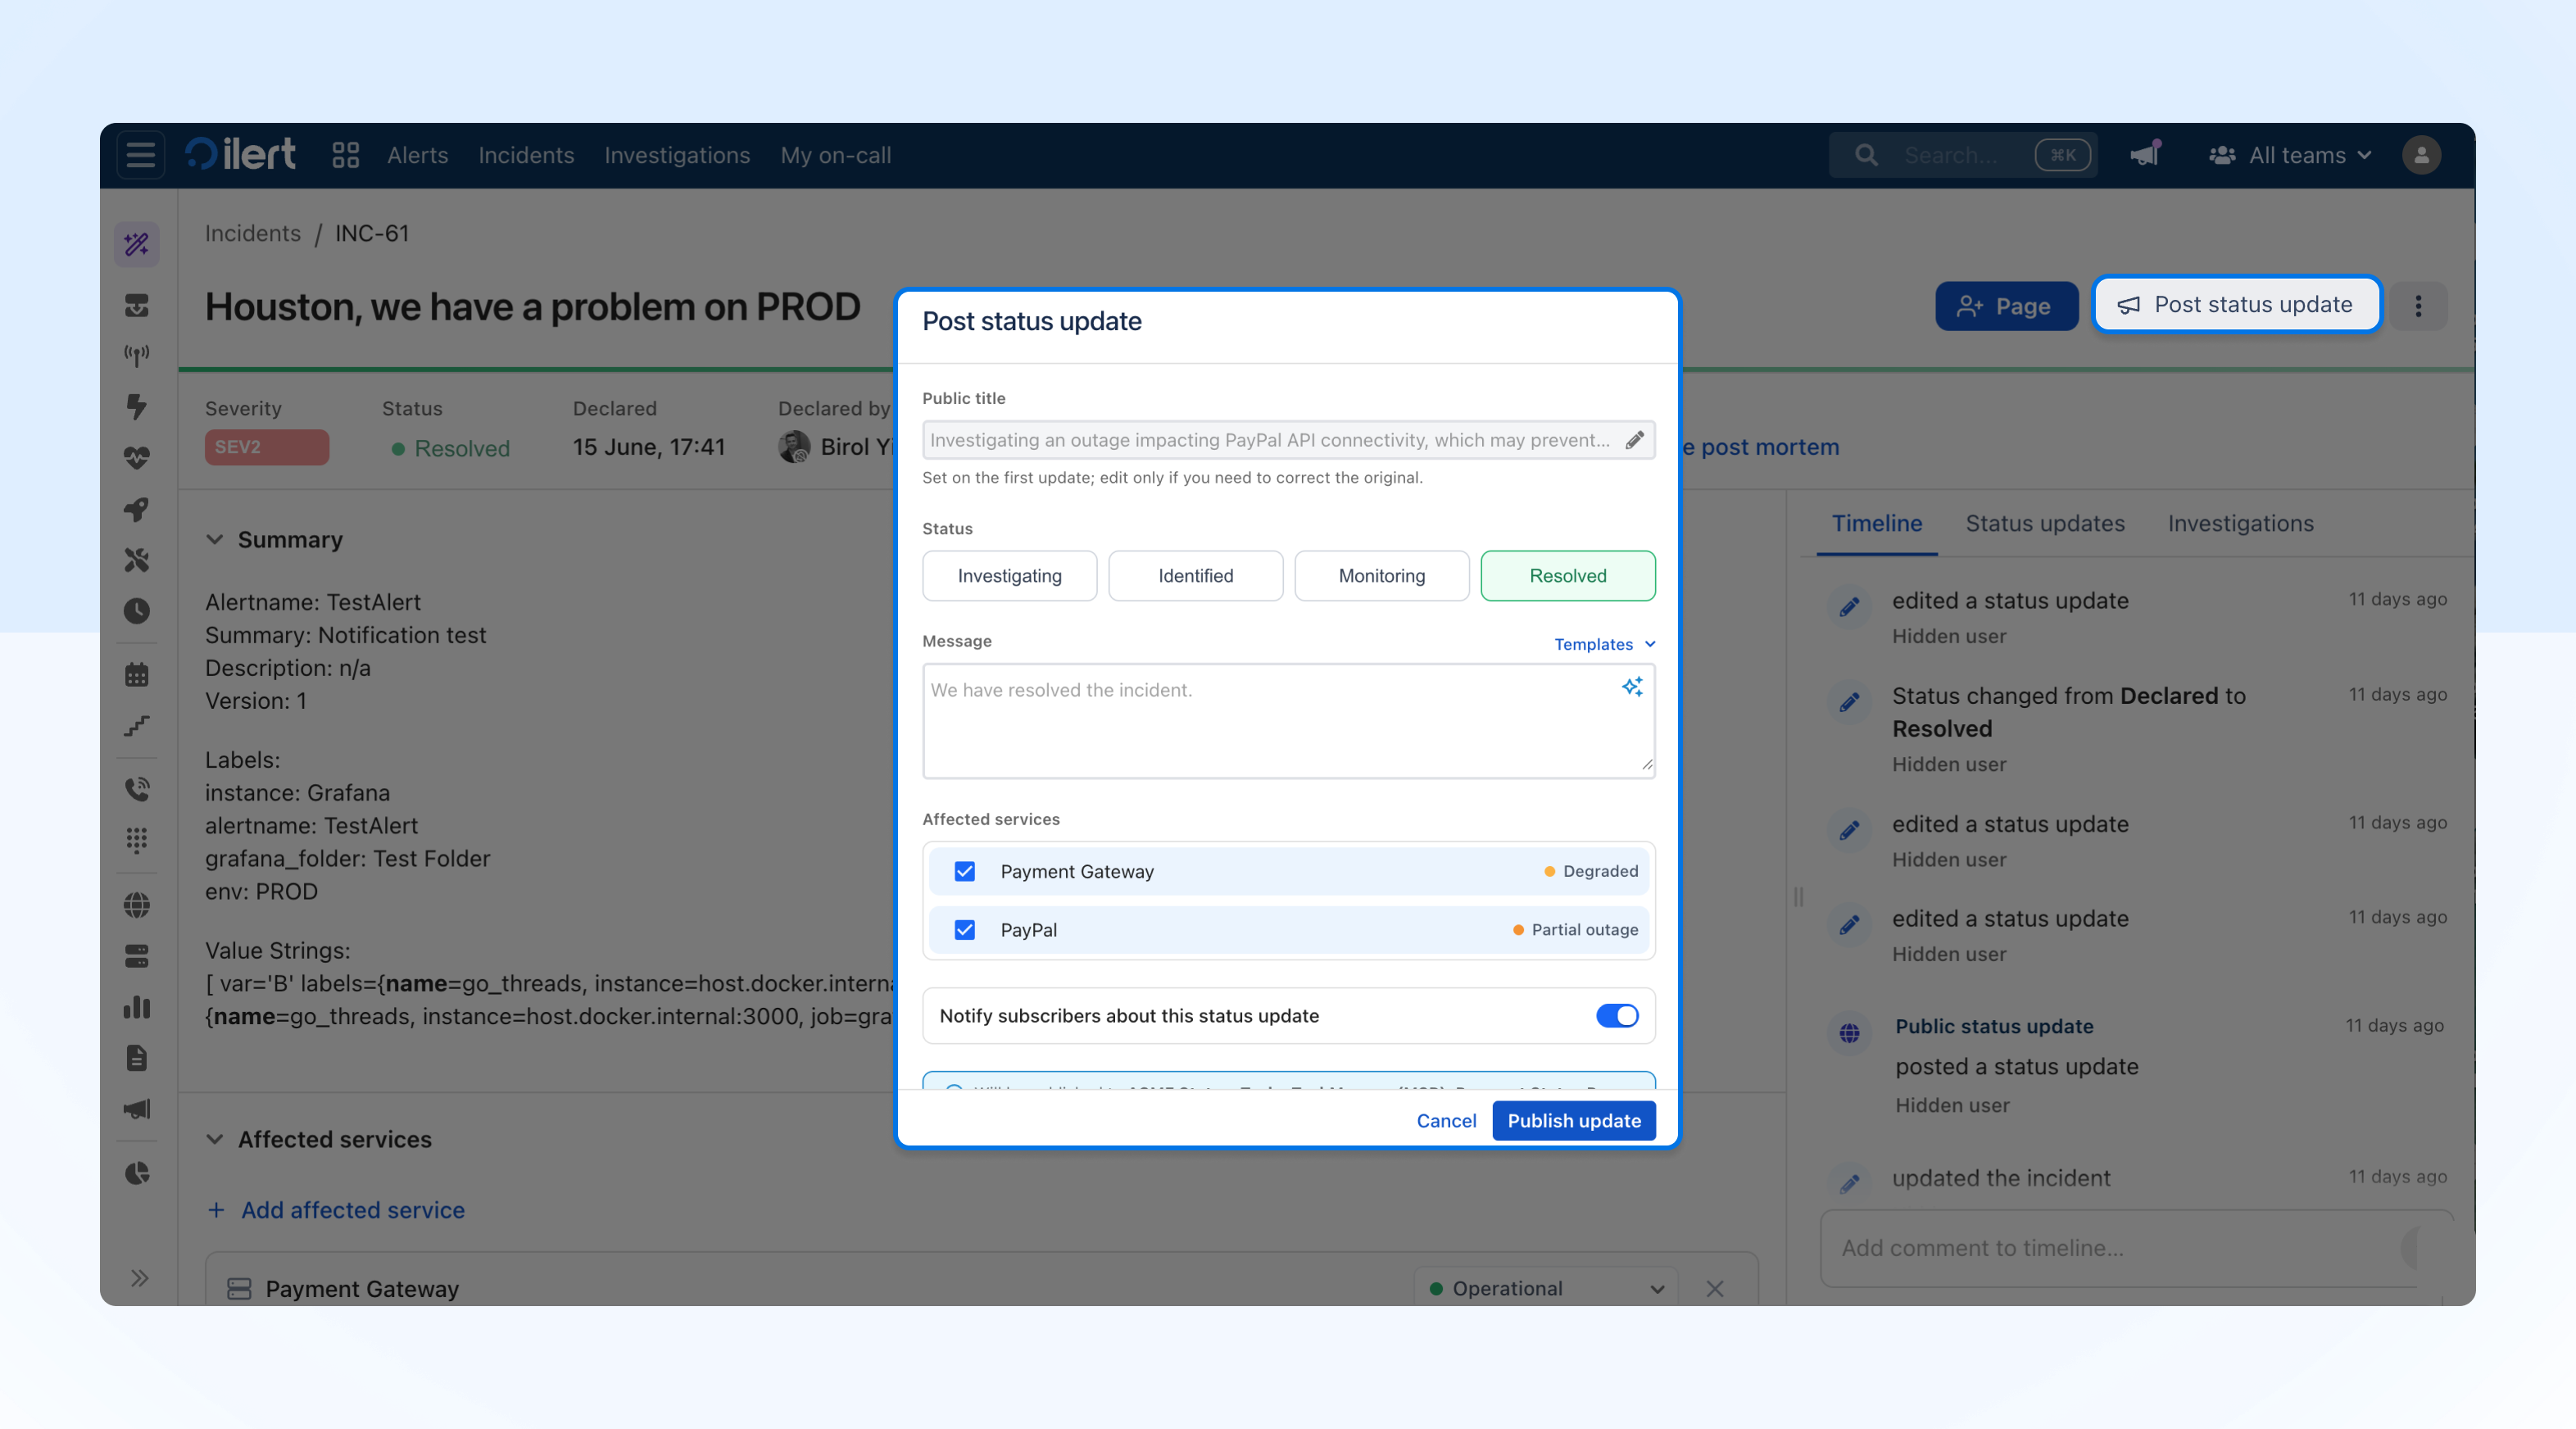
Post status update from incident (recommended)
Work the incident internally, then publish a status update when you are ready to communicate externally. The status update is linked to the incident, keeping your internal coordination and external communication connected.
In short, incidents now serve as an internal coordination layer with a dedicated set of tools to support your team during response. Status updates remain unchanged and are the communication layer used to inform your customers and stakeholders.
If you have any questions or need support navigating the new setup, reach out to your Customer Success Manager or contact our support team.
Changes will start rolling starting Monday, July 20th. If you want to expedite the switch, reach out to us at support@ilert.com.
New to ilert? Incident management is available on all plans. Try it for free and see how your team can coordinate faster when it matters most.
From a redesigned navigation and the new ilert Marketplace to dynamic service mapping and on-prem alert delivery, here's everything that's shipped across this quarter.
Navigation
A new way to navigate ilert
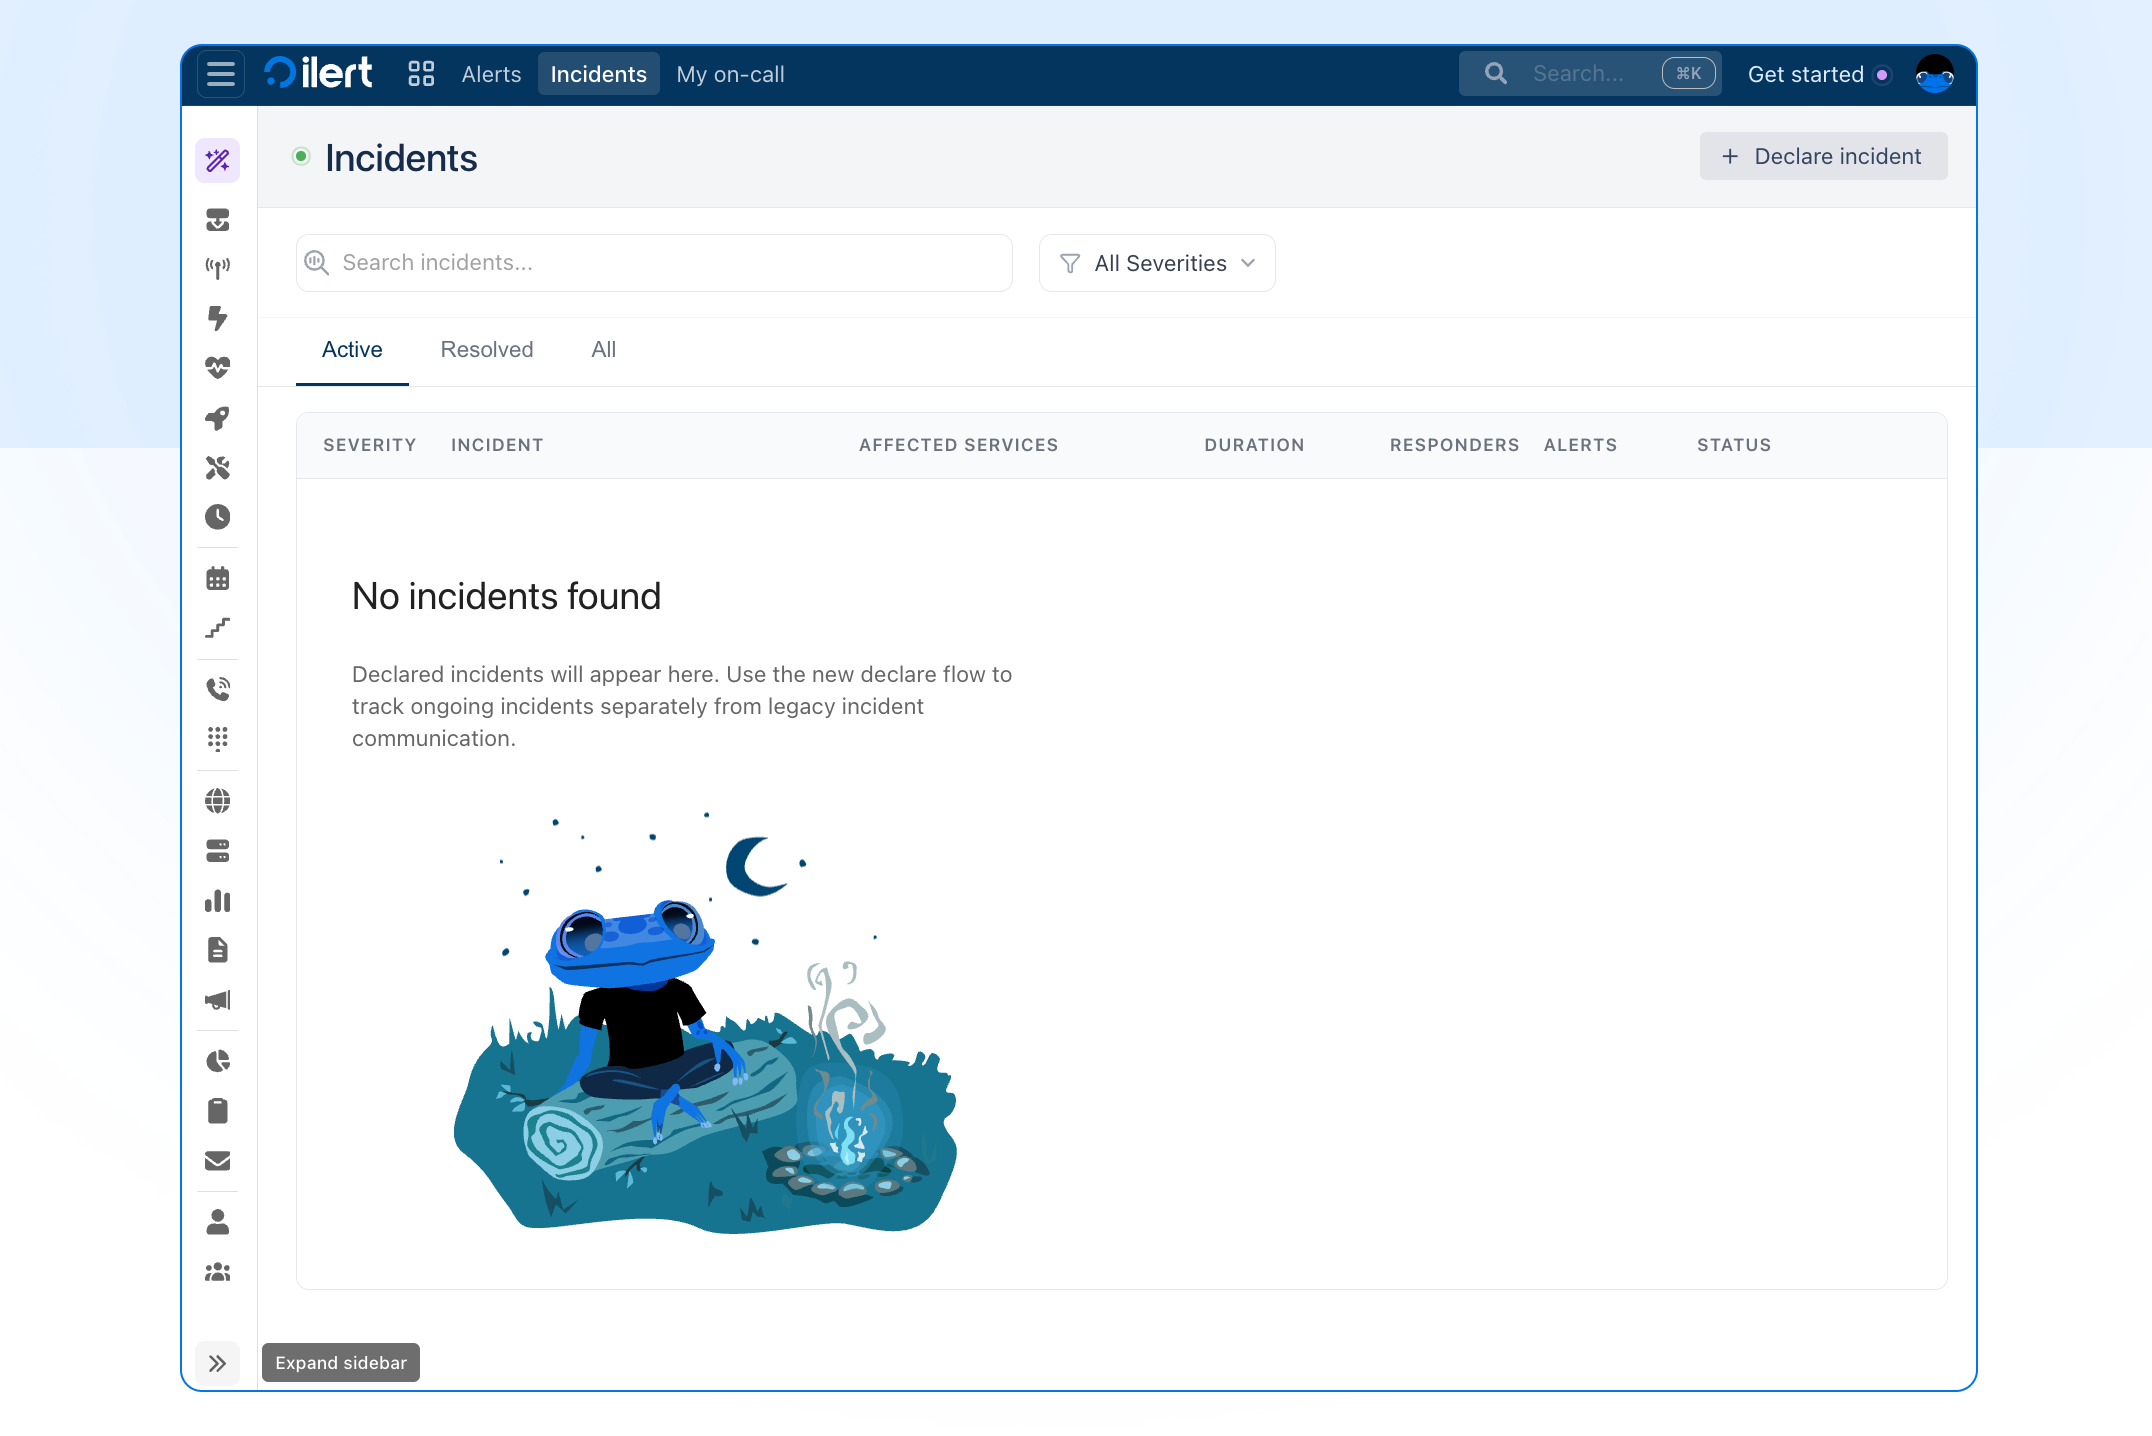
We've redesigned ilert's navigation to keep your operational work front and center while giving the rest of the platform room to breathe. Your day-to-day views: Dashboard, Alerts, Incidents, and My on-call, now live in a persistent top bar, and everything else moves into a new vertical sidebar with three ways to work:
Keep the full menu open, with labels and section headings.
Collapse it out of the way to reclaim screen space.
Toggle between the two with the hamburger button.
Open your profile menu and switch on "New navigation" to try it.
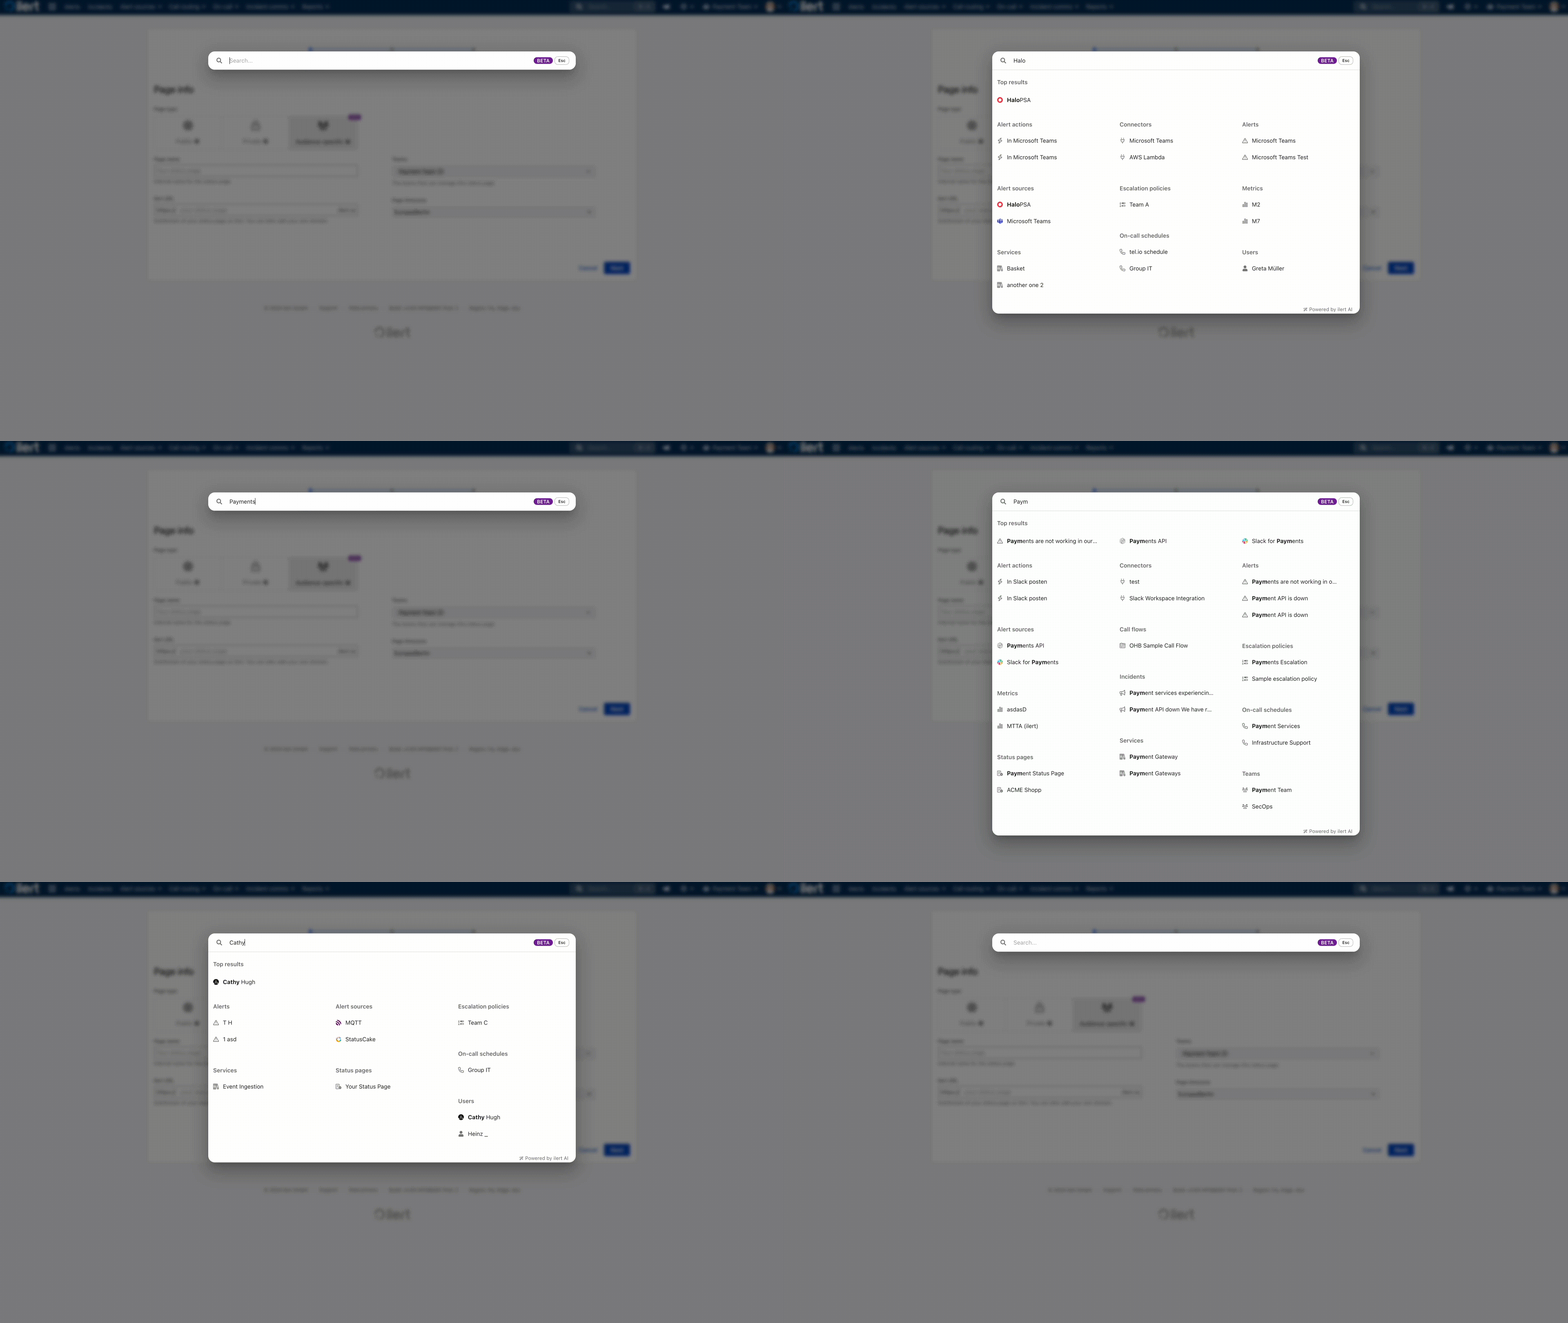
Every page in ilert is now searchable
Every page in ilert is now reachable from the global search bar. Click the search icon and start typing: Alert sources, Escalation policies, Heartbeat monitors, Audit logs, and you'll land there in seconds.
Click the search icon to try it. A new ⌘K / ctrl+K command palette lets you jump to any page or entity in a single keystroke.
Alerting & Incident Management
Dynamic service mapping
Dynamic service mapping is here. Define which alert fields carry your service information such as labels.service from Grafana, tags.service from Datadog and ilert automatically extracts those values and links the relevant services to every incoming alert. No more manual tagging. And when a service doesn't exist yet, enable auto-create and ilert provisions one for you, ready for review.
A head start on alert templates
Building an alert template from a blank page meant knowing every variable and field, and how you wanted them laid out, before you could see anything useful. Now, when you set up a template for one of our most popular integrations, you'll find a default already filled in, modeled closely on how ilert formats those alerts out of the box, so you start from a working template instead of zero. Edit any part of it, leave the rest, and ship. Try it next time you create or edit an alert source template.
Find the maintenance window you need, faster
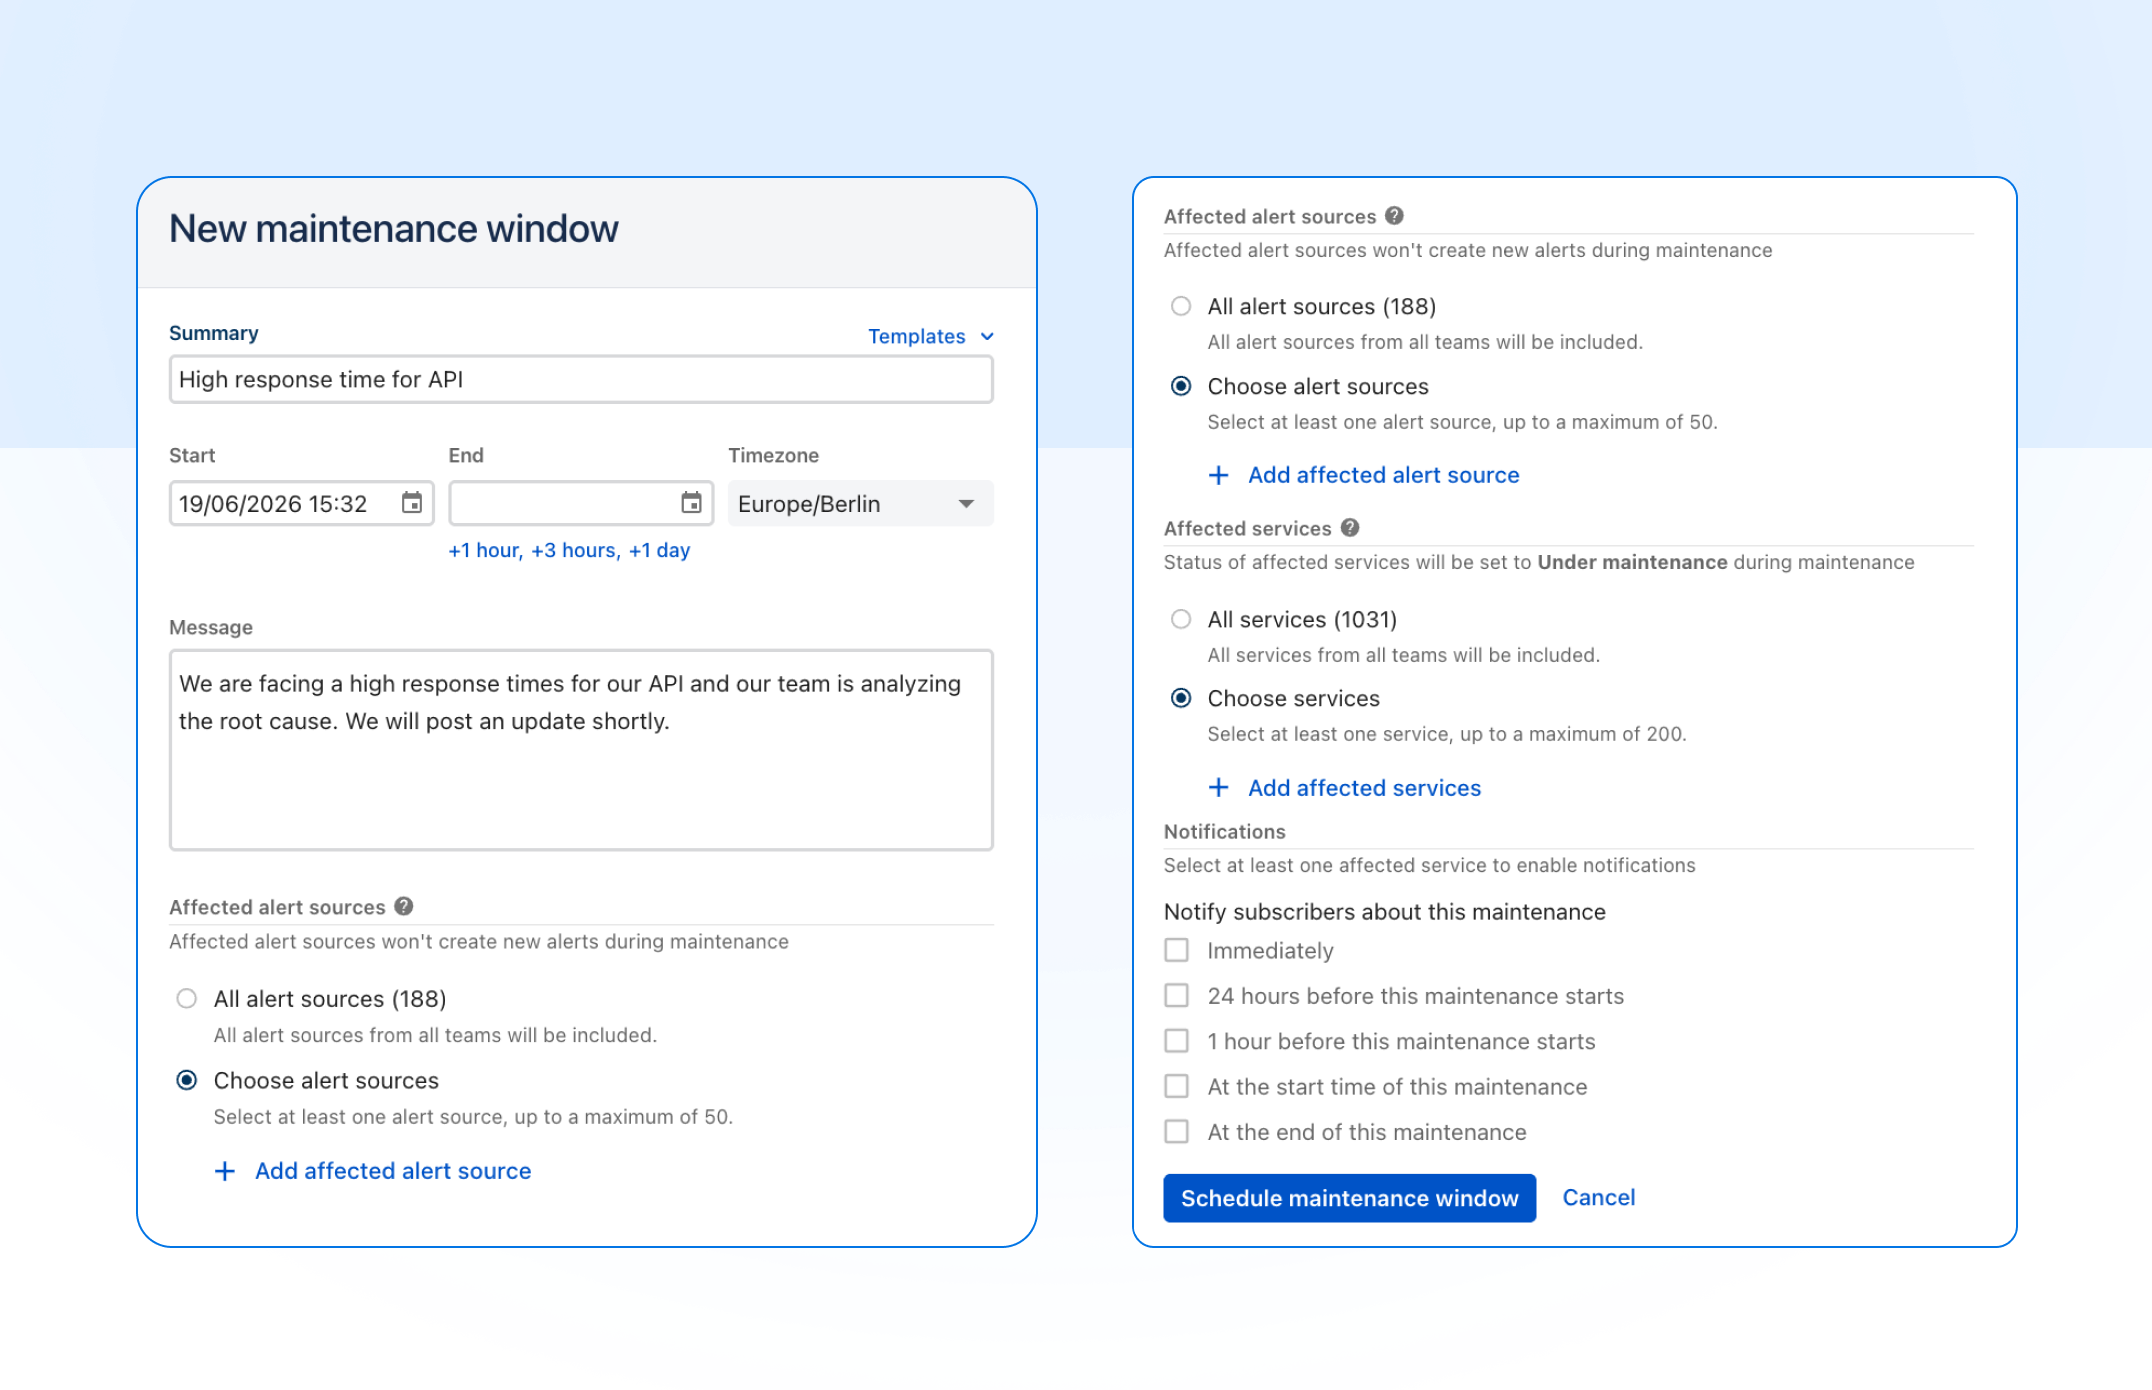
The maintenance windows list now supports the same filters as our API: narrow results by service, by alert source, and by date range with from/until pickers. Whether you're auditing past windows for a specific service, checking what's scheduled on a given alert source, or pulling up everything happening next week, you can get there in a couple of clicks instead of scrolling. Filters combine, and the URL updates as you go, so you can bookmark or share a filtered view with your team. Head to Alerting → Maintenance windows to try it.
Filter alert reports by severity
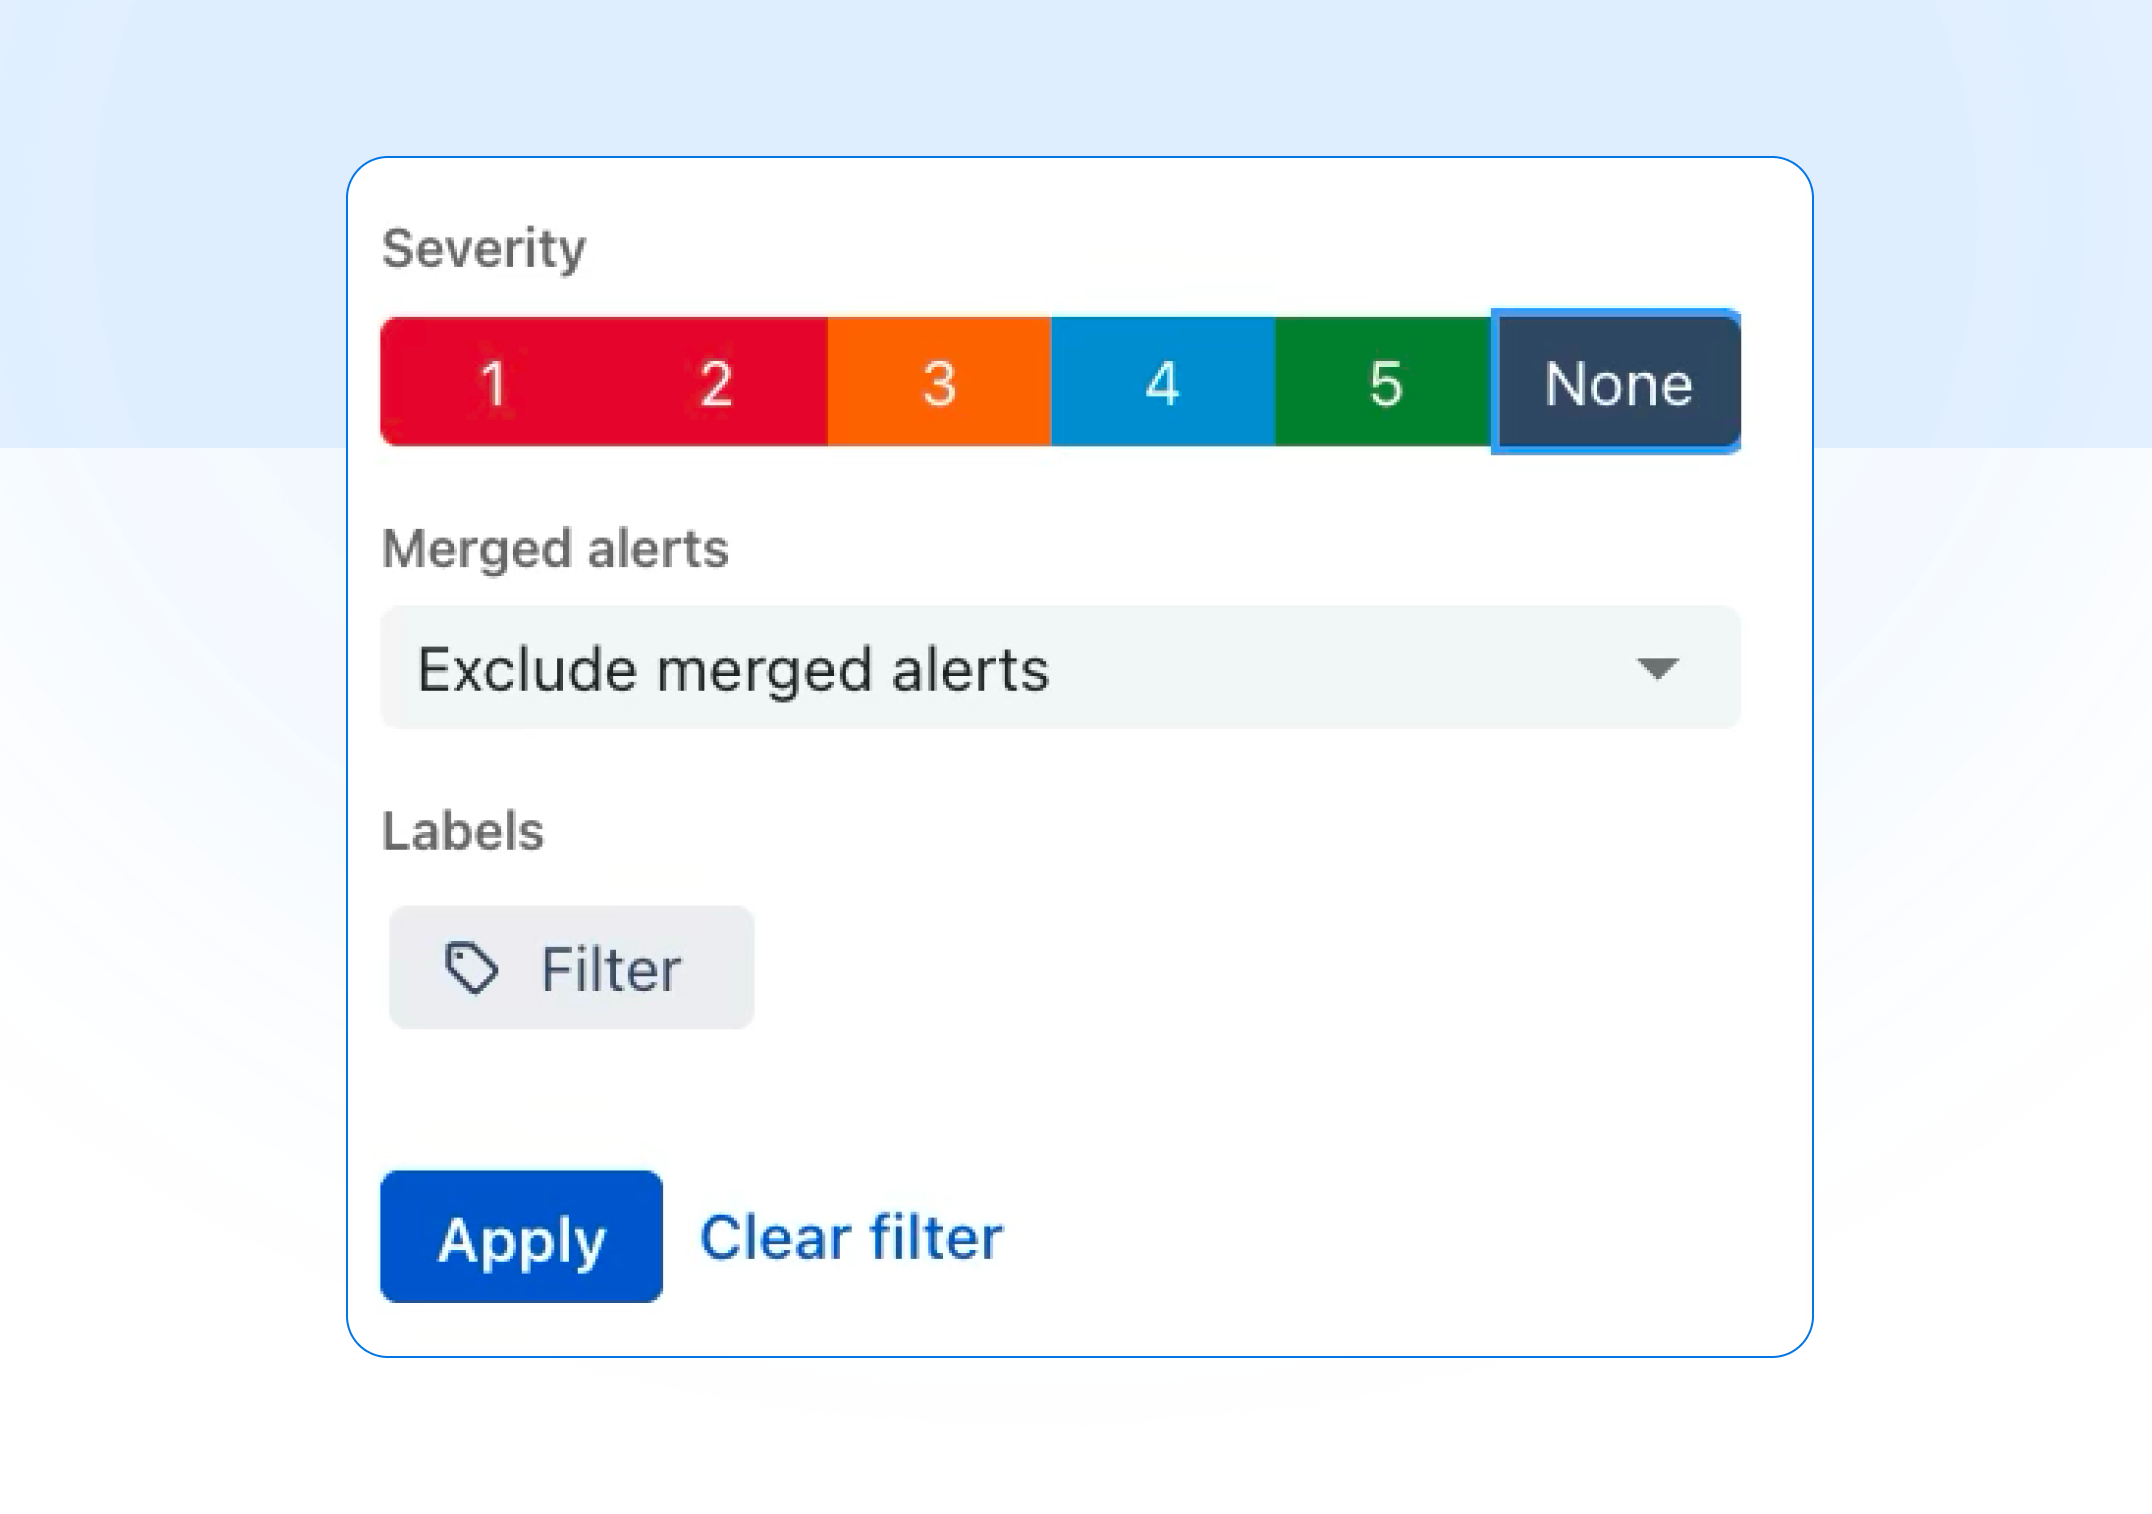
Alert reports now support filtering by severity, so you can analyze your data the way your team triages it. Filter by any combination of levels 1–5 (or "None"), and stack it with existing filters for teams, sources, escalation policies, responders, priority, and labels. Open any alert report parameters and look for the Severity selector under Filters.
Connectivity
Reach tools behind your firewall with the Edge Connector
ilert alerts can now reach tools behind your firewall. The new Edge Connector runs inside your network, pulls events from ilert, and delivers them locally to your on-premise systems, no inbound ports, no firewall changes. Read the Edge Connector docs to get started.
Billing
Self-serve quotes, no email exchange required
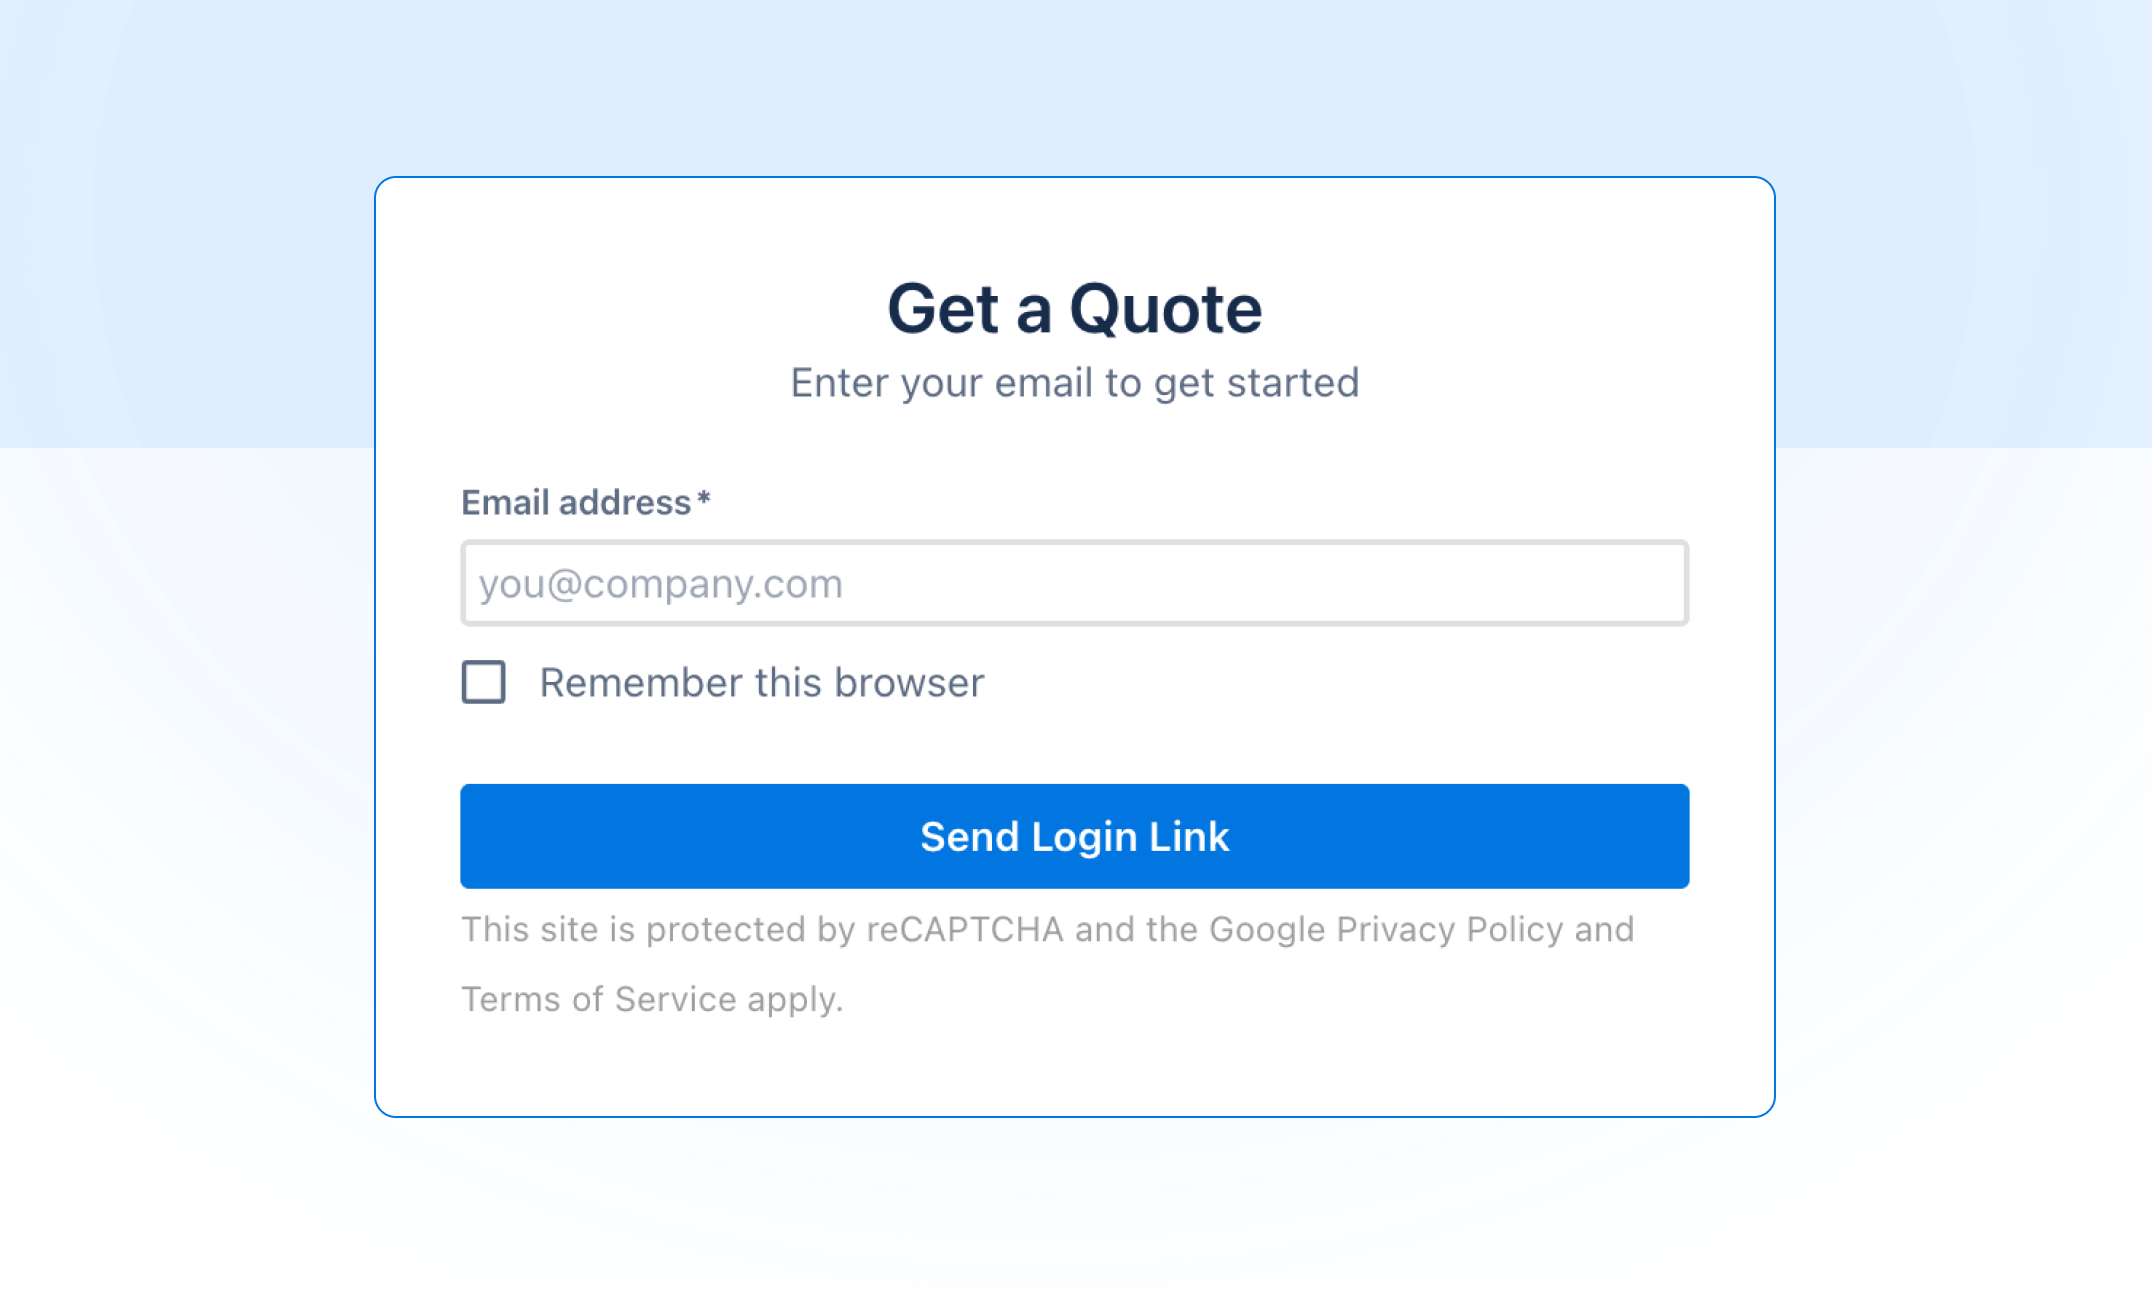
Needing a formal quote for procurement used to mean emailing us and waiting for someone to put one together. Now you can do it yourself. Head to quotes.ilert.com, pick your plan, set your user count and add-ons, choose monthly or yearly, fill in your company details, and you'll get a professionally branded PDF quote in your inbox in seconds, no ilert account required, so you can share the link with whoever owns the buying decision.
When it's time to subscribe, paste the quote ID into the "Have a quote?" field at checkout and your plan, seats, and add-ons are pre-filled exactly as quoted. Enterprise quotes (50+ users) still run through sales@ilert.com so we can tailor terms to your organization.
Marketplace
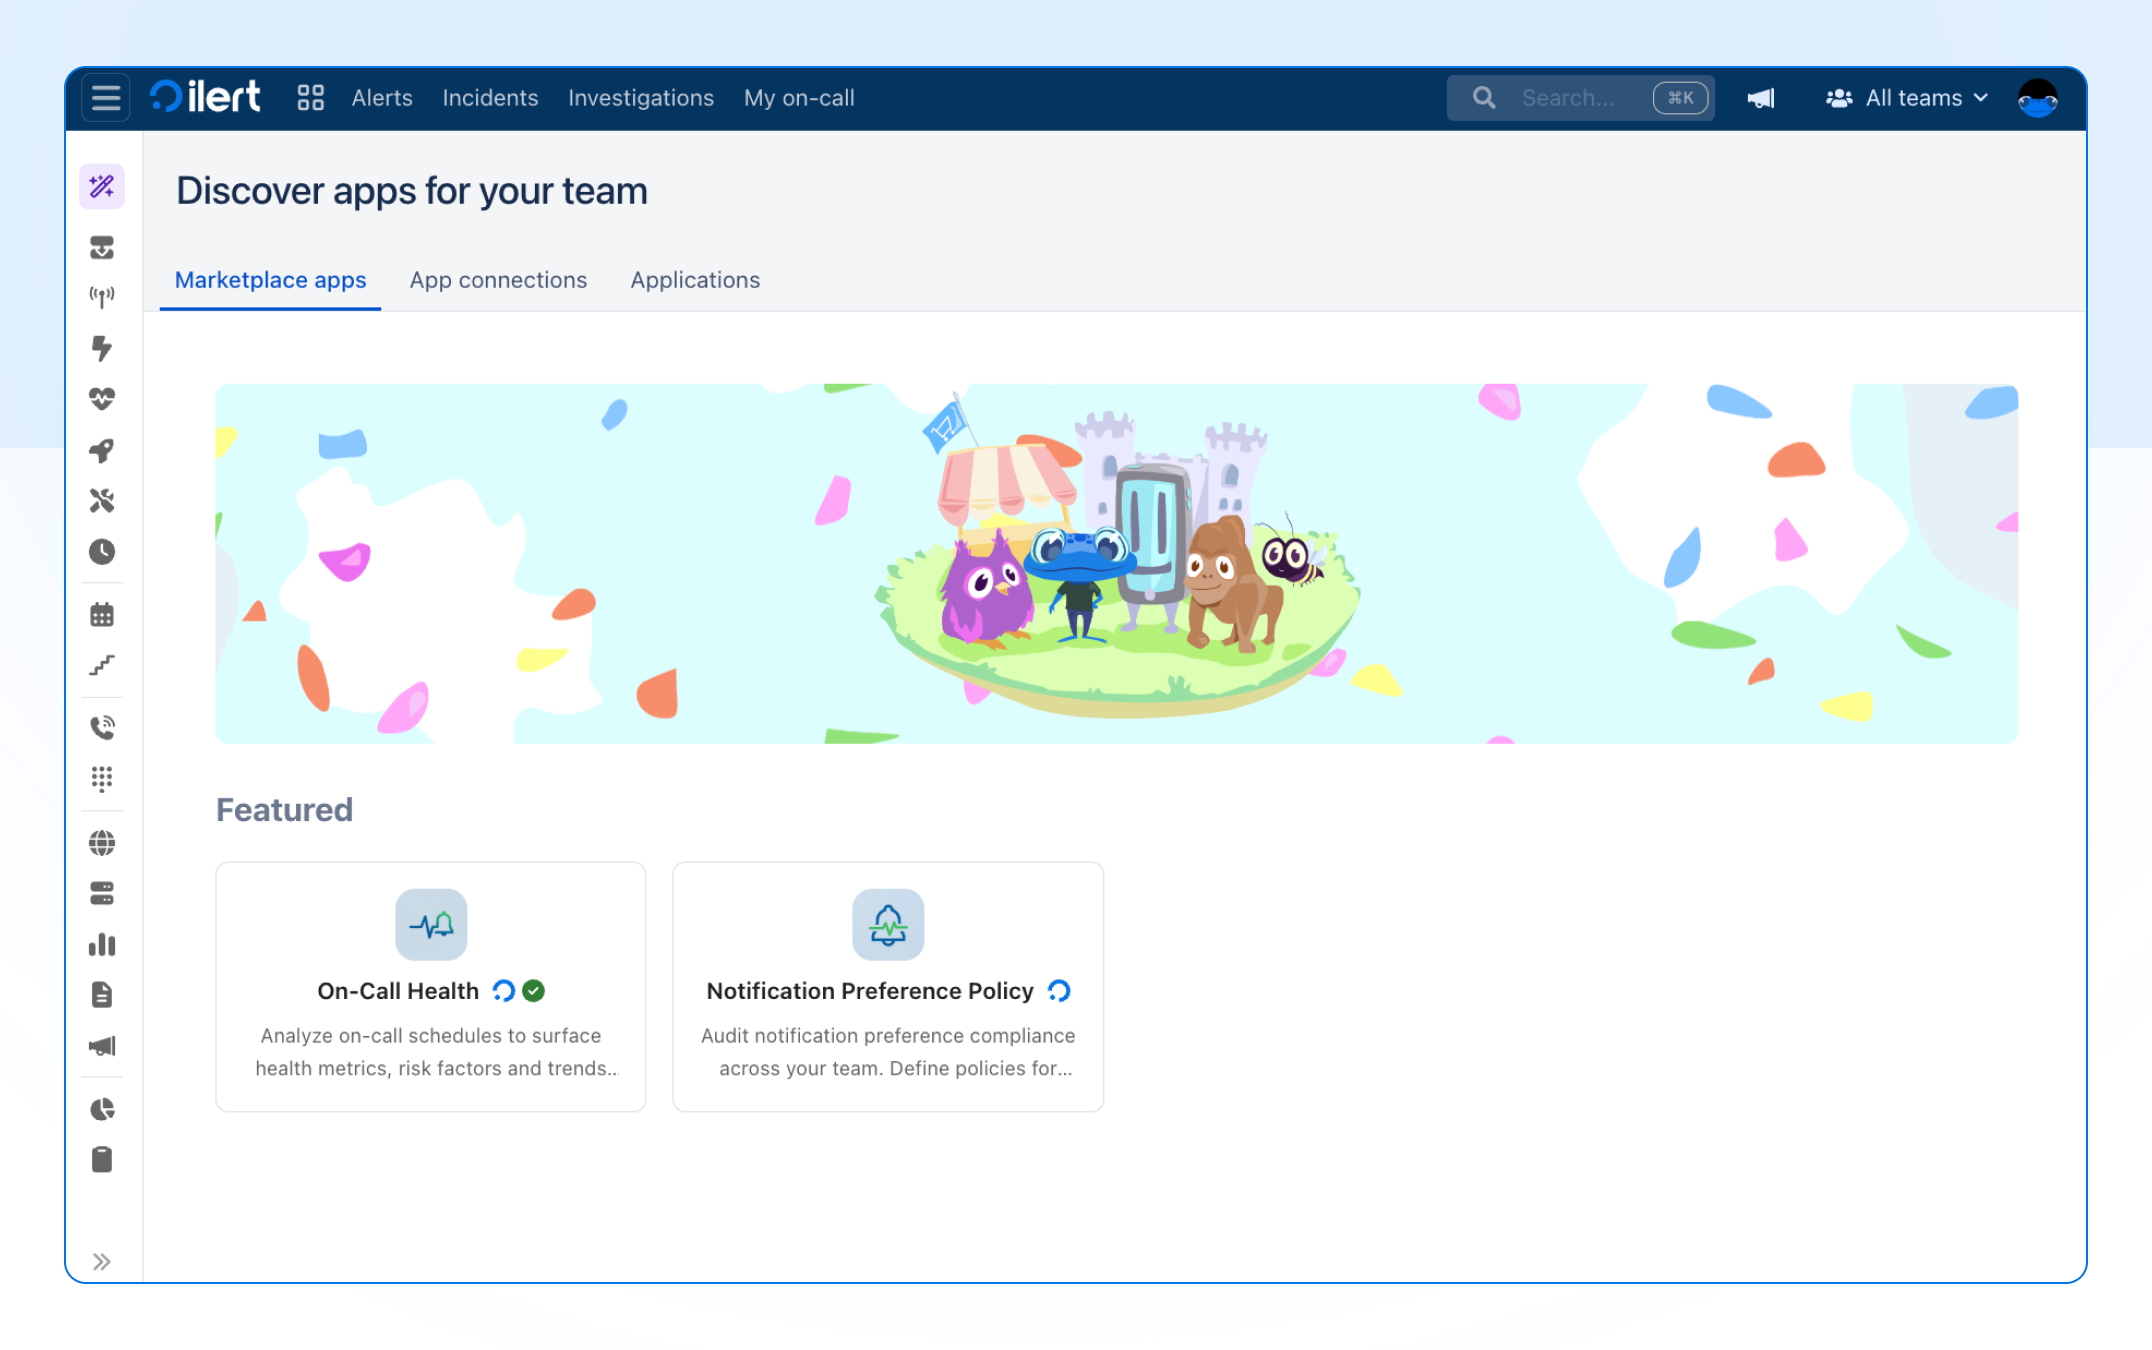
Introducing the ilert Marketplace
The ilert Marketplace is a new home for apps that extend what ilert can do. It launches with two apps built to keep your team covered and healthy.
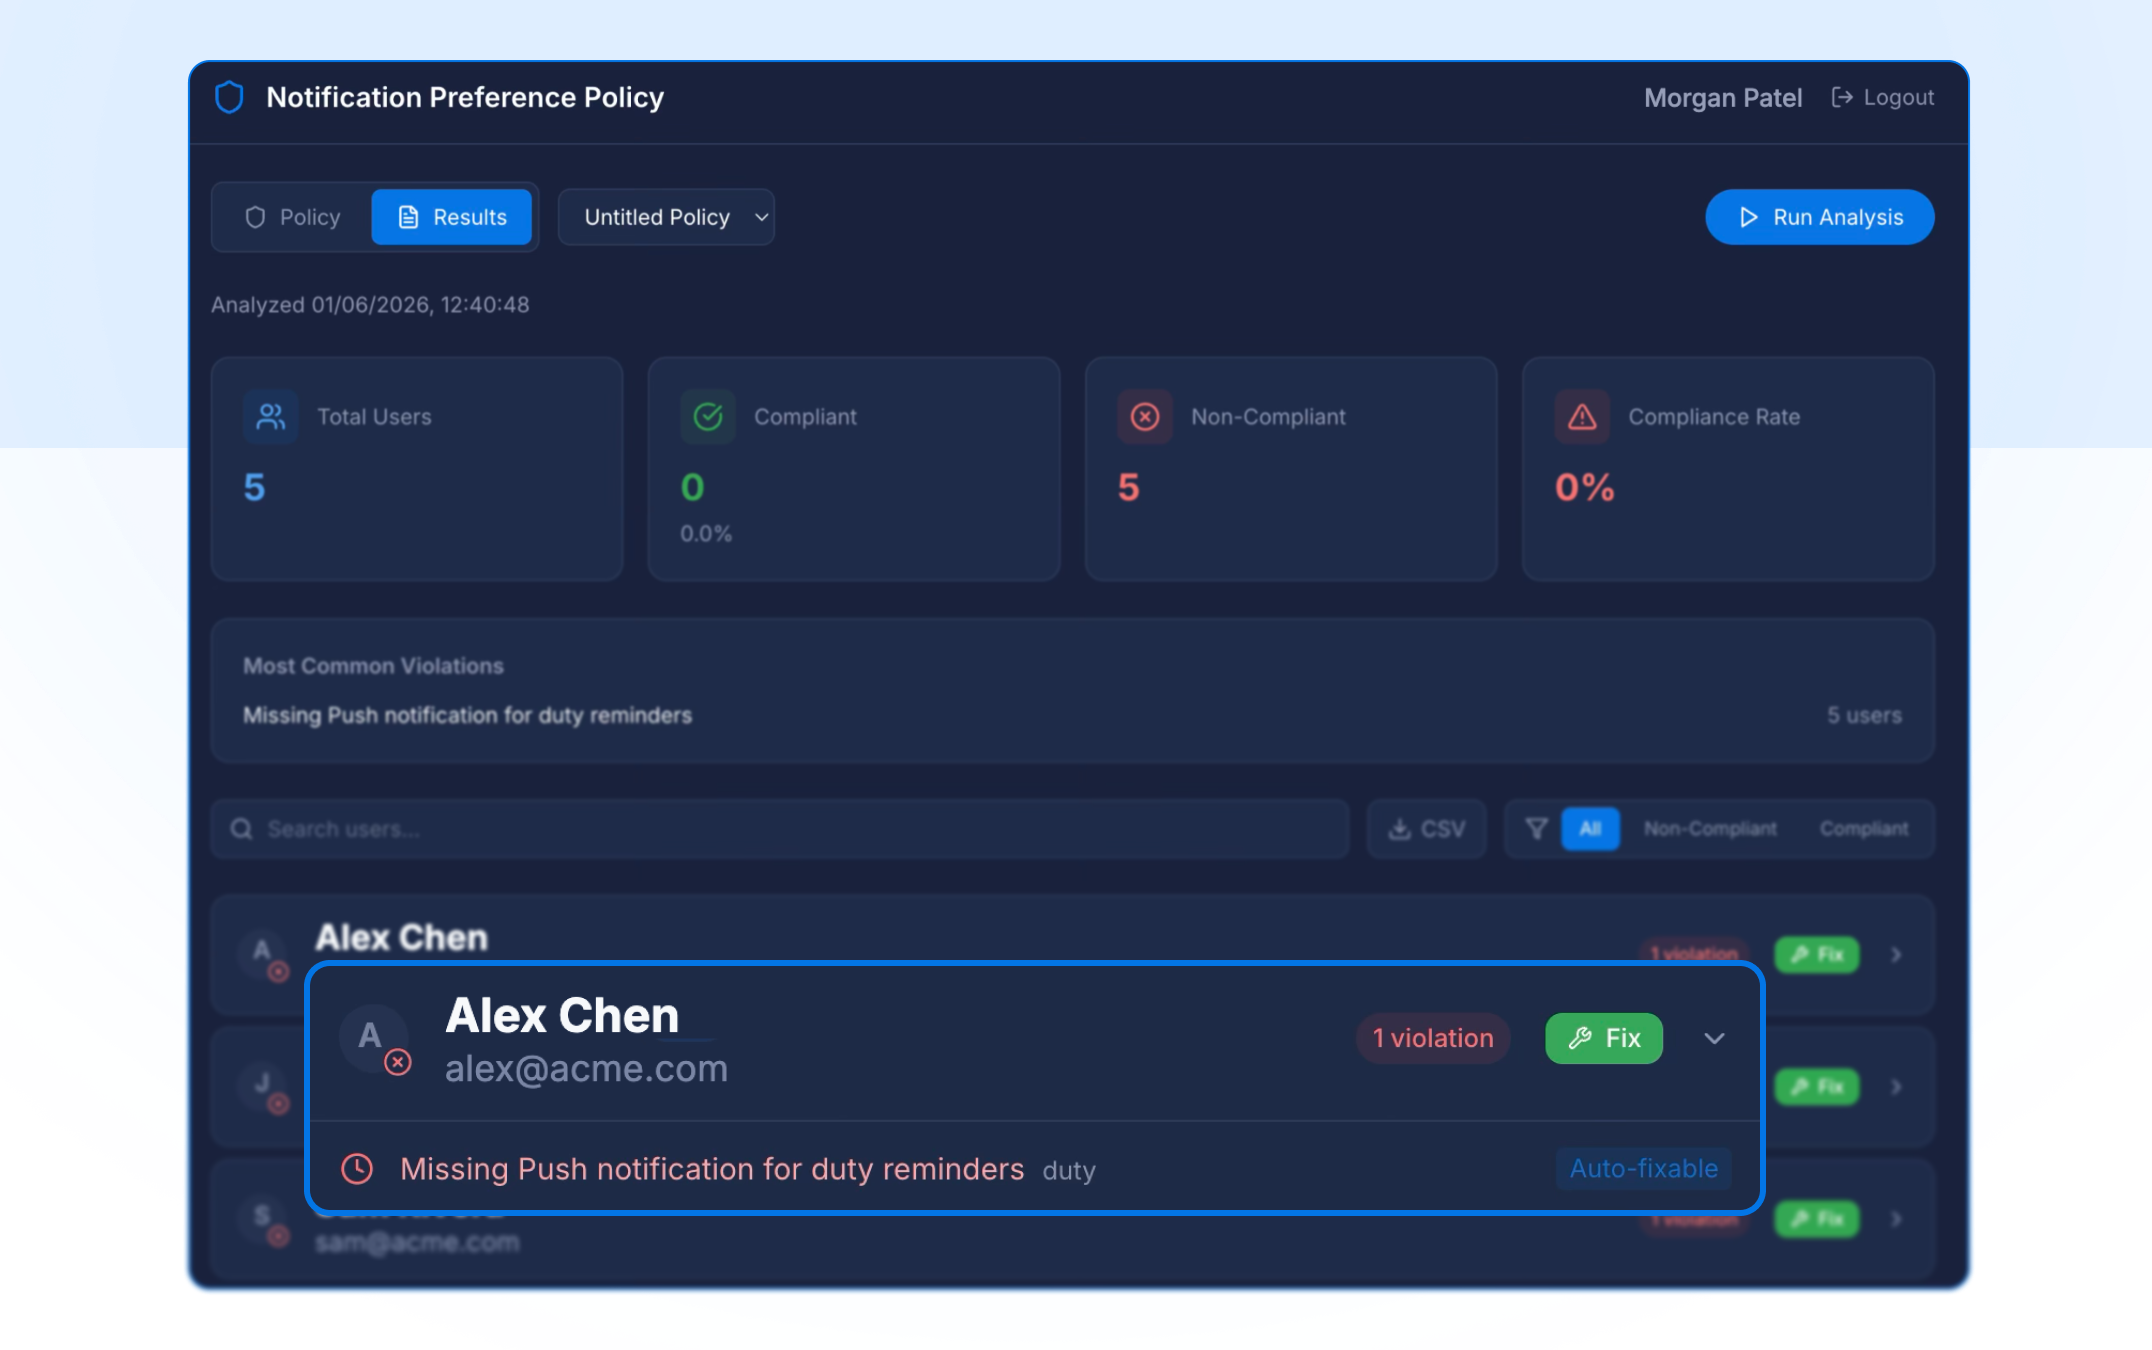
Notification Preference Policy
Notification Preference Policy lets you audit notification compliance across your team. Define the policies that matter: required channels, escalation delays, then instantly highlight any users whose preferences don't meet your coverage requirements. When gaps appear, auto-fix brings them into line in a click, so no critical alert slips through because someone wasn't set up correctly.
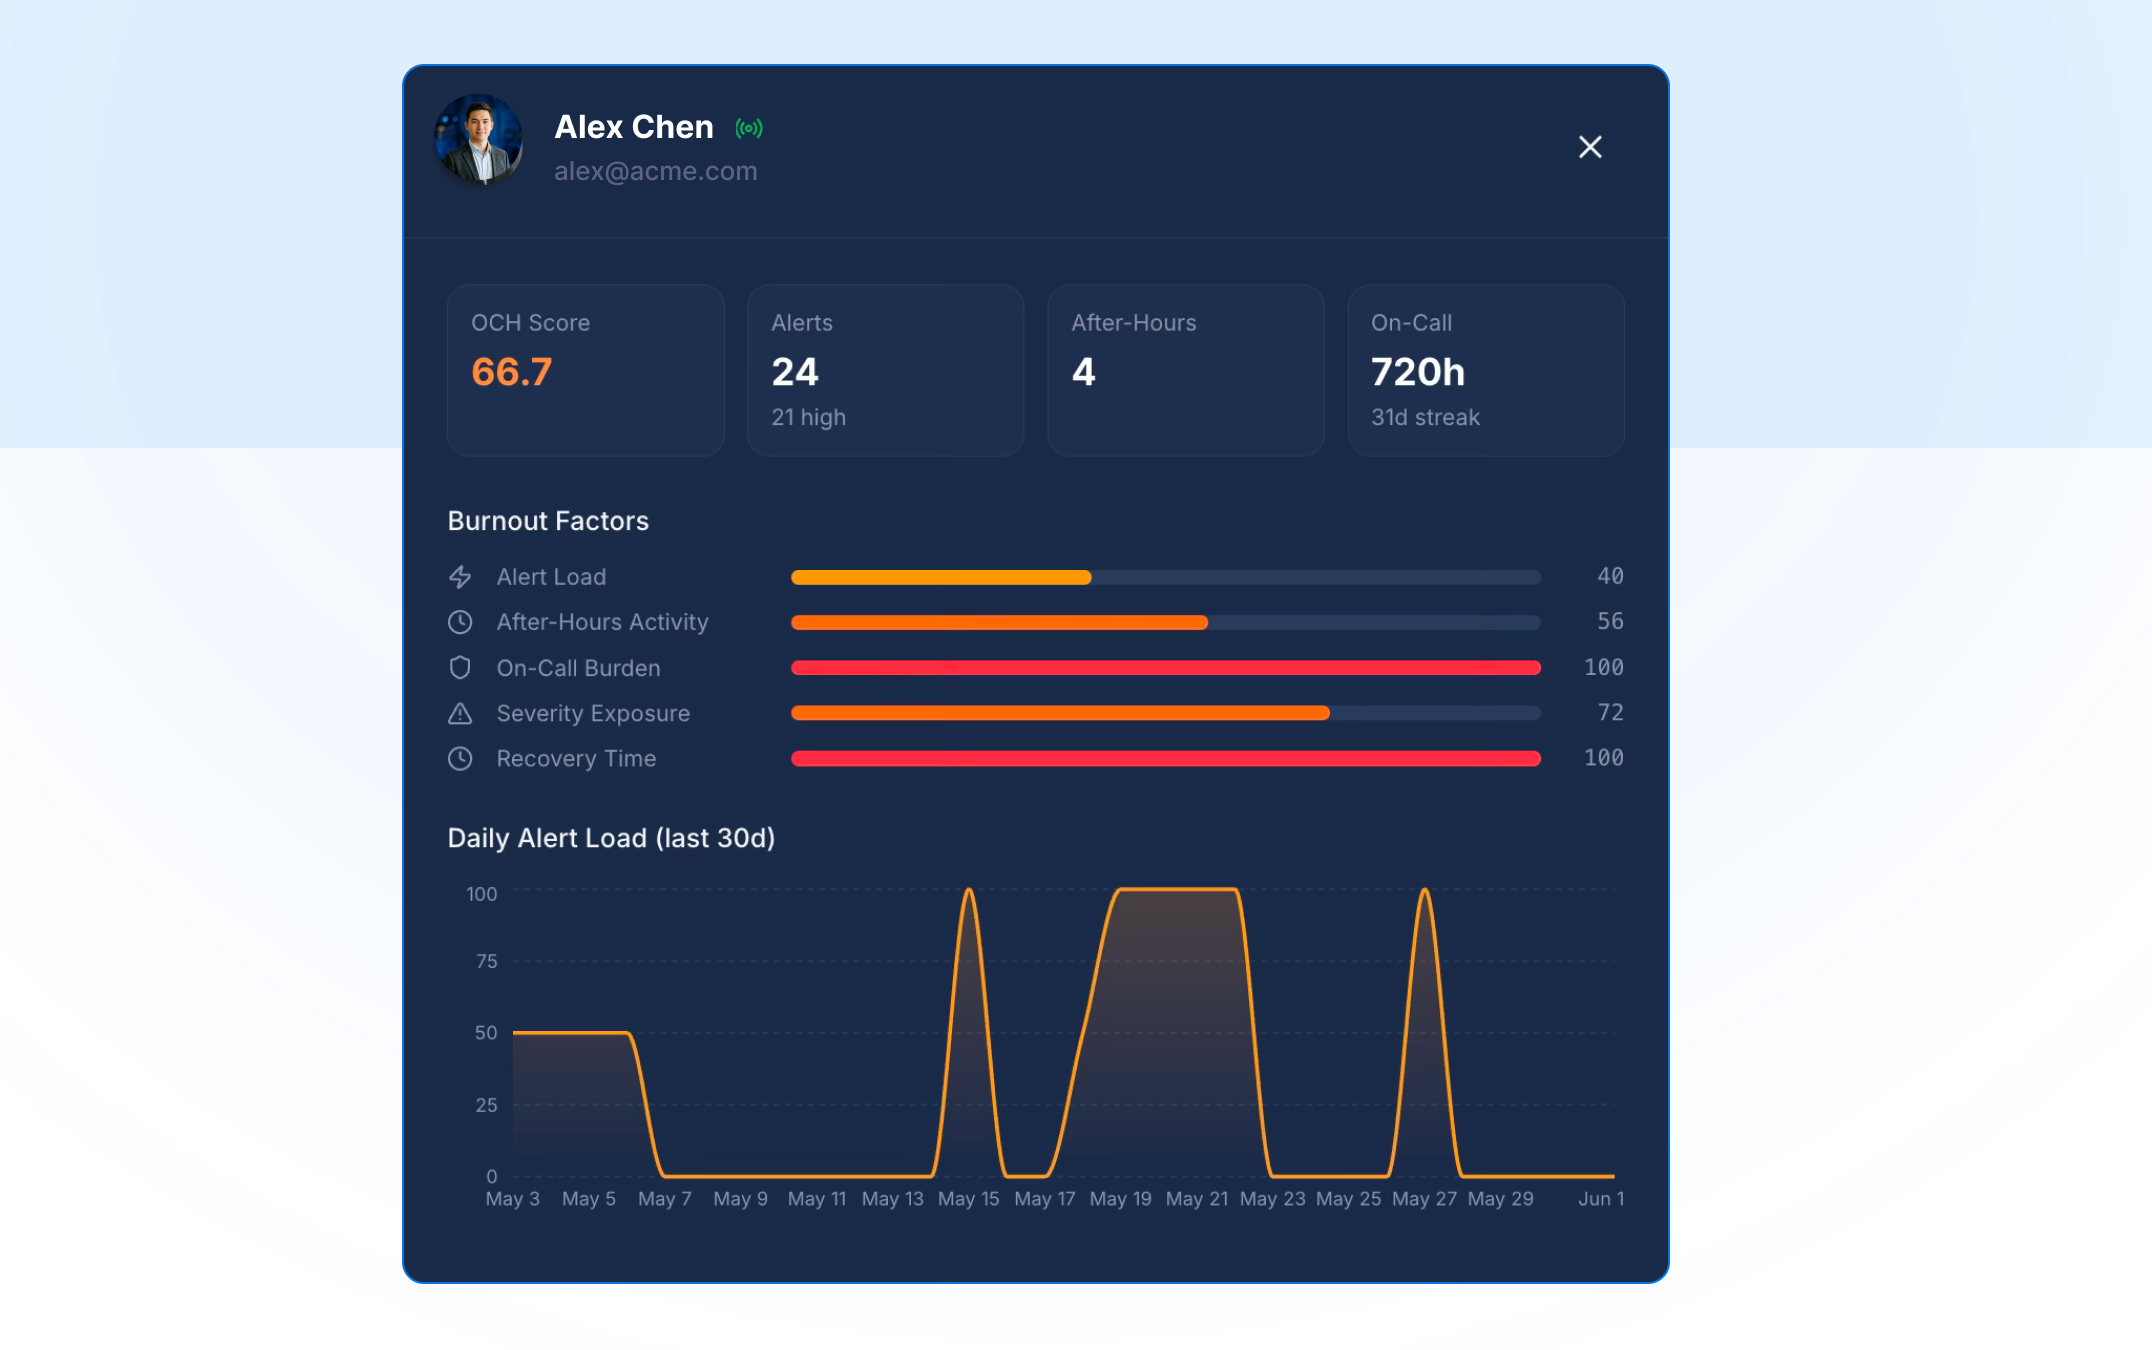
On-call Health
On-call Health turns your scheduling data into insight. Analyze on-call schedules to surface health metrics, risk factors, and trends across your teams, spot burnout before it takes hold, and make data-driven decisions that improve on-call quality. It also factors in legal limits by country, so your rotations stay compliant with regional working-time regulations wherever your team is based.
Both apps are available now. Find the Marketplace under your profile menu.
New Integrations
Uptime: Uptime is a cloud-based website monitoring platform that checks the availability, performance, and functionality of websites, APIs, and services from 80+ global monitoring locations, with checks running as frequently as every 30 seconds.
Wazuh: Wazuh is an open-source security platform from the US, it unifies XDR and SIEM capabilities to protect workloads across on-premises, virtualized, containerized, and cloud environments.
Sekoia: Sekoia is the European cybersecurity company building the Cyber Operations Platform for the AI era. Unifying threat detection and response, cyber threat intelligence, exposure management, and agentic AI, Sekoia is rebuilding cybersecurity from the ground up.