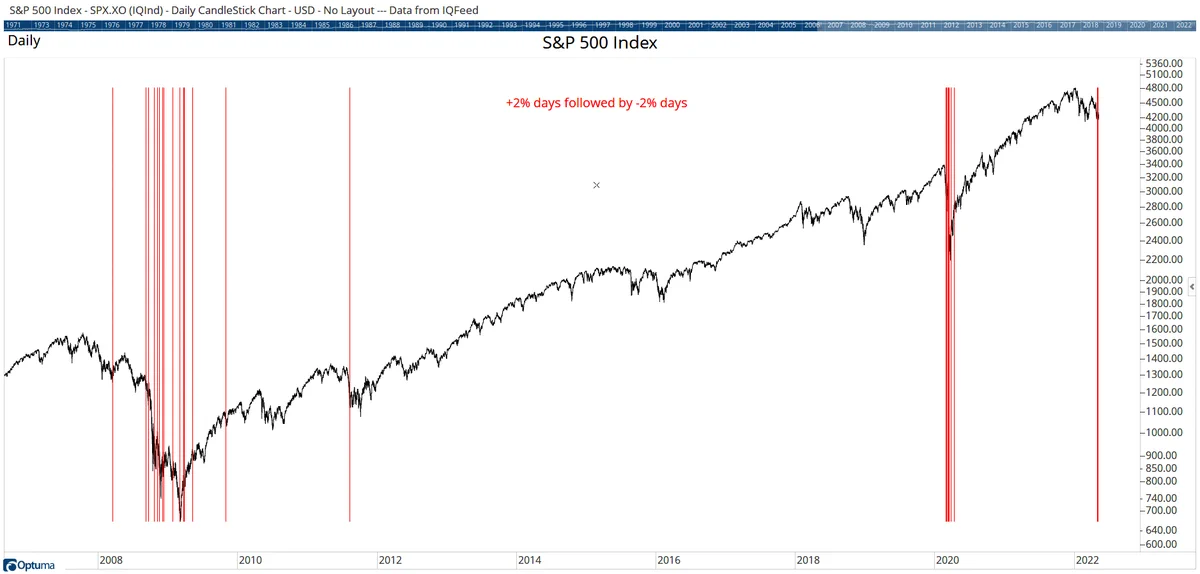
Even though $SPX was down 2% today 165 stocks closed higher. This is by far the most number of advancing stocks on -2% days over the last 10 years (the next highest was 101 at the March 2020 Covid low):
Our mean reversal signal is based on Market Profile and extreme movements from the Point of Control. Yesterday $SPX hit a signal for the 46th time in the last 10 years. On avg the index is 2% higher 1 month after each signal, with a 75% probability of gain:
$QQQ down 6 days in a row but only down -3%. It's only happened 21 times before, and on avg will fall another 1,7% over the next few weeks. It takes 80 days to regain the 3%:
$TSLA is down 5 straight days now with an 11 RSI read. It triggered a mean reversion signal today. Let's see how that plays out by next week.
$SPX$QQQ$SPY@Optuma
It looks like this will be only the 22nd negative April (vs 53 positive) for $SPX since 1950. Here's how the index has played out the rest of the year following a down April:
Going into the final day of January the $SPX is +3% on the month. When January is positive the index ends the year higher 86% of the time, with an avg gain of 12.2% from the end of Jan:
70% of $SPX stocks closed higher today - and 82% performed better than the index. The index closed down 89 points (-1.46%), so without $NVDA (contribution -70 points) & $AVGO (-23) the index would have closed higher:
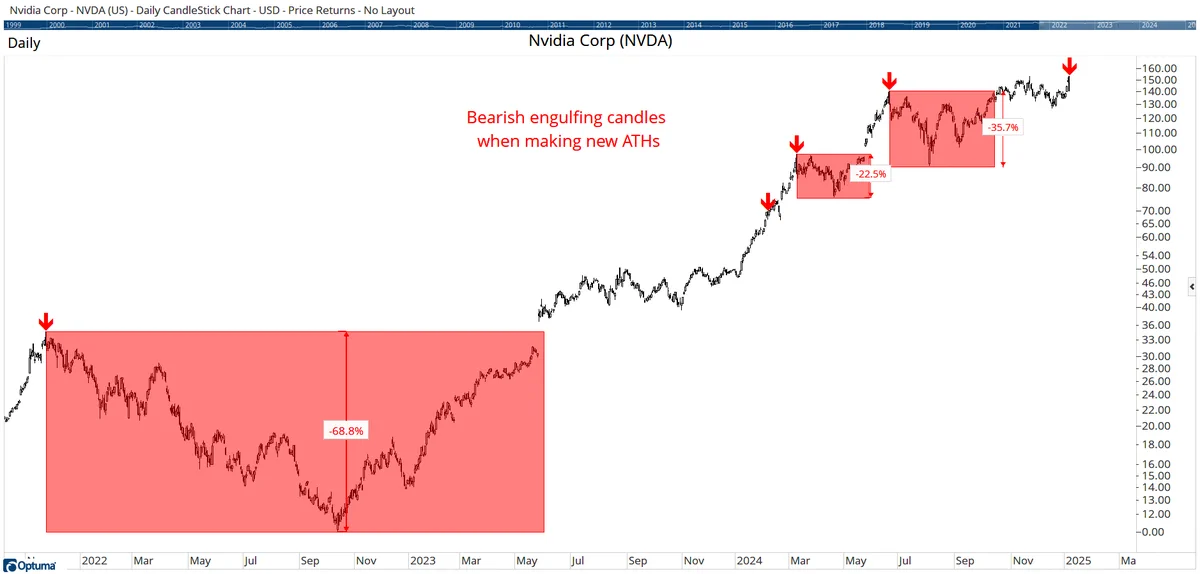
$NVDA made an intraday ATH today but closed -6.2%. 3 of the last 4 times when a bearish engulfing candle occurred at an ATH led to significant pullbacks (-69% in Nov 2021, -22% March 2024, & -36% June 2024).
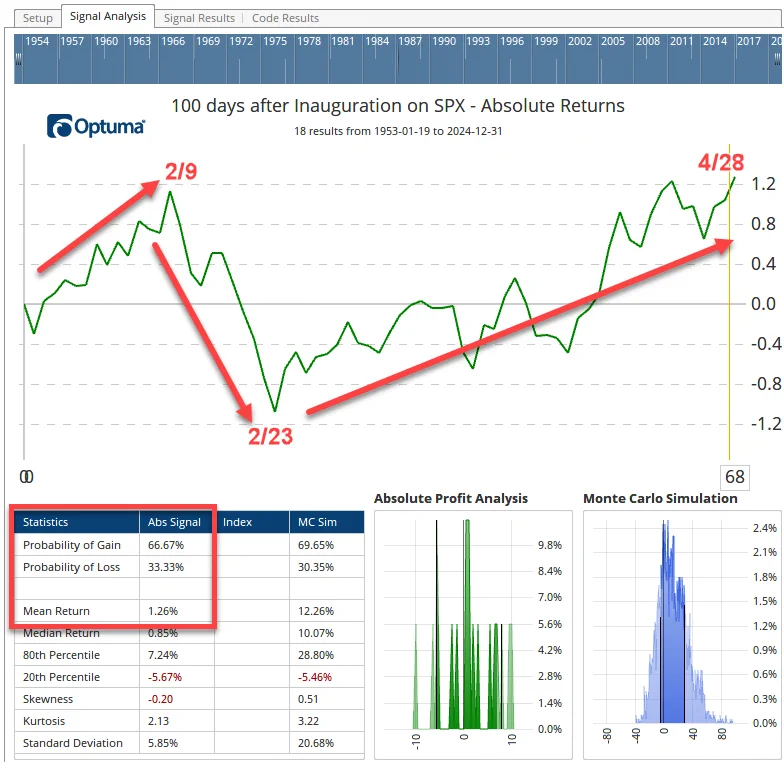
There's a 67% probability of gain 100 days after Jan 20th (approx 68 trading days) with avg return of 1.26%. There's a dip 2nd half of Feb before recovering into end of April: