1. X
  2. Optuma
Log inSign up
Optuma
4,664 posts
Image
user avatar
Optuma
@Optuma
Empowering Traders, Analysts, and Portfolio Managers to discover unique market opportunities with powerful software and valuable education.
Brisbane, Australia
optuma.com
Joined May 2009
460
Following
10.3K
Followers
RepliesRepliesMediaMedia

New to X?

Sign up now to get your own personalized timeline!

Create account

By signing up, you agree to the Terms of Service and Privacy Policy, including Cookie Use.

Terms·Privacy·Cookies·Accessibility·Ads Info·© 2026 X Corp.
Don't miss what's happening
People on X are the first to know.
Log inSign up
  • Pinned
    user avatar
    Optuma
    @Optuma
    Oct 9, 2023
    To request a free demo of our advanced charting and analysis software see here:
    optuma.com
    Your Free Trial of Optuma's Financial Analysis Software
    Unlock the full potential of technical analysis with Optuma's intuitive software. Start your free trial and access advanced charts, tools, and alerts.
    25K025K
  • user avatar
    Optuma
    @Optuma
    Jul 24, 2024
    Even though $SPX was down 2% today 165 stocks closed higher. This is by far the most number of advancing stocks on -2% days over the last 10 years (the next highest was 101 at the March 2020 Covid low):
    Image
    67K067K
  • user avatar
    Optuma
    @Optuma
    May 5, 2022
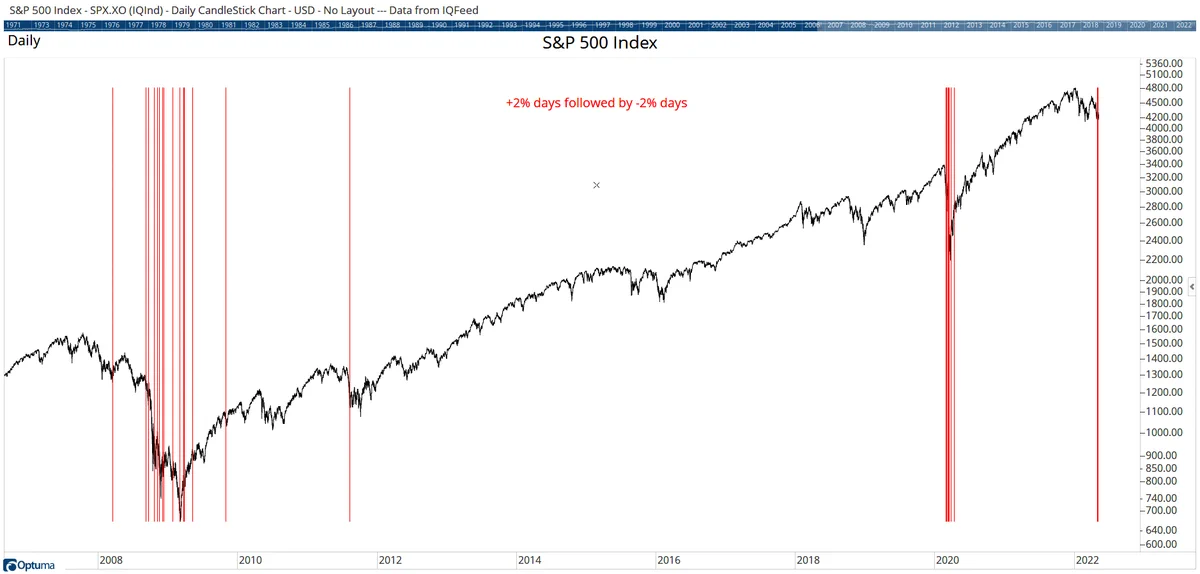
    2nd time in a week that $SPX has a +2% day followed by -2% day. Previous clusters on the way to lows in 2008/9 and 2020:
    Image
  • user avatar
    Optuma
    @Optuma
    Feb 28, 2025
    Our mean reversal signal is based on Market Profile and extreme movements from the Point of Control. Yesterday $SPX hit a signal for the 46th time in the last 10 years. On avg the index is 2% higher 1 month after each signal, with a 75% probability of gain:
    Image
    Image
    12K012K
  • user avatar
    Optuma
    @Optuma
    Dec 5, 2018
    Yesterday's 3% drop in $SPX took out the 20, 50 and 200 moving averages in one day. Only 6 previous occurrences, and not a good sign:
    Image
  • user avatar
    Optuma
    @Optuma
    Aug 21, 2025
    $QQQ down 6 days in a row but only down -3%. It's only happened 21 times before, and on avg will fall another 1,7% over the next few weeks. It takes 80 days to regain the 3%:
    Image
    16K016K
  • user avatar
    Optuma
    @Optuma
    Feb 26, 2025
    17th time $TSLA has been down 5 days in a row with RSI(5)<15. Avg gain over next 5 days 7.7% (81% probability of gain) before tailing off:
    Image
    Image
    user avatar
    Mo
    @optionflys
    Feb 26, 2025
    $TSLA is down 5 straight days now with an 11 RSI read. It triggered a mean reversion signal today. Let's see how that plays out by next week. $SPX $QQQ $SPY @Optuma
    20K020K
  • user avatar
    Optuma
    @Optuma
    Apr 29, 2024
    It looks like this will be only the 22nd negative April (vs 53 positive) for $SPX since 1950. Here's how the index has played out the rest of the year following a down April:
    Image
    17K017K
  • user avatar
    Optuma
    @Optuma
    Apr 4, 2025
    Back-to-back -4% days for $SPX for only the 5th time in history (twice in Nov 2008):
    Image
    29K029K
  • user avatar
    Optuma
    @Optuma
    Jan 31, 2025
    Going into the final day of January the $SPX is +3% on the month. When January is positive the index ends the year higher 86% of the time, with an avg gain of 12.2% from the end of Jan:
    Image
    14K014K
  • user avatar
    Optuma
    @Optuma
    Jan 27, 2025
    70% of $SPX stocks closed higher today - and 82% performed better than the index. The index closed down 89 points (-1.46%), so without $NVDA (contribution -70 points) & $AVGO (-23) the index would have closed higher:
    Image
    41K041K
  • user avatar
    Optuma
    @Optuma
    Aug 10, 2022
    $VIX < 20 for 1st time since April 24th. Has now been < 30 for 36 days - longest streak of the year:
    Image
  • user avatar
    Optuma
    @Optuma
    Jan 7, 2025
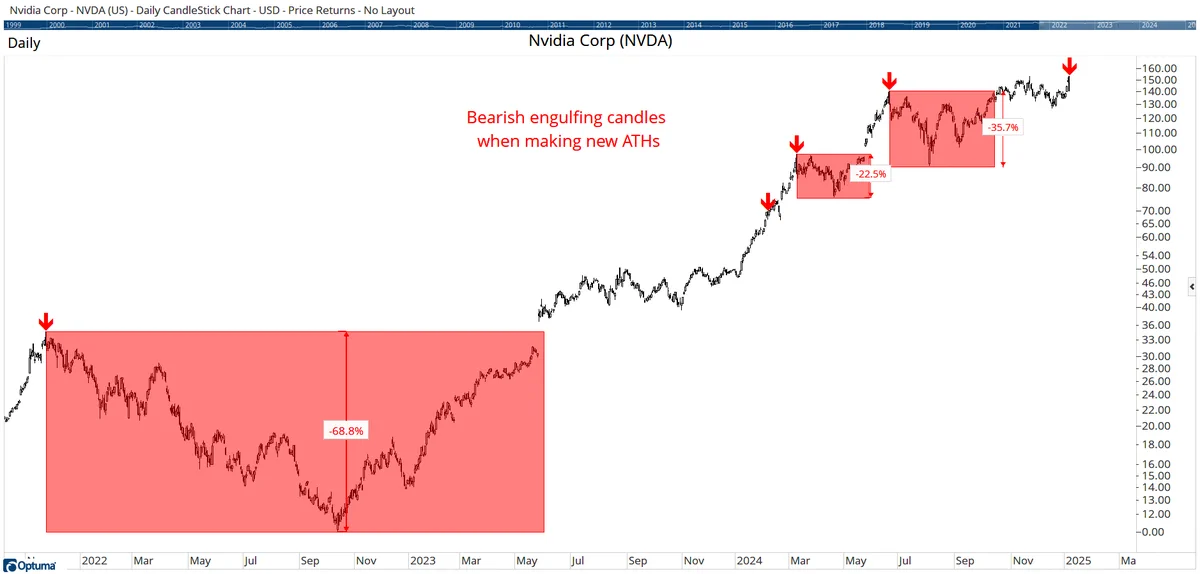
    $NVDA made an intraday ATH today but closed -6.2%. 3 of the last 4 times when a bearish engulfing candle occurred at an ATH led to significant pullbacks (-69% in Nov 2021, -22% March 2024, & -36% June 2024).
    Image
    12K012K
  • user avatar
    Optuma
    @Optuma
    Feb 7, 2025
    Replying to @optionflys and @AAIISentiment
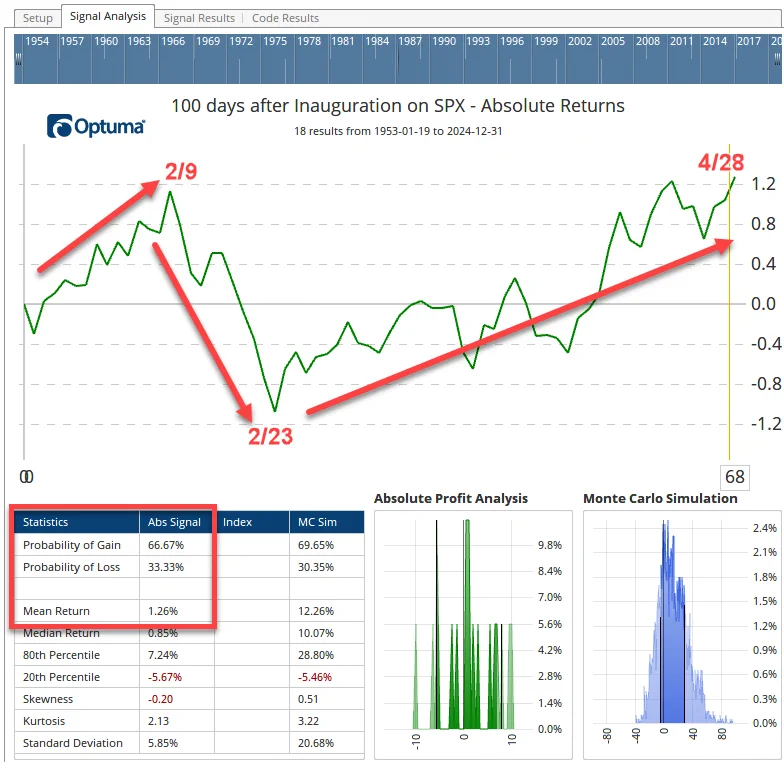
    There's a 67% probability of gain 100 days after Jan 20th (approx 68 trading days) with avg return of 1.26%. There's a dip 2nd half of Feb before recovering into end of April:
    Image
    14K014K
Advertisement
Advertisement