1. X
  2. Zip
Log inSign up
Zip
5,325 posts
Image
user avatar
Zip
@zip_ck
• Financial markets through the lens of math & geometry • Objective chart analysis • No noise • NFA
Global Markets
linktr.ee/zip_ck?utm_sou…
Joined January 2025
98
Following
2,553
Followers
RepliesRepliesMediaMedia

Log in or sign up for X

See what’s happening and join the conversation

Continue with phone
or
Log in with username or email
Terms·Privacy·Cookies·Accessibility·Ads Info·© 2026 X Corp.
  • Pinned
    user avatar
    Zip
    @zip_ck
    Jun 13
    Bitcoin (BTC) | DCA My approach to this matter has remained unchanged since February. In the 58-39k zone, there are two main support areas: 1: 57.7-52k - 61.8% Fib and FE100 2: 45-39k - Gartley harmonic pattern At what price levels are you buying BTC ?
    Image
    Image
    Image
    user avatar
    Zip
    @zip_ck
    Feb 14
    Where to really buy $BTC before the next bull run ? My DCA zone: 39-58 k Why here: - 61.8% Fib of the entire move from 2012 - 61.8-78.6% Fib of the last impulse This is my mathematics + patience. Where do You plan to buy ? Higher, lower ? #Bitcoin #BTC #Crypto
    14K
  • user avatar
    Zip
    @zip_ck
    1h
    US session should set the tone for BTC
    300
  • user avatar
    Zip
    @zip_ck
    6h
    Bitcoin (BTC) – The current situation looks as follows: the price is currently defending the first support from D1 (look at the previous analysis). Meanwhile, the resistance on the LTF is the 1:1 correction, which the price respected yesterday. I will update after one of these
    Image
    Image
    user avatar
    Zip
    @zip_ck
    Jul 27
    Bitcoin (BTC) – Two levels from H4/D1 where demand should appear if the bulls want to maintain control and go higher are: 1: 63400 – DiNapoli levels 2: 61200 – 61.8% of the entire upward wave Watch whether the bulls find support at one of these two levels.
    581
  • user avatar
    Zip
    @zip_ck
    Jul 29
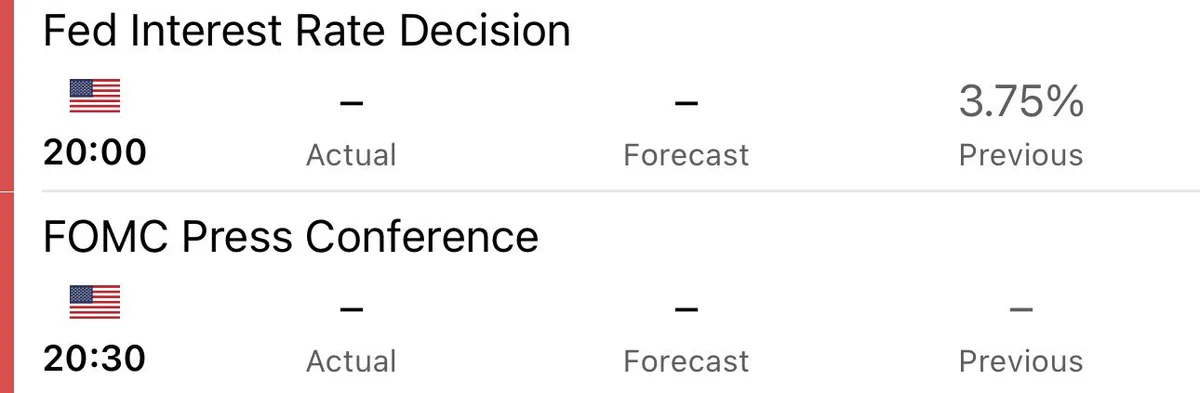
    Fed Interest Rate Decision & FOMC today – be careful.
    Image
    786
  • user avatar
    Zip
    @zip_ck
    Jul 29
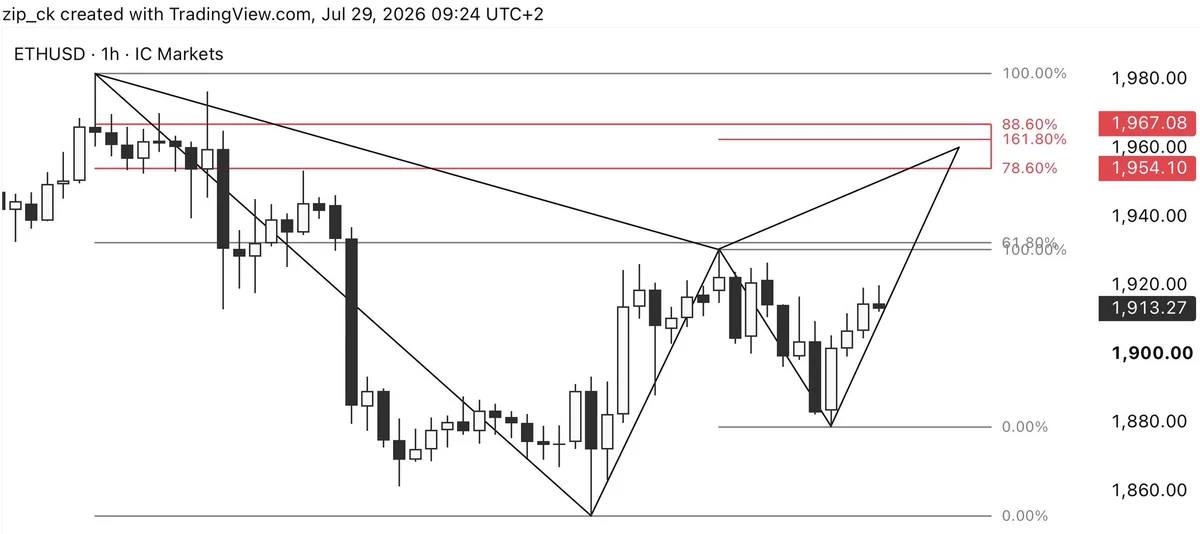
    Ethereum (ETH) - If the market goes up, keep the bearish Gartley on H1 in mind. Point D of this pattern falls in the 1954-1967 zone. The classic harmonic Gartley pattern has its point D at the 78.6% Fib, but it sometimes likes to overshoot that level up to the 88.6% Fib, so the
    Image
    766
  • See @zip_ck's full profile

    Sign up
    Log in
Advertisement
Advertisement