The Problem with Greenland
By Angie Cope
Most people are familiar with Greenland as seen on a map using the Mercator projection and that’s a problem. Of course, Greenland is large, but the Mercator projection exaggerates landmasses near the poles, making Greenland look comparable to Africa when it’s actually much smaller.
Projection is the mathematical method to display the surface of a round sphere on a flat 2D surface.

These two maps below use the Polar Stereographic Projection to more accurately demonstrate the relative size of Greenland compared to the rest of the world.


Greenland is the world’s largest island, covering about 836,000 square miles (2.17 million sq km), making it larger than France, Germany, Spain, and the UK combined, but it appears much bigger on standard Mercator projection maps due to distortion. It’s roughly three times the size of Texas, with about 80% of the island covered by a massive ice cap.
Problem solved?
Nixon’s Chicago Loop Parade 1972
Curtis Wright Maps recently gifted this broadside to the AGSL showing President Nixon’s re-election event scheduled for October 30, 1972.
Richard Nixon and his wife Pat planned a re-election visit to the windy city that included bands, entertainment and a parade. An inset map on this broadside shows the route for the motorcade on La Salle Street.

However, a day before the event was scheduled to take place, a morning rush hour commuter train crash killed 44 people and left 332 injured. Nixon cancelled the event and sent his Secretary of Transportation John A. Volpe to Chicago to guide relief efforts.

A Window to the Stars: The Story of Milwaukee’s Historic Alvan Clark Telescope
by Angie Cope
In the late 19th century, Judge Hiram Barber of Horicon, Wisconsin, made a gift that would inspire generations of students and stargazers in Milwaukee. In 1875, he presented Milwaukee College (later Milwaukee-Downer College) with a refracting telescope crafted by the renowned firm of Alvan Clark & Sons of Cambridge, Massachusetts. 1876 was the Centennial celebration of the Declaration of Independence of the United States and the telescope may have been a gift commemorating that event.
Building an Observatory for Learning
With Barber’s donation, the college received its first serious astronomical equipment. The telescope was described as “of such power and accuracy as meets the practical present needs of our students of astronomy, and furnishes a nucleus for a fully equipped observatory.” Thanks to additional funding from William P. McLaren, an observatory was constructed at the southeast corner of Merrill Hall. Originally standing 34 feet tall with a revolving dome, the observatory was raised to 48 feet in 1879 to improve viewing conditions. The telescope was accessed using a wooden staircase, surrounded by wooden bleachers.
If images don’t display, click caption to load. Thanks.
.jpg)
Each week, Milwaukee-Downer College opened its observatory to the public. Students and community members gathered to observe the stars, in what Professor Frederick Olson later described as an early form of adult education and community outreach. Special events—like the appearance of Halley’s Comet in 1910—were occasions for crowds to marvel at the universe through the lens of the Clark telescope.
Student Life and Stargazing Traditions
.jpg)
Astronomy was not confined to the observatory. In 1934, students recalled lugging mattresses onto the roof of Sabin Hall to spend the night under the stars. Professor Ethelwynn R. Beckwith led these sessions, encouraging students to witness the “large and constant change in the star picture” over the course of a single night. Beckwith also announced celestial events, turning them into shared experiences for both students, faculty and the community.
From Downer to UWM
The Milwaukee-Downer College became the University of Wisconsin–Milwaukee (UWM) and the telescope’s fate was uncertain. Professor Michael Shurman, chair of the Physics Department, accompanied Dean Baier on an inspection of the old observatory. The dome had deteriorated so badly that, according to legend, Baier’s foot went through the wooden floor. Recognizing the telescope’s value, Shurman salvaged the parts and transferred them to the physics department.


The American Geographical Society Library (AGSL) was established in Milwaukee in 1978 when the research collections of the American Geographical Society (AGS) moved, and ownership was transferred, to the University of Wisconsin-Milwaukee. Available display space allowed for the transferred on loan of the telescope to the AGSL in 1980.

Another astronomically interesting holding in the AGSL is a copy of the earliest photograph of the moon. The photo was likely taken through a telescope similar to this Alvan Clark telescope by On Professor Henry Draper on September 3, 1863.

This blog was written with the assistance of ChatGPT
Survival, Storytelling, and the Reimagining of History : Marguerite de Roberval
by Angie Cope
Survival stories have long captured the human imagination, and for me, they hold a special appeal by helping me connect story telling with materials from the AGS Library. My interest in survival narratives began about fifteen years ago with Tony Horwitz’s Blue Latitudes, a modern retelling of Captain James Cook’s voyages. Horwitz sailed in a replica of Cook’s ship, the H.M. Endeavour, retracing the explorer’s journeys across the Pacific Ocean and to Australia. By pairing his contemporary experiences with Cook’s own hardships, Horwitz provided a helpful perspective on the AGSL’s holdings—most notably, Cook’s hand-drawn manuscript maps of the southeastern coast of Australia.
Recently, I have been drawn to another survival narrative, Allegra Goodman’s Isola, which is based on the astonishing true story of Marguerite de la Rocque, a French noblewoman marooned in the Gulf of Saint Lawrence in 1542. Marguerite, orphaned but heir to a fortune, was placed under the guardianship of her uncle, Jean-François de Roberval. He squandered Marguerite’s inheritance to such an extent that he could no longer maintain a home for himself and Marguerite in France. After securing funds from the king for an expedition to New France he compelled Marguerite to accompany him. During the voyage, she fell in love with his secretary. Roberval was enraged by the affair and exiled her, along with her lover and her nurse, Damienne, on a desolate island later referred to as the “Isle of Demons.” Marguerite endured more than two and a half years of isolation and privation before she was rescued and returned to France.

The trio was stranded with little more than their personal possession and they faced starvation and endured harsh winters. In less than a year Marguerite suffered the death of her lover, her nurse and a child she gave birth to on the island.
What makes Marguerite’s story particularly remarkable is the way it has been retold and reshaped across centuries. At least three versions circulated before 1600. Marguerite of Navarre, the French king’s sister, included an early version in her Heptameron, a collection of short tales modeled on Boccaccio’s Decameron. However, Marguerite de Navarre likely heard the story from the uncle’s point of view rather than that of Marguerite. Another version of the story was told by François de Belleforest. He was best known for his Histoires tragiques (1572), dramatizations of a tale’s moral and tragic dimensions, presenting Marguerite as an exiled “demoiselle” punished by fate. A later version was by André Thevet who was the cosmographer to the king and who recorded a lengthy essay in his Cosmographie universelle (1575) on Marguerite’s exile. Thevet included an illustration of the island showing Marguerite with a swaddled child resting in the shade of a palm tree. While Thevet’s account carried the authority of his office, it was riddled with inaccuracies. Each of these retellings reflected the concerns of its author—whether moral instruction, entertainment, or cosmographical authority—rather than the lived truth of Marguerite herself. The story later resurfaced in the nineteenth century, during a cultural revival of interest in exiles and castaways, further demonstrating its enduring resonance.


The book I read, Goodman’s Isola, is part of this long tradition of reinterpreting Marguerite de la Rocque’s ordeal. Goodman took what historical fragments are available and translated them into a compelling story. This retelling of a story through fiction serves as a bridge between past and present, breathing new life into obscure chronicles, restores marginalized voices, and reimagines historical experiences in ways that scholarship alone often cannot.
Just as Horwitz reframed Cook’s voyages through his modern writing, Goodman reinterprets Marguerite’s exile in a way that speaks to contemporary readers. In both cases, the past is not a fixed record but a living dialogue between archival evidence, scholarly interpretation, and narrative imagination.
Furhter readings
- Tony Horwitz, Blue Latitudes: Boldly Going Where Captain Cook Has Gone (New York: Henry Holt, 2002).
- Allegra Goodman, Isola (New York: Dial Press, 2025).
- The llegend of Marguerite de Roberval / Arthur P. Stabler (Pullman : Washington State University Pres, 1972).
- Marguerite of Navarre, The Heptameron, trans. P. A. Chilton (Harmondsworth: Penguin, 1984).
- François de Belleforest, Histoires tragiques (Paris: 1572).
- André Thevet, La cosmographie universelle de tout le monde (Paris: 1575).
This article was written with the assistance of ChatGPT
History 400 in the AGSL: Primary Sources & Border Disputes
UWM’s History 400 class was embedded in the AGSL for the Fall 2024 semester. HIST 400: Topics in Latin American and Caribbean History: Digital Humanities, Memory, and Visual Culture used primary sources from the AGSL’s map collection and the archives of the American Geographical Society (AGS) of New York to create online public history projects.
The class topic lends itself well to the AGSL’s holdings, as the AGS produced the Millionth map of Hispanic America, mapping Mexico, Central America, and South America for the larger International Map of the World project.

The class divided into three groups, and each studied a different border dispute from the early 20th century: Honduras, Nicaragua, and Guatemala; Bolivia and Paraguay; and Ecuador and Peru. The class’s work culminated in three StoryMaps about these border disputes.
Statistical Mapping and Redlining: A Milwaukee Case Study
By Jayne Kilander

US Federal Home Loan Bank Board. Map of Milwaukee County, Wisconsin: Residential Security Map, 1938. https://collections.lib.uwm.edu/digital/collection/agdm/id/3028/
In 1938, the Federal Home Loan Bank Board created the above map of Milwaukee County, ranking neighborhoods based on their “indexes of the over-all degrees of risk” (Light, 499) These categories were physical – like the overall quality and condition of buildings – but also social categories, such as the proportion of white residents in a neighborhood (Light, 502). The FHA made these maps for hundreds of cities across the United States, a process now referred to as redlining.
There has been much discussion about the repercussions of these neighborhood assessment maps, from de facto segregation that persists to this day, to other policies like public housing and freeway projects that have had lasting impacts on neighborhoods. The process of statistical mapping was essential to the process of redlining. The resulting map published by the Federal Home Loan Bank Board is an amalgam of other, more specific statistical maps that carved out the racial and class divides in the City of Milwaukee.

Milwaukee Board of Public Land Commissioners. City of Milwaukee Housing Survey, Residential Land Use, 1931. https://collections.lib.uwm.edu/digital/collection/agdm/id/25569/rec/3
This map demonstrates a statistical representation of residential land use in Milwaukee in 1931. The map displays the proportion of homes in different areas of the city based on what types of dwellings there are (single-family buildings, duplex buildings, and apartment buildings), as well as what types of units there are in those buildings. While this data was previously available from earlier US Census studies, the presentation of this data reflects a trend of graphically representing “moral statistics,” or important social values graded on a scale.
Statistical representation on maps made the information more accessible, while also granting a scientific level of legitimacy to the map that would serve as a base to neighborhood assessments. Friendly and Palsky explain how moral statistics are often reflected on a gradient scale, informed by a map from Charles Dupin, one of the first gradient representations of moral statistics in graphic cartographic form. In Dupin’s map, which displayed public education in France, uneducated areas were dark gray or black, while highly educated areas were in a lighter color (Ackerman and Karrow, 241). This association of darker colors with the “morally wrong” appears in this map of residential land use as well: the more valuable, single-family homes that reflected the traditional family model are represented by the white section of pie charts and bar diagrams in the map above, while the less valuable dual family, or stigmatized highly populated apartments are demonstrated by gray and black. This sets up a gradient of value, or pure single-family homes to dirty, dark apartment complexes. The graphic representation of the census and survey data on this base map of Milwaukee reflects a longer legacy of projecting and compartmentalizing social ideals and moral statistics into statistical mapping, demonstrating which land-uses were valuable, and which were undesirable.
Land-use and physical building occupancy were factors in the FHA grading system. Light writes of how Hoyt, one of the directors of risk assessment, describes land-use: “Hoyt instructed insuring officers to outline business, retail, warehouse, and industrial areas on a city base map, followed by residential districts with large apartment buildings and areas with one- and two-family dwellings.” (Light, 499) This was then followed by layering factors of rent and land-value, as well as race and ethnicity. Hoyt’s direction at the beginning of the mapping process highlights just how important the home type was in determining a neighborhood’s ranking, using data like the set displayed in the Milwaukee Residential Land Use Map as a foundation to compare other social factors that might pose a “risk” to the community. This map is just one example in a group of maps called the “City of Milwaukee Housing Survey” that also detailed information like the number of unlit streets, the number of “foreign born whites” in an area, population density, and blighted areas. These maps reflect the preliminary assessments of Milwaukee’s neighborhoods, laid out in an easily digestible, comparable fashion. Compiling and mapping all this data, the FHA, with teams like the one headed by Hoyt, were able to consider different aspects of neighborhoods to determine their “risks” and their benefits that might result in their eventual letter grading.
To see the impact of this map on the eventual FHA rating map, one only has to look on the surface at the color grades and gradient scales. Areas with high proportions of multi-family dwellings, mostly clustered around the first ring outside the center of the city, correlate directly with the same ring of red on the FHA map. Additionally, the lighter pie charts and bar graphics on the outer ring of the city correlate with the lighter green and yellow ratings in the same areas on the FHA map. There are some areas that do not directly align, like the strip of red ratings in the southwest of the city that lies in an area with mostly single-family homes, however this mismatch does not reflect a lack of consideration of the land-use map in planning, rather a cumulative analysis of multiple factors that influenced the FHA ratings. Other factors, like ethnicity or tax-default status, might be higher in those areas. The residential land-use map is just one piece of the puzzle in the final FHA rating map but highlights crucial details about how moral statistics and statistical mapping were used in the process of making such maps, and the social realities of those who lived in graded neighborhoods.
Works Cited:
Light, Jennifer. “Discriminating Appraisals: Cartography, Computation, and Access to Federal Mortgage Insurance in the 1930s.” Technology and Culture 52, no. 3 (2011): 485–522. http://www.jstor.org/stable/23020643.
Akerman, James R., and Robert W. Karrow. Maps : Finding Our Place in the World “Visualizing Nature and Society” / Edited by James R. Akerman and Robert W. Karrow, Jr. Chicago: University of Chicago Press, 2007. 241.
Birds-Eye Views: Cartography From a Different Angle
By Anna Rohl
Birds-eye views (also known as panoramic maps) are cartographic images that depict a place as viewed from above and to the side—as if from the point of view of a high-flying bird! These maps have appealed to Americans for almost two centuries, offering residents and tourists alike a unique and visually-appealing way to view their cities and landmarks.
In the US, birds-eye views were first commercially produced in the 1830s and would become what historian John R. Reps calls a “mania” by the 1880s (Reps, 7). Most panoramic maps made during this time were created by itinerant artists who funded their creations with subscriptions. The artist would advertise their project in the local paper, display their initial sketches of the city’s streets and buildings to drum up interest, and perhaps recruit local businesses to advertise around the edges of the finished image. When enough subscriptions and advertisers were lined up, the artists’ drawings would be printed as lithographs (an intaglio printing process prolific in the 19th and early 20th century) by companies in big cities like Milwaukee, Chicago, or San Francisco. They would then be distributed to subscribers to hang on the walls of their homes and businesses.

J. J. Stoner. “Bird’s Eye View of Lake Geneva, Walworth County, Wisconsin.” Milwaukee, WI: Beck & Pauli, 1882. Map. https://www.loc.gov/item/77694095/.

C. J. Dyer. “Bird’s Eye View of Phoenix, Maricopa County, Arizona.” San Franscisco, CA: Schmidt Label & Litho. Co., 1885. https://collections.lib.uwm.edu/digital/collection/agdm/id/14897/rec/15
At the time, birds-eye views were particularly exciting because they depicted cities in a way that was recognizable, yet also aspirational. The panoramic maps depicted landmarks and buildings in a way that was recognizable from the street—something much harder to do with traditional maps that look straight down that the ground! (Patterson, 60). Their perspective also allowed viewers to take in much of their city at one time, inspiring civic pride in one’s home and perhaps even helping to acclimate recent immigrants (Newman). This combination of elements made birds-eye views accessible and inspirational to a degree that few other cartographic materials could match, leading to the increasing craze for cities and towns of all sizes across the US to have their image immortalized in a birds-eye view. By the 1930s, up to 2,400 places had been depicted in birds-eye view maps (Reps, 7).
However, with the rise of airplanes and photography, the lithographic birds-eye view of the 19th century began to fade away. By WWII, these once-popular materials were out of vogue, and were certainly not popular enough to be funded by subscription! However, they never entirely went away, especially when inviting visitors to a city or attraction. For example, American world’s fairs of the 20th century often mapped their fairgrounds using birds-eye views, giving would-be visitors a glimpse of the amazing buildings they could encounter at the fair. Tourist maps of the 20th and 21st century use panoramic views to help visitors orient themselves by recognizing the buildings they were walking past. Even today, the National Park Service uses birds-eye views to acclimate visitors to their parks and inform them of sites’ historic significance, though these birds-eye views are often made digitally and using aerial photographs for reference (Patterson, 61-62).

“Pure Oil pathfinder for a Century of Progress exposition, 1934.” Chicago: Rand McNally & Co., 1934. https://collections.lib.uwm.edu/digital/collection/agdm/id/18498/rec/4

Don Bloodgood. “A Pic-Tour Map of San Francisco: Where to Go, What to Do, How to See San Francisco.” San Fransisco, CA: H.S. Crocker Co., Inc., 1952. https://collections.lib.uwm.edu/digital/collection/agdm/id/20832/rec/6

Heinrich C. Berann. “Yosemite National Park.” Washington DC: National Park Service, 1988. https://collections.lib.uwm.edu/digital/collection/agdm/id/6852/rec/103
While birds-eye views may be less common today, they offer us valuable glimpses of what the spaces around us looked like and aspired to in the past and can give us whimsical and useful overviews of our world in the present. If you’d like to see more of the birds-eye views and panoramic maps in the AGSL’s collections, visit us in person or search our Digital Collections!
Works Cited:
Newman, Mark. “Boosting Chicago: Bird’s-Eye Views as Maps of Progress.” The Councilor: A Journal of the Social Sciences 71, no. 2 (2010). https://link.gale.com/apps/doc/A468773148/AONE?u=milwaukee&sid=bookmark-AONE&xid=b616746f.
Patterson, Tom. “Looking Closer: A Guide to Making Bird’s-Eye Views of National Park Service Cultural and Historical Sites.” Cartographic perspectives, no. 52 (2005): 59–75. https://cartographicperspectives.org/index.php/journal/article/view/cp52-patterson/pdf
Reps, John W. Bird’s Eye Views: Historic Lithographs of North American Cities. New York: Princeton Architectural Press, 1998.
Mapmaking and Poetry Collide
By Liam Dooley
In 1997, The New York Times published Howard Horowitz’s poem “Manhattan” as an “op-art.” A former Professor of Geography at the Ramapo College of New Jersey, Horowitz writes poetry centered on geographical and geological elements; many, like “Manhattan,” take the visual shape of the subject matter. This form, known as “concrete” or “shape” poetry, is used by poets to create meaning using “nonlinguistic elements.”1 Horowitz’s work has been described as “cartographically informed images that are also narrative texts,” a blending of geography and poetry to create visual art. 2

https://collections.lib.uwm.edu/digital/collection/agdm/id/35146/rec/1
In “Manhattan,” you can feel deep devotion and dedication coming from Horowitz; it’s more than a poem in the shape of Manhattan. Looking line-by-line, it becomes clear that the places Horowitz references correspond with their geographical spaces. The lines of the poem are carefully in- and out-dented to accurately depict the shores of Manhattan. Though there are no street signs and the scale isn’t specified, tunnels (shown in parentheses as an artistic choice) and bridges out of the island serve as guides for the rest of the poem, allowing the reader to place the many locations Horowitz includes.
For example, the lines “Songbirds alight in leafy woods as a turtle lays eggs / near a pond in Central Park” are situated halfway between “On the Triborough Bridge” and “Catch the F out to Queens.” Referencing a map of Manhattan, you will see that Central Park begins at 59th Street, the same as the Queensboro Bridge, and ends only about 15 blocks south of the Triborough Bridge. This accurately places Central Park within the poem’s visual depiction of Manhattan. Similarly, Carnegie Hall, Rockefeller Center, and Saint Patrick’s Cathedral are all referenced in between the Queensboro Bridge and “(the Lincoln Tunnel),” The further down you read, the more packed the poem becomes, mirroring the density of the island. Beginning with the phrase “The island’s tip” and ending with the “wind- / swept docks / at Battery / Park” neatly bookend the poem in the same way as they do the island.
“Manhattan” is a sweeping history of the titular island, referencing its past, present, and the very ground it’s built on. The poem begins with the lines “The island’s tip / was sliced by a ship / canal that tamed the / Spuyten Duyvil shoals, / but severed Marble Hill / from Inwood,” referencing the Harlem River Ship Canal that split Marble Hill from Manhattan in 1895. Today, the Harlem River separates Inwood Hill Park at the tip of Manhattan from mainland New York City, where the Marble Hill neighborhood is accessible via the Broadway Bridge.
More of Manhattan’s history is found in the lines “The original steal (this island, traded for $24 in / beads) lies plastered in myth and concrete, obscured / like the African Burial Grounds,” which allude to the common story of Manhattan’s origin while simultaneously placing the African Burial Ground National Monument within the poem’s map. Horowitz’s poetic voice comes out in the juxtaposition of “myth” and “concrete,” showing that mythology and the past have physical weight, building Manhattan in the same way as concrete.
Jam-packed with references to Manhattan neighborhoods, culture, art, history, and it’s very foundation, Horowitz invites the reader to explore and experience it for themselves: “From / Hell’s Kitchen walk to Broadway, buy tickets for / “Showboat” or “Cats”—hey, the Knicks won at the / buzzer in the Garden! See Macy’s float parade, then / gape from atop the Empire State, where mighty Kong / took a fall.” Horowitz’s background in natural science is featured in lines like “Gneiss but full of schist, the bedrock sparkles with / mica.” What one might ordinarily overlook, underground and invisible to the eye, is now on full poetic display.
A signed poster of “Manhattan” can be seen at the American Geographical Society Library, open M-F 9-4:30, or viewed online through the AGSL Digital Map Collection. More of Horowitz’s work can be found in his book of poetry, Close to the Ground, originally published in 1986 and recreated here for free, online use.
1. “Concrete Poetry.” Poetry Foundation, https://www.poetryfoundation.org/learn/glossary-terms/concrete-poetry.
2. Wordmaps. 12 Sep. 2017, http://wordmaps.net/. Internet Archive https://web.archive.org/web/20170912005042/http://wordmaps.net/.
The Cassini Atlas
The AGSL recently added a treasure to our collections: a bound reproduction of hand-colored editions of the Cassini Map, released in a limited edition this year. This book is a massive (22.4×26.2 inches when closed!), masterful edition of one of the most influential mapping projects in Western history: the Cassini Family’s map of France.

The Cassini maps are the result of the work of four generations of astronomers, geometers, and cartographers in the Cassini Family. Cassini I, Giovanni Domencio, was an astronomer who worked for Louis XIV at the Paris Observatory. Using his knowledge of the stars and planets’ movements, he was the first to accurately measure distances on Earth using triangulation and geodetic measurements —a method we still use in mapping today! Cassini I also proposed a way to standardize longitude, a necessity for both navigation and conveying distance on maps.
Cassini I, his son, and his grandson all worked on creating a map of France using their new, scientific mapping method, and the result was the first accurate outline map of France, presented to the King in 1744. Cassini III thought that this map would be the end of their project, but Louis XV had bigger plans: he wanted the Cassinis to create detailed, topographic maps of each part of his nation.
Over about 30 years, this mapping project would give us the maps bound in the atlas just added to the AGSL’s collections. Cassini III and Cassini IV (after 1784) oversaw the process with care: they had ten different teams of surveyors spread out over the country at any given time, asking them to make extensive notes on both the geodetic measurements they were making and topographic and toponymic information like physical landmarks, church locations, and place names to include in the maps. The result was 182 sheets which measured 65×95 centimeters each, covering the entirety of France.
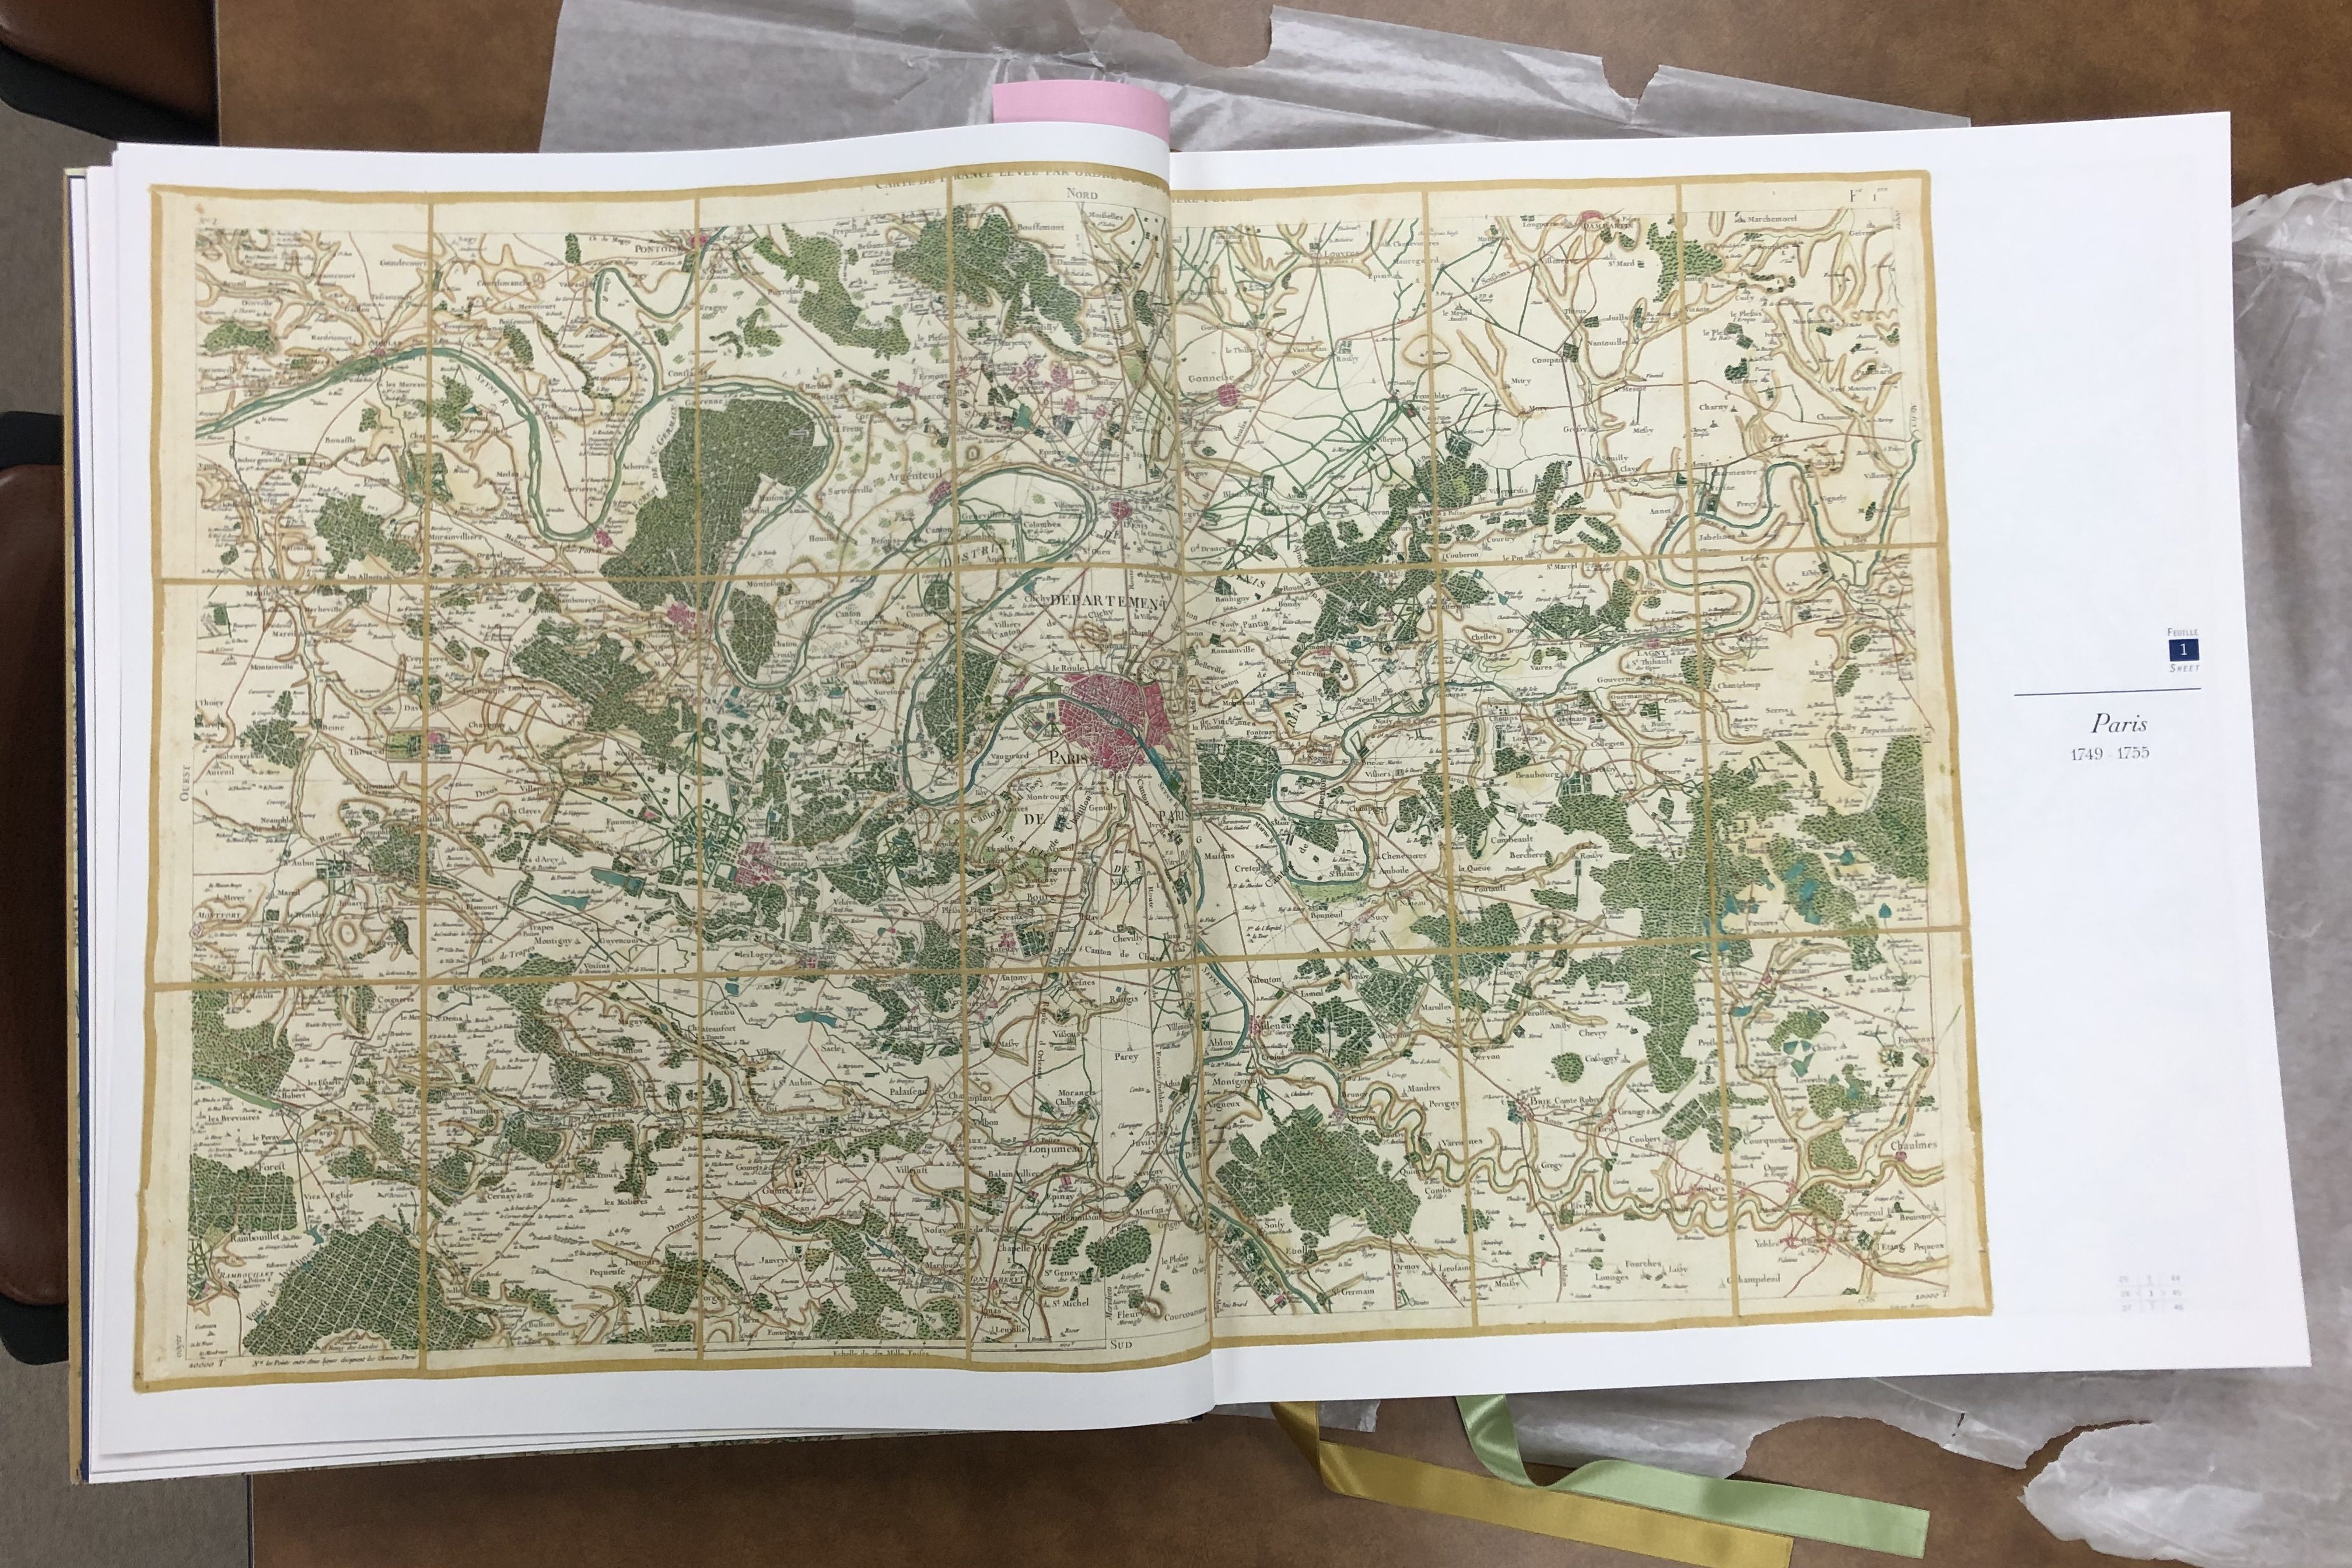
While the maps would have been an impressive point in the history of mapping because of the size of the project and the innovation in measurements alone, they also left an important legacy in the political and social histories of mapping. The Cassinis’ massive mapping endeavor was initially made possible because France’s kings wanted accurate, comprehensive maps to help them govern, quantify, and tax the nation they ruled. To make that possible, the Cassinis not only imposed the lines of measurement on France, they also developed and standardized what historian Jerry Brotton calls a “new language of cartography” through their maps, where standardized symbols, lettering, and notations made the culturally and linguistically diverse county seem like a unified nation—and one happily overseen by a monarch (Brotton, 324).
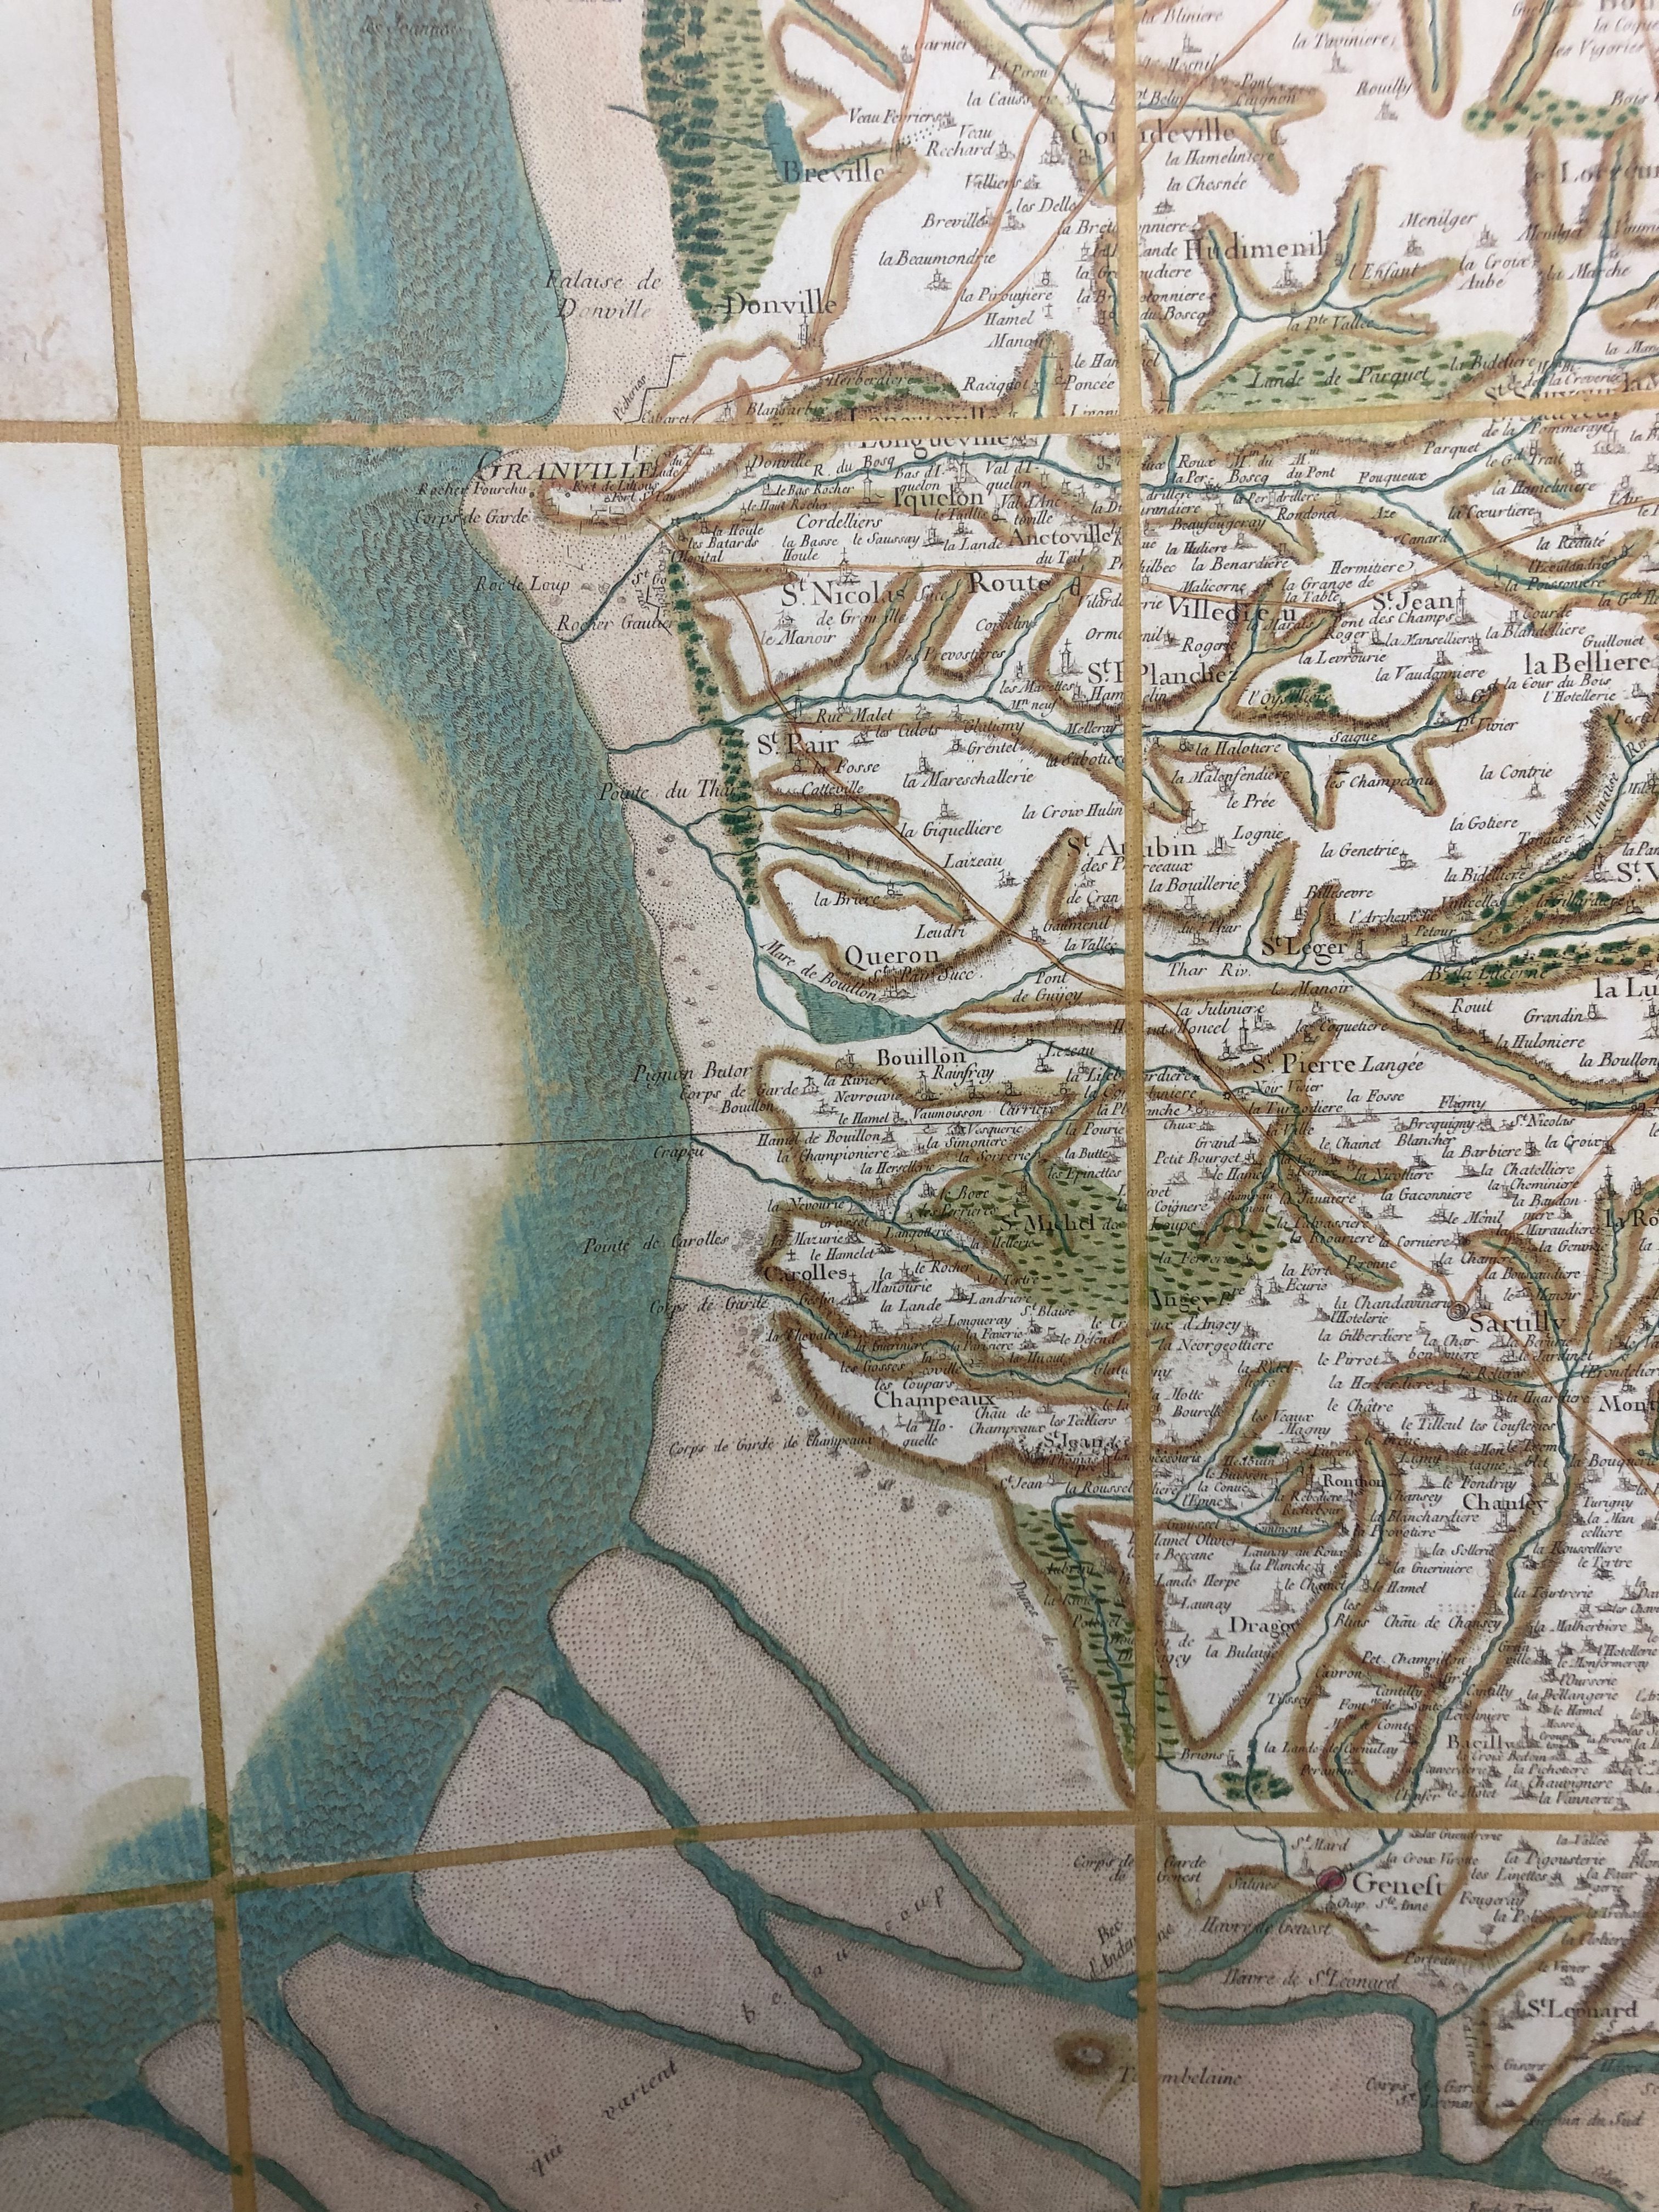

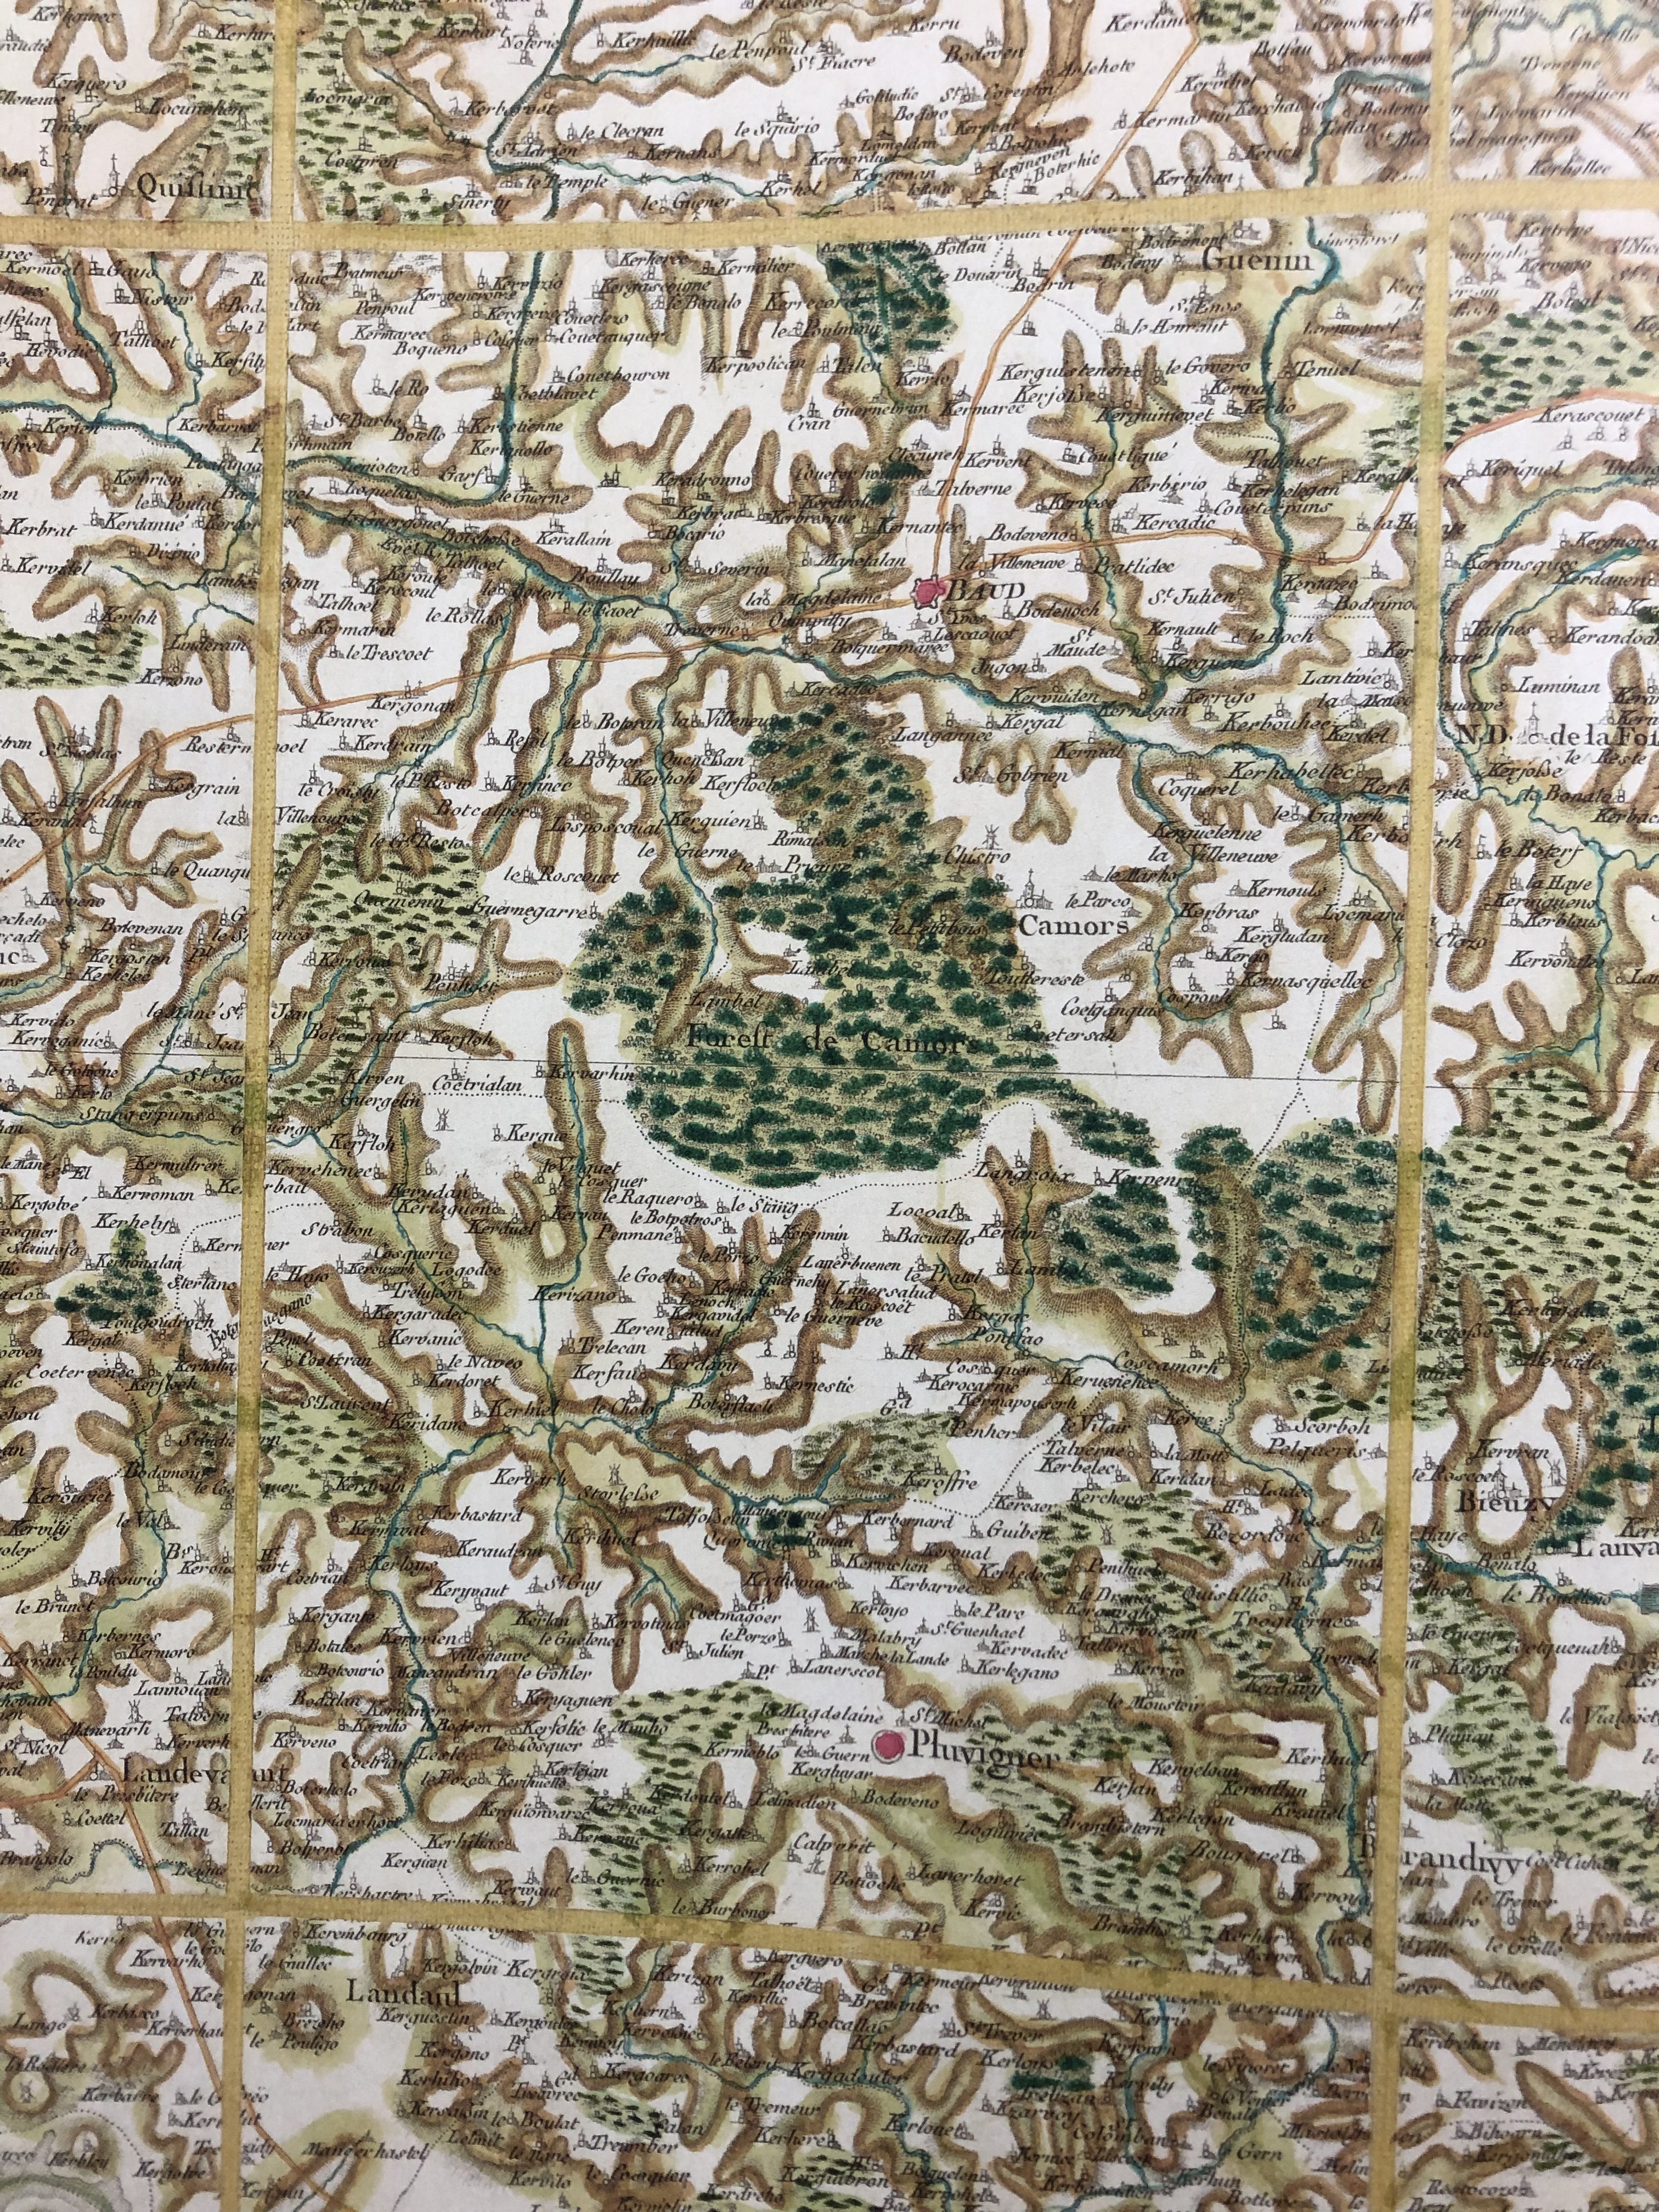
But before the maps were completed, the French Revolution altered the course of France’s nationhood, and of the Cassinis’ project. In 1793, the National Assembly ‘nationalized’ the map, forbidding the sheets that had already been published from being sold and confiscating all the Cassinis’ engraved plates to prevent more copies being made. From this point on, the maps were seen not just as navigational tools for the public, but as a way to unify the diverse peoples living within the national lines of France so that they could more effectively be governed. It was Napoleon’s Department of War who finished printing the full series of maps in 1815, helping the infamous emperor re-shape France’s identity for himself.
If you’d like to see our stunning copy of the Cassini’s historic atlas for yourself, stop by the AGSL sometime this summer! To read more about the Cassini map, check out chapter 9 of Jerry Brotton’s A History of the World in Twelve Maps or the website of the publisher of our new atlas. Or you can schedule an appointment to view two original sheets of the Cassinis’ map using our Rare Materials Viewing Form!
Guest Post: The Russo-Japanese War
Today, we are delighted to showcase an insightful guest essay by Violet Wakefield, a student at UWM specializing in History with a minor in Anthropology. During the spring semester, Violet engaged in HIST 596, “Maps as Historical Sources,” a UWM history class embedded in the AGSL
Referred to by some modern historians as “World War Zero,” the Russo-Japanese War of 1904-1905 is often overlooked in American accounts of the 20th century. The war was one of several military conflicts that marked the end of Russia’s eastward expansion, the most recent at the time being the Boxer Rebellion in China in 1900. Unlike their far more informal conflict with a rapidly declining Chinese kingdom, growing tensions between Russia and the rising power of Japan over rights to Manchuria and Korea had ripple effects that could be felt for decades to come. The complex network of imperial rivalries and mutual defense treaties that would eventually plunge the world into the Great War a decade later generated diplomatic tensions all across Eurasia and into the United States as early as 1903, long before a single bullet was fired. This map1, creatively titled “1904 War Map of Russia and the Continent of Asia,” printed by the prominent Chicago firm Rand-McNally at the war’s outbreak in winter of 1904, sheds light on the American view of this distant, seemingly inconsequential conflict.

China, in spite of its weak economy throughout the Century of Humiliation, was viewed by American and European capitalists alike as a potentially limitless market, a future “oriental version of the United States.”2 As a result of this belief, contemporaries around the world paid close attention to the Russo-Japanese war and its aftermath. Western interest in the war was, however, still motivated in part by anxieties surrounding the treaties of mutual defense between the Great Powers. Diplomatic pressure was placed on France and Britain to aid the Russians and Japanese, respectively, through the Dual Entente of the 1890s and Anglo-Japanese Alliance of 1902. American interest in particular was purely financial, however. The 19th century project of American imperialism in the Pacific required an informal alliance with the Japanese, and the fear regarding a Russian victory was that of a wider war between European empires. It was widely believed by American diplomats in China that if, because of the Russian foothold established in Manchuria, the French and German empires would also seek to control larger portions of Chinese territory as compensation. Only the Japanese and British, the most successful foreign powers in China in the late 19th century, were seen as standing in Russia’s way.3
As the war rolled on and Japan gained the clear upper hand, the Roosevelt administration was not brought into the 18 month-long conflict until peace negotiations began in 1903. Reflecting the anxieties held by many that the war would be a spark in a global conflict, the most prominent features of Rand-McNally’s map are the population sizes of various major cities across Asia. None of the countries listed on the map were actively attacked by either power over the course of the war, but at this early date, it was unknown if that was a possibility. As European nation-states entered the modern era, more emphasis was placed on the depiction of statistical data.4 Maps, by the turn of the 20th century, were only one of many tools for planning a war. Battlefield maps were far less important to diplomats and generals than the numbers, measurements, and troop movements. As such, both Russian and Japanese naval and infantry capabilities are featured prominently in this map’s top and bottom sidebars. European military strategy throughout the 19th century gradually began to shift its emphasis from specific locations and terrain to the broader landscape a war was being fought across, from battles to the front.5 American military strategy in the years following the Civil War was also similarly focused on the broader front of a war. This can be seen in the lack of specific battlegrounds on the map. The war did however, through fictionalized English language accounts and rapidly produced illustrated volumes, succeed in capturing the imagination of Anglo-American consumers.6
Since the Spanish-American War of 1898, which was similar in significance on the international stage to the Russo-Japanese war, the American public in particular developed an insatiable appetite for war maps. This map is just one such product made to fill this new niche in the American map market, dense with information about the far-flung empires of Asia and their military capabilities. Historian Susan Schulten makes note of the prominence of the Chicago map-making firms in the last decades of the 19th century, as Chicago’s placement near the frontier of the urban North allowed it to service settlers in the western half of the continent far easier than cities like Baltimore or New York.7 Chicago’s mapmaking industry was shaped by the early demand for political maps of Western North America, and political maps remained the most commonly purchased consumer level map for decades after westward expansion came to an end. While settlers in American territories of 1904 did not necessarily know the threat the war in Asia could have had on their livelihoods, they may well have encountered this particular map as a part of Rand-McNally’s latest print run in a general store, a market, or perhaps even decorating the home of a friend.
Bibliography
“1904 War Map of Russia and the Continent of Asia; 1904 War Map of Japan, Korea and China” (Chicago: Rand McNally and Company, 1904).
David Schimmelpenninck van der Oye, “Rewriting the Russo-Japanese War: A Centenary Retrospective,” The Russian Review 67, no. 1 (2008), pages 78 – 87.
Edward B. Parsons, “Roosevelt’s Containment of the Russo-Japanese War,” Pacific Historical Review 38, no. 1 (1969): pages 21 – 44.
Matthew Edney, “Mapping Parts of the World,” in Maps: Finding Our Place in the World, James R. Akerman and Robert W. Karrow, Jr., ed. (Chicago: University of Chicago Press, 2007), pages 117 – 157.
Michael Friendly and Gilles Palsky, “Visualizing Nature and Society,” in Maps: Finding Our Place in the World, James R. Akerman and Robert W. Karrow, Jr, ed. (Chicago: University of Chicago Press, 2007), pages 207 – 254.
Susan Schulten,“Maps for the Masses, 1880-1900,” in The Geographical Imagination in America, 1880-1950, (Chicago: University of Chicago Press, 2001), pages 17 – 44.
- “1904 War Map of Russia and the Continent of Asia; 1904 War Map of Japan, Korea and China” (Chicago: Rand McNally and Company, 1904). ↩︎
- Edward B. Parsons, “Roosevelt’s Containment of the Russo-Japanese War,” Pacific Historical Review 38, no. 1 (1969): page 23 ↩︎
- Parsons, “Roosevelt’s Containment of the Russo-Japanese War,” page 27 ↩︎
- Michael Friendly and Gilles Palsky, “Visualizing Nature and Society,” in Maps
- Matthew Edney, “Mapping Parts of the World,” in Maps
- David Schimmelpenninck van der Oye, “Rewriting the Russo-Japanese War: A Centenary Retrospective,” The Russian Review 67, no. 1 (2008), page 82. ↩︎
- Susan Schulten,“Maps for the Masses, 1880-1900,” in The Geographical Imagination in America, 1880-1950, (Chicago: University of Chicago Press, 2001), page 23. ↩︎
 American Geographical Society Library
