
DataV empowers you with a rich collection of classic and advanced visualizations designed for clarity, depth, and business storytelling.
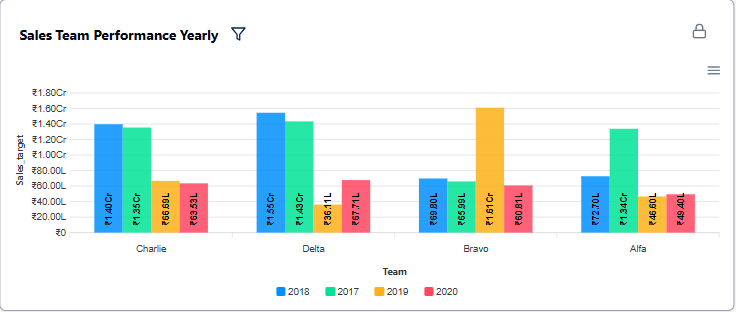
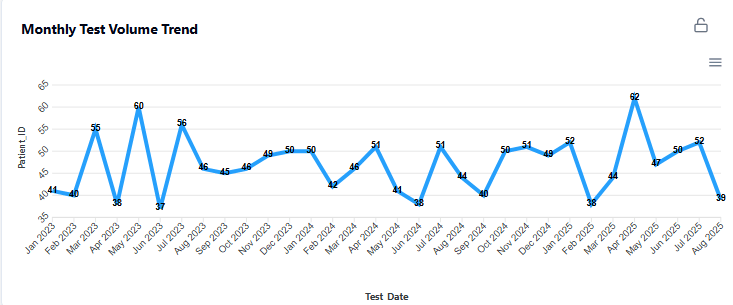
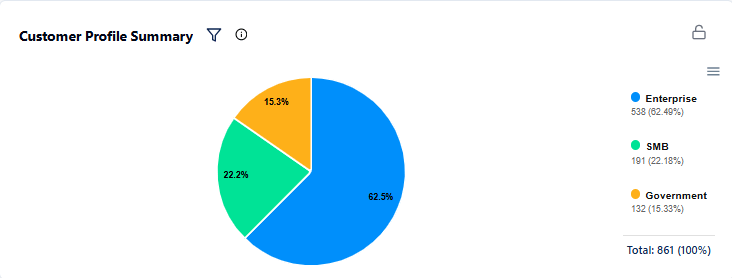
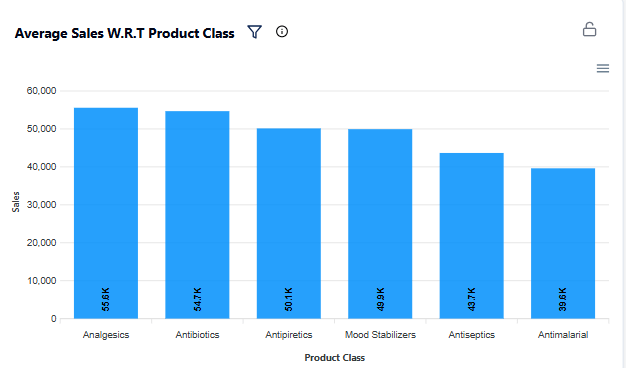
Deliver clean, universally understood representations ideal for trends, comparisons, and distributions. Perfect for business monitoring, performance analysis, and executive dashboards.

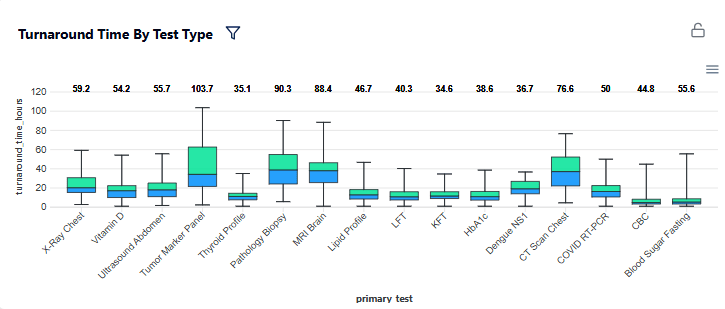
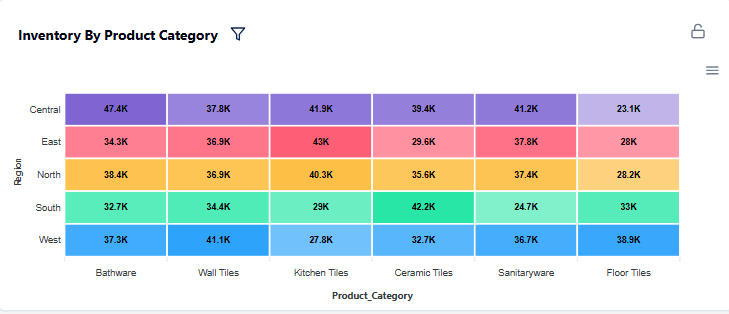
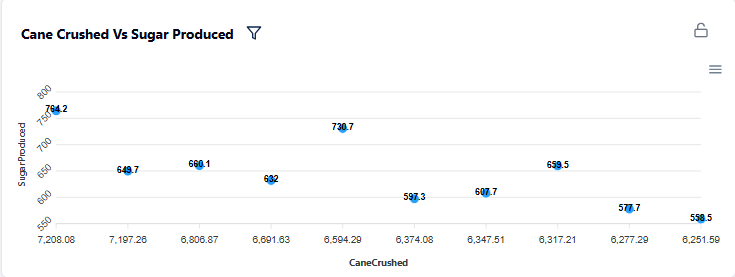
Unlock deeper insights with specialized charts built for multidimensional, high-density, and hierarchical data. Identify patterns, correlations, outliers, and structural flows with scientific precision.

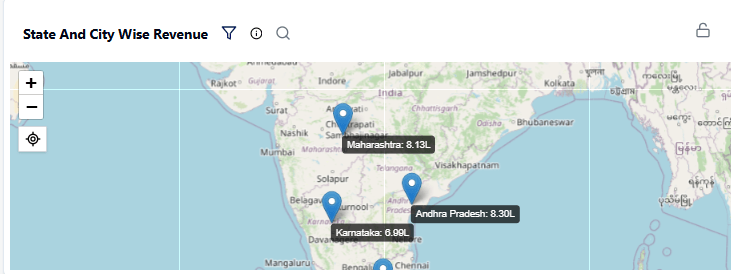
Transform location-based data into compelling storylines. Drill from country to city to individual stores, visualize density, track coverage, monitor clusters, and uncover regional opportunities or risks.
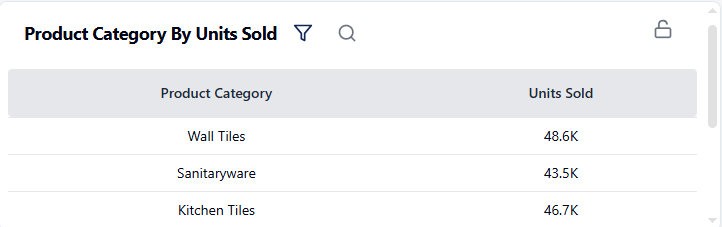
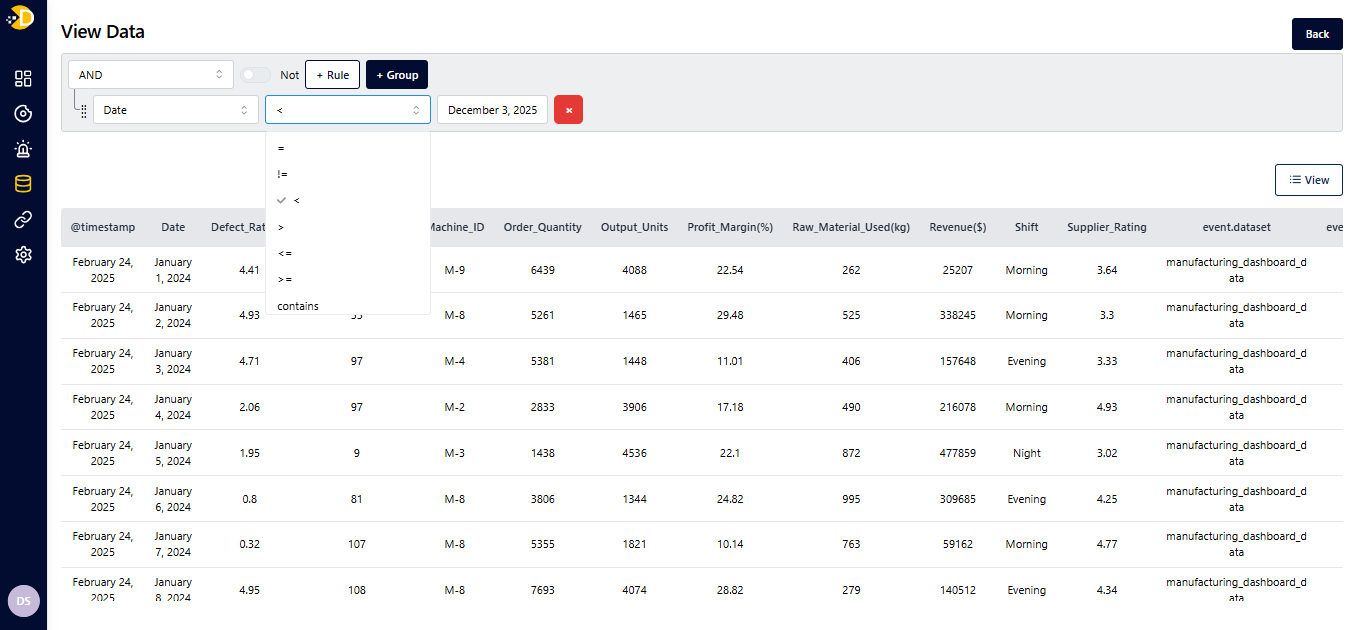
Switch seamlessly between visual insights and audit-ready granular data. Ideal for operational reporting, validations, and compliance-driven environments.
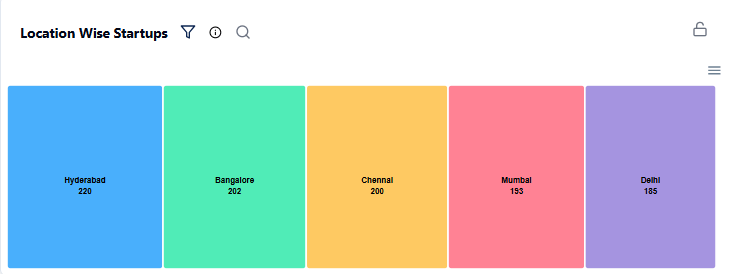
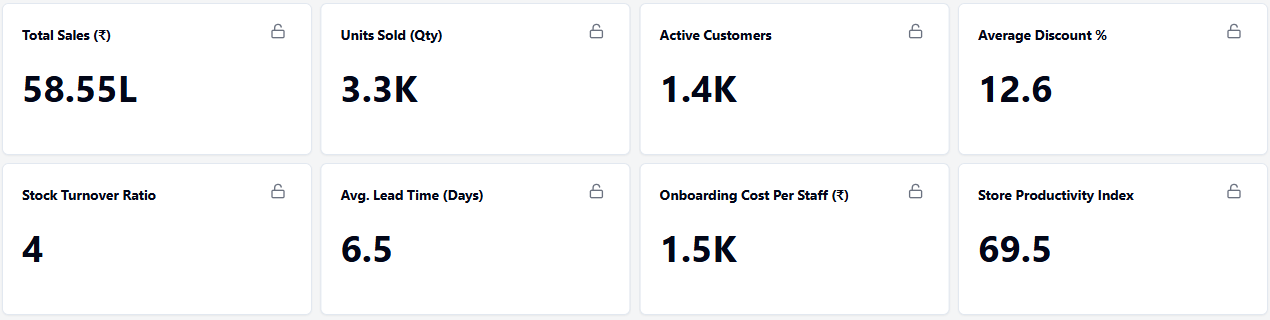
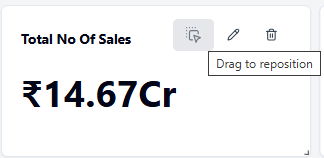
Highlight mission-critical numbers with sleek cards designed for instant visibility and high-impact at-a-glance decision-making.
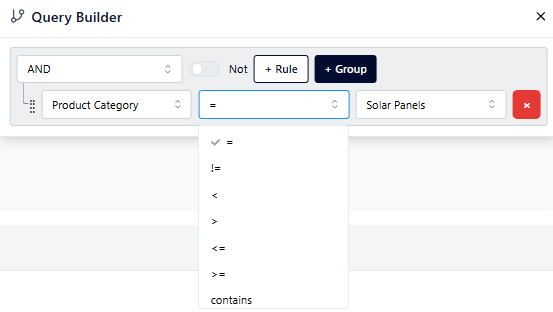
Effortlessly refine your insights with an intuitive Query Builder. Add custom filters directly inside each visualization to slice, drill, and explore data exactly the way you need, no technical skills required.
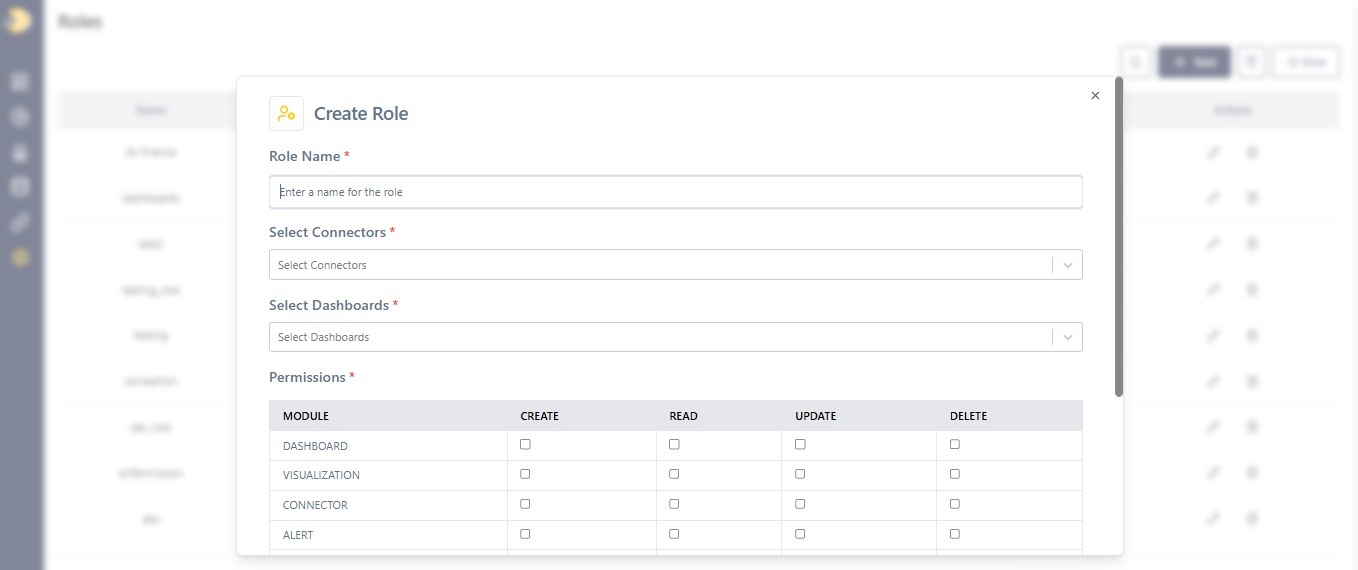
Create complete dashboards, visualizations, and reports with a simple Low- Code/No-Code interface. Empower business teams to build enterprise-grade analytics independently, reducing dependency on IT and accelerating decision- making.
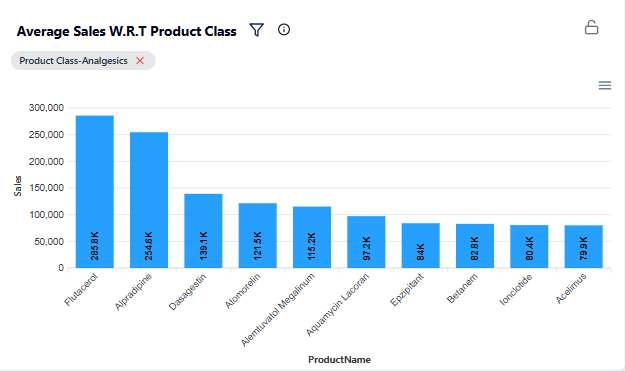
Move effortlessly from a high-level summary to the most granular detail with a single click. Whether navigating from Country → Region → City → Store or Product Category → SKU → Batch, drill-down interactions keep insights connected and contextual.
Customize dashboards with complete freedom. Rearrange widgets, resize visuals, and design tailored data experiences without needing developers or designers. A true visual canvas for decision-makers.
Find exactly what you're looking for inside any chart or table. Search products, employees, cities, categories, or codes directly within the visual boosting efficiency and eliminating endless scrolling.
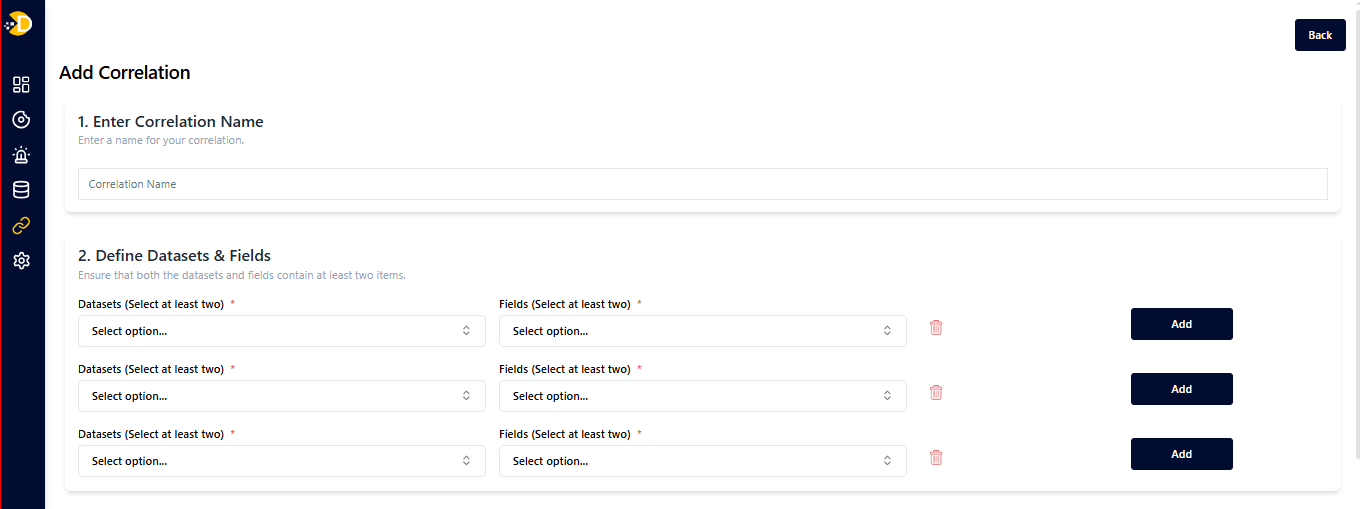
Blend data across Sales, HR, Finance, Operations, Manufacturing, and more. Detect hidden relationships and patterns automatically. Break data silos with seamless multi-source integration
Turn fragmented datasets into a single, insight-rich truth layer.
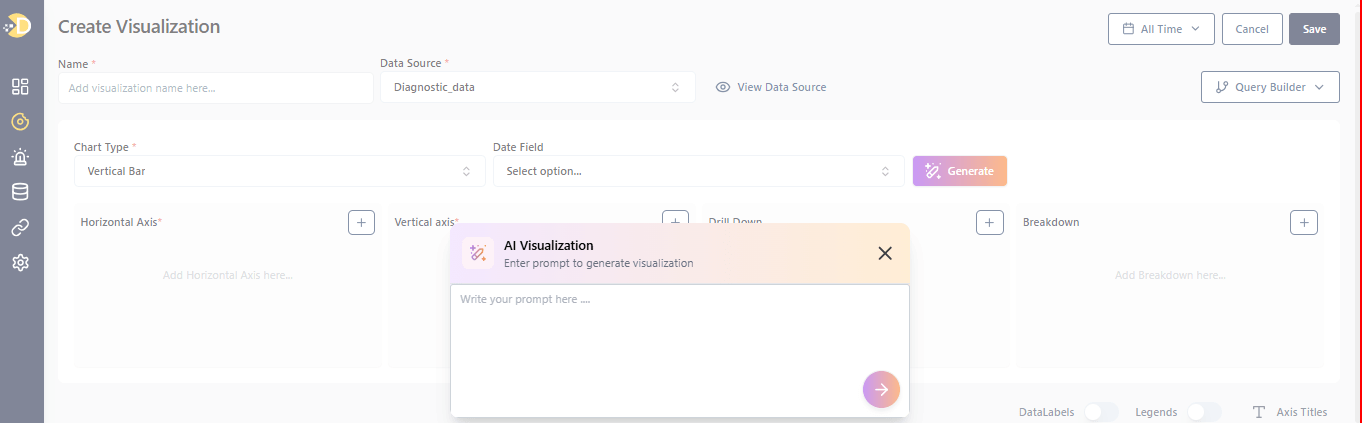
Ask questions in plain English and get accurate, instant insights. Automatically generates the most suitable visualization. Enables true self-service exploration. Eliminates the need for SQL, scripts, or technical dependencies
If you can type a question, you can analyse your data.
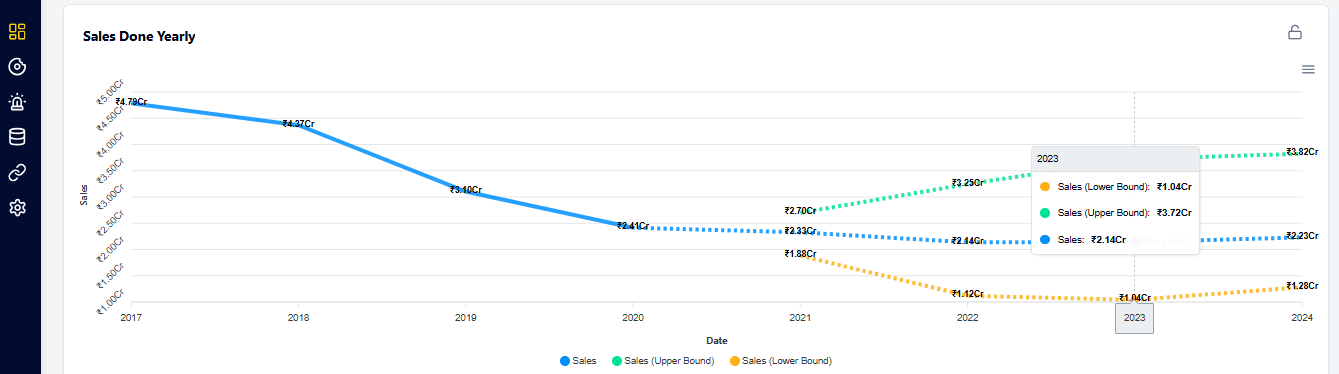
AI-powered time series forecasting. Intelligent trend extension and scenario modelling. Confidence intervals that highlight risk and opportunity. Ideal for planning, budgeting, and operational forecasting.
See tomorrow’s outcomes today.
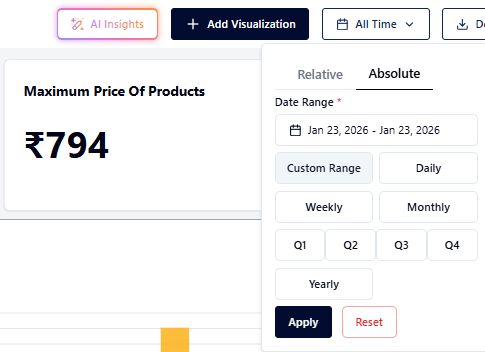
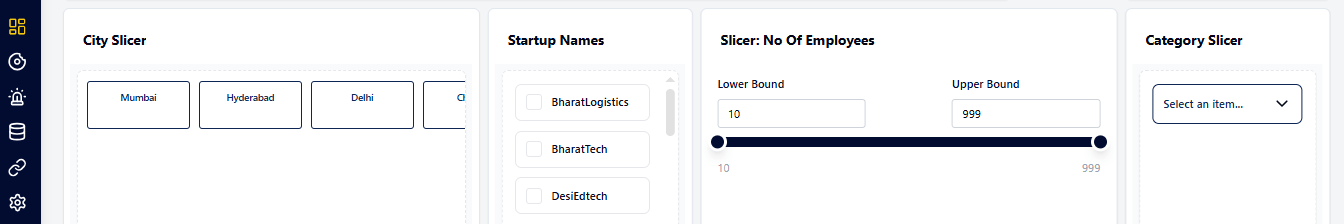
Vertical, Horizontal, Dropdowns, checkboxes and numeric ranges. Instant, multi-level filtering. Enables users to explore data from every angle.
Transform static dashboards into fully interactive exploration systems.
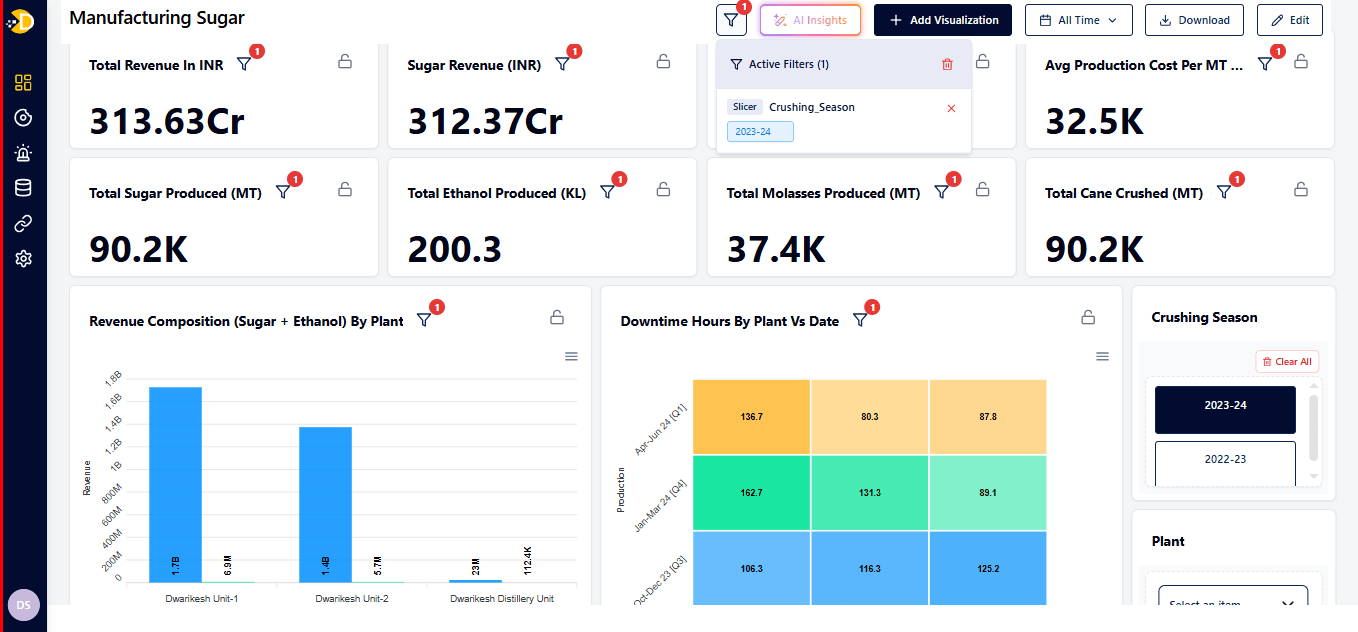
Automated narratives that explain KPIs and anomalies. Executive-ready summaries in clean, natural language. Next-step recommendations for proactive decision-making. Context-aware insights delivered instantly.
Your data interpreted intelligently.

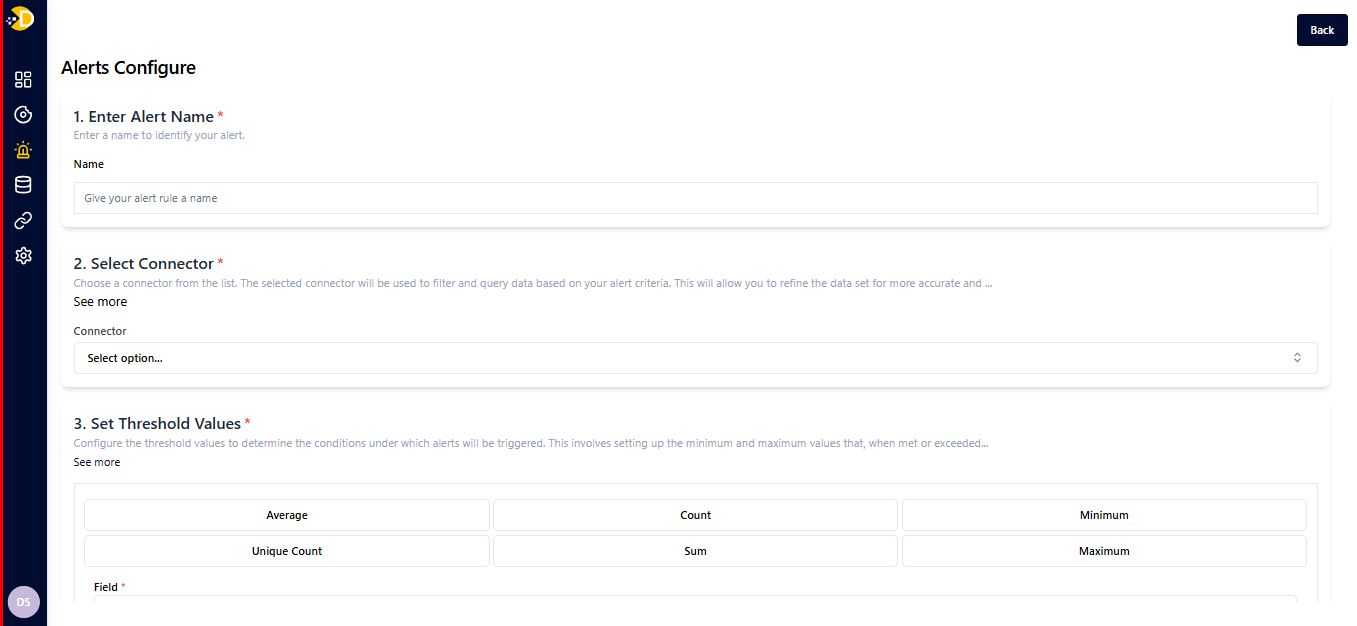
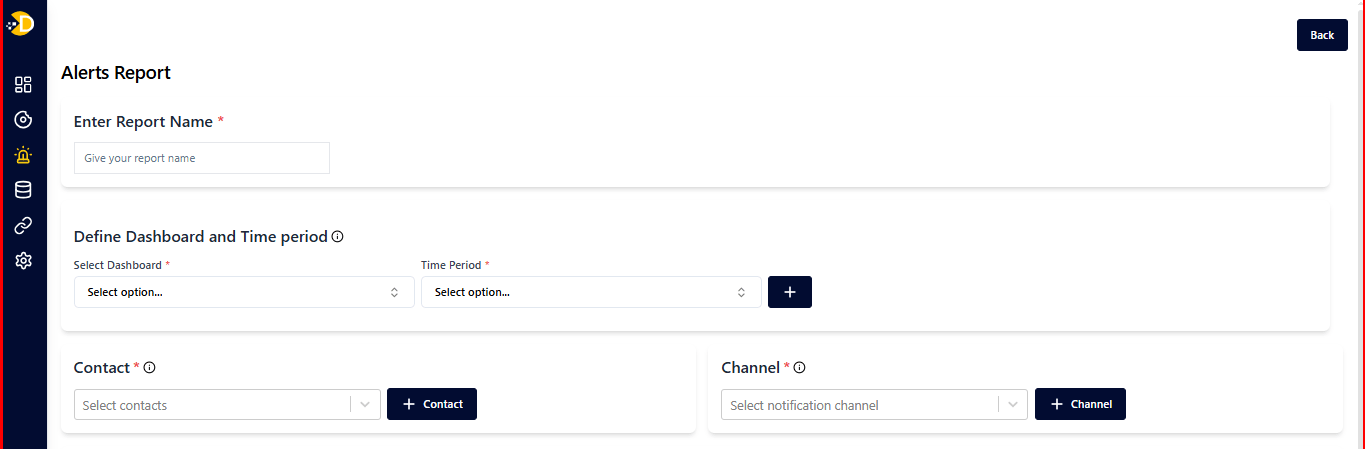
Real-time alerts when KPIs cross critical thresholds. Automated scheduling of dashboards in PDF or Excel. Instant email delivery for teams and leadership. Custom, event-driven trigger configuration
Never miss a moment that matters.
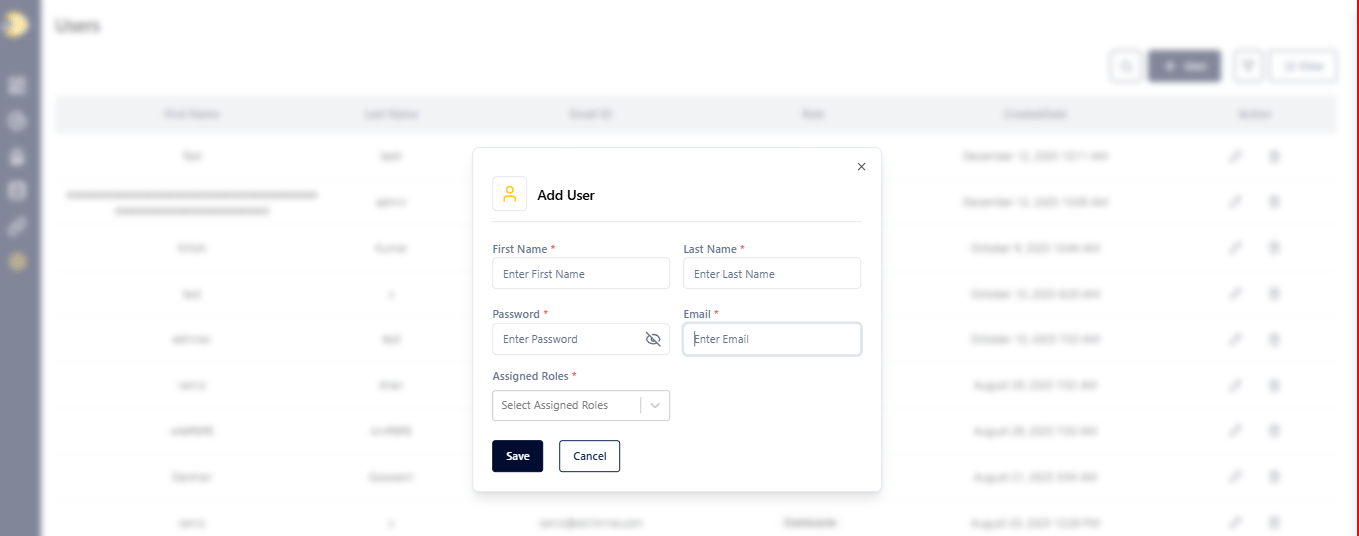
Fine-grained user and group governance. Control access at dashboard, dataset, data explorer, etc. Scalable enterprise security for teams of any size. Protects sensitive insights while enabling collaboration
.
Power for everyone. Access for only the right ones.

Salesforce

Gitlab

Dynamic BC

Sharepro

Firebase

MongoDB

Elastic Search
Cockroach DB

Cassendra
Dynamo DB

Couchbase Capella
Redis

Couch DB
CSV

Excel

JSON
Sharepoint

Manage Engine Plus

ME Endpoint Central
MySql

SAP

PostreSQL

ORACLE

MariaDB
SQL server
IBM DB2

Supabase