
Download DigitizeIt – Free Mac Data Extraction Tool for Charts
Overview
DigitizeIt, developed by Bormisoft, is a specialized Mac‑only application that bridges the gap between static chart images and usable scientific data. Belonging to the Education & Reference category with a focus on Science, the software empowers researchers, students, and data‑analysts to transform visual information embedded in common image formats—JPG, PNG, BMP, and GIF—into editable numeric tables. The core workflow involves uploading an image, manually defining the X‑ and Y‑axes, and entering the scale values that anchor the graph. Once the axes are calibrated, DigitizeIt extracts the data points and exports them as plain ASCII files or in scientific notation, ready for import into spreadsheet programs, statistical packages, or custom scripts. Although the interface leans toward a technical audience and may require a modest level of mathematical understanding, the tool’s unique capability to digitize chart data without a direct source file makes it an indispensable asset for anyone who needs accurate, reproducible data from published graphs, scanned documents, or legacy reports. In a market where free web‑based alternatives often produce noisy results, DigitizeIt offers a secure, offline solution that respects intellectual property and ensures that sensitive research data never leaves the user’s machine.
Key Features
- Multi‑format image support – Accepts JPG, PNG, BMP, and GIF files, allowing users to work with screenshots, scanned pages, or exported graphics directly.
- Axis calibration tools – Interactive widgets let you place precise X and Y axis markers and assign real‑world values, guaranteeing accurate scaling.
- Manual point selection – Click on individual data points to capture their coordinates, useful for complex curves or sparse data sets.
- Export options – Save extracted data as plain ASCII, CSV, or scientific notation files for seamless integration with Excel, R, Python, or MATLAB.
- Zoom and pan interface – High‑resolution zooming ensures that even tightly packed data points can be selected without loss of precision.
- Batch processing (pro version) – Automate repetitive digitization tasks across multiple images, increasing productivity for large projects.
- Secure offline operation – No internet connection required, keeping proprietary data safe from external exposure.
- Regular updates – The development team releases performance patches and compatibility tweaks for the latest macOS releases.
Installation, Usage Instructions & Compatibility
How to download and install
Begin by visiting the official Bormisoft website or a trusted Mac App Store link. The download is offered as a signed .dmg file, ensuring a secure and verified installation package. After the file finishes downloading, double‑click the .dmg and drag the DigitizeIt icon into your /Applications folder. macOS may prompt you to confirm that you trust the developer; simply click “Open” to proceed. The installer automatically places the necessary supporting files, and the application is ready to launch from the Dock or Launchpad.
Step‑by‑step usage guide
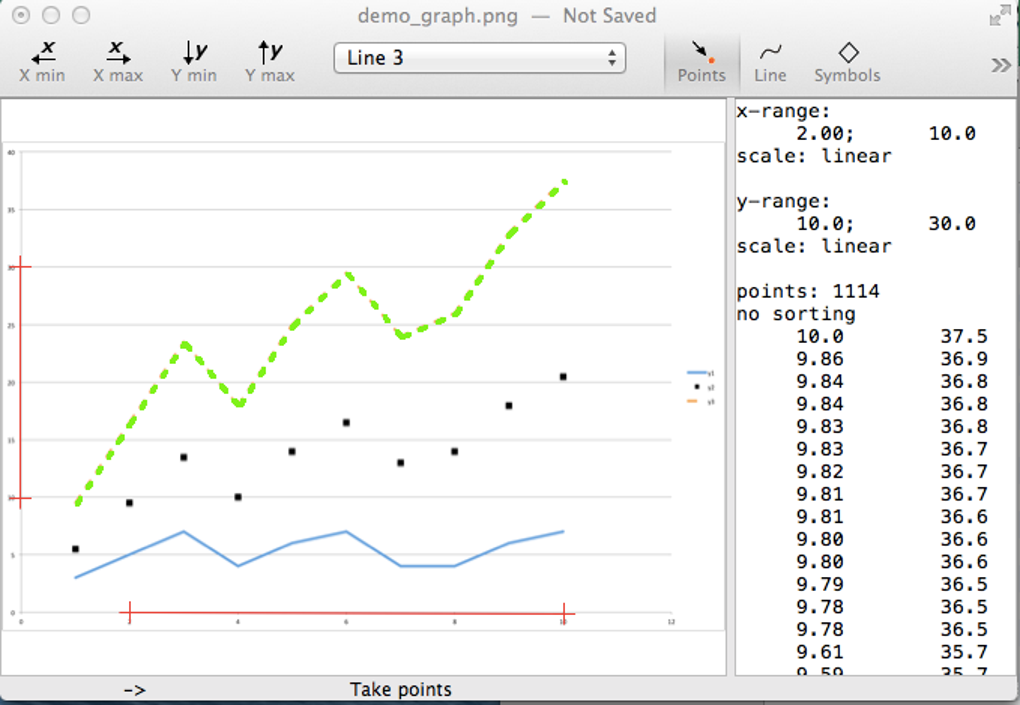
- Load your chart image – Click the “Open Image” button and select a JPG, PNG, BMP, or GIF file containing the graph you wish to digitize.
- Define axes – Use the “Set X‑Axis” and “Set Y‑Axis” tools to click two points on each axis. Enter the real‑world values that correspond to those points (e.g., 0 °C and 100 °C for a temperature axis).
- Calibrate scale – The software calculates the conversion factor automatically once both axes are defined.
- Mark data points – Click directly on each visible point on the curve. For dense curves, use the zoom function to improve accuracy.
- Review extracted data – A table preview shows the X‑ and Y‑coordinates in the chosen units. Edit any points manually if necessary.
- Export results – Choose “Export as ASCII,” “Export as CSV,” or “Export as Scientific Notation.” Save the file to your desired location.
System requirements
DigitizeIt is optimized for macOS 11 (Big Sur) and later, including macOS 12 Monterey and macOS 13 Ventura. The application requires a minimum of 2 GB RAM and 150 MB of free disk space. A Retina display is recommended for precise point selection, but the software runs on any Mac that meets the basic OS version.
Pros, Cons, Frequently Asked Questions & Conclusion
Pros
- Highly accurate data extraction from static chart images.
- Offline, secure operation protects confidential research data.
- Supports multiple export formats for seamless workflow integration.
- Intuitive zoom and pan features enhance point‑selection precision.
- Regular updates keep the tool compatible with the latest macOS releases.
Cons
- Steeper learning curve for users without a background in graph scaling.
- Interface can feel dated compared with modern macOS design trends.
- No native Windows or Linux version; Mac‑only limits cross‑platform teams.
- Batch processing is restricted to the paid “Pro” upgrade.
FAQ
Can DigitizeIt handle logarithmic axes?
Yes. After defining the axis points, you can select “Logarithmic Scale” from the axis settings menu, allowing the software to calculate the correct conversion for log‑based charts.
Is there a free trial available?
Bormisoft offers a 14‑day free trial that provides full access to all features, including batch processing. No credit‑card information is required to start the trial.
Can I import the exported CSV directly into Excel?
Absolutely. The CSV file follows standard comma‑separated formatting, making it compatible with Excel, Google Sheets, and most data‑analysis programs without additional conversion.
What image resolution is recommended for best results?
A resolution of at least 300 dpi is recommended. Higher resolution images reduce ambiguity when selecting points and improve the overall accuracy of the extracted data.
Does DigitizeIt support scripting or automation?
The Pro version includes a simple AppleScript bridge that allows you to automate repetitive tasks such as loading a folder of images, applying the same axis calibration, and exporting results in batch mode.
Conclusion & Call to Action
DigitizeIt fills a niche that many researchers and engineers have struggled with for years: converting static visual data into editable numeric form without resorting to error‑prone manual transcription. While its Mac‑only availability and slightly technical interface may deter casual users, the payoff in precision and data integrity is substantial for anyone who regularly works with published graphs, scanned reports, or legacy charts. The combination of secure offline processing, versatile export options, and regular updates makes DigitizeIt a reliable, long‑term addition to any scientific workflow. Ready to turn those stubborn images into usable data? Download DigitizeIt now and start extracting accurate chart data today.