Blog

Discover the magic of maps and get inspired – Learn more and get a deeper understanding of maps and their significance.
Are you looking for best practices, tips, updates and helpful hints to make your maps stand out? You came to the right place!
New feature ✨

Choropleth maps in Mapcreator just got easier

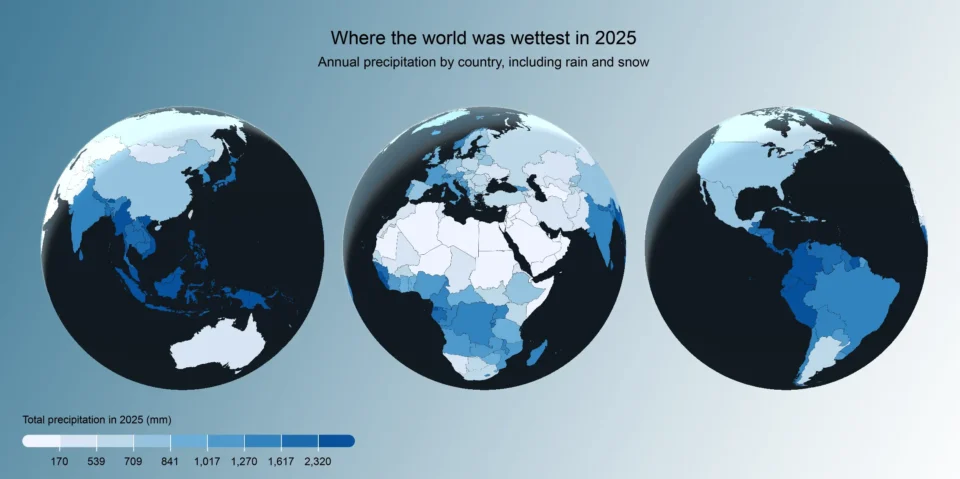
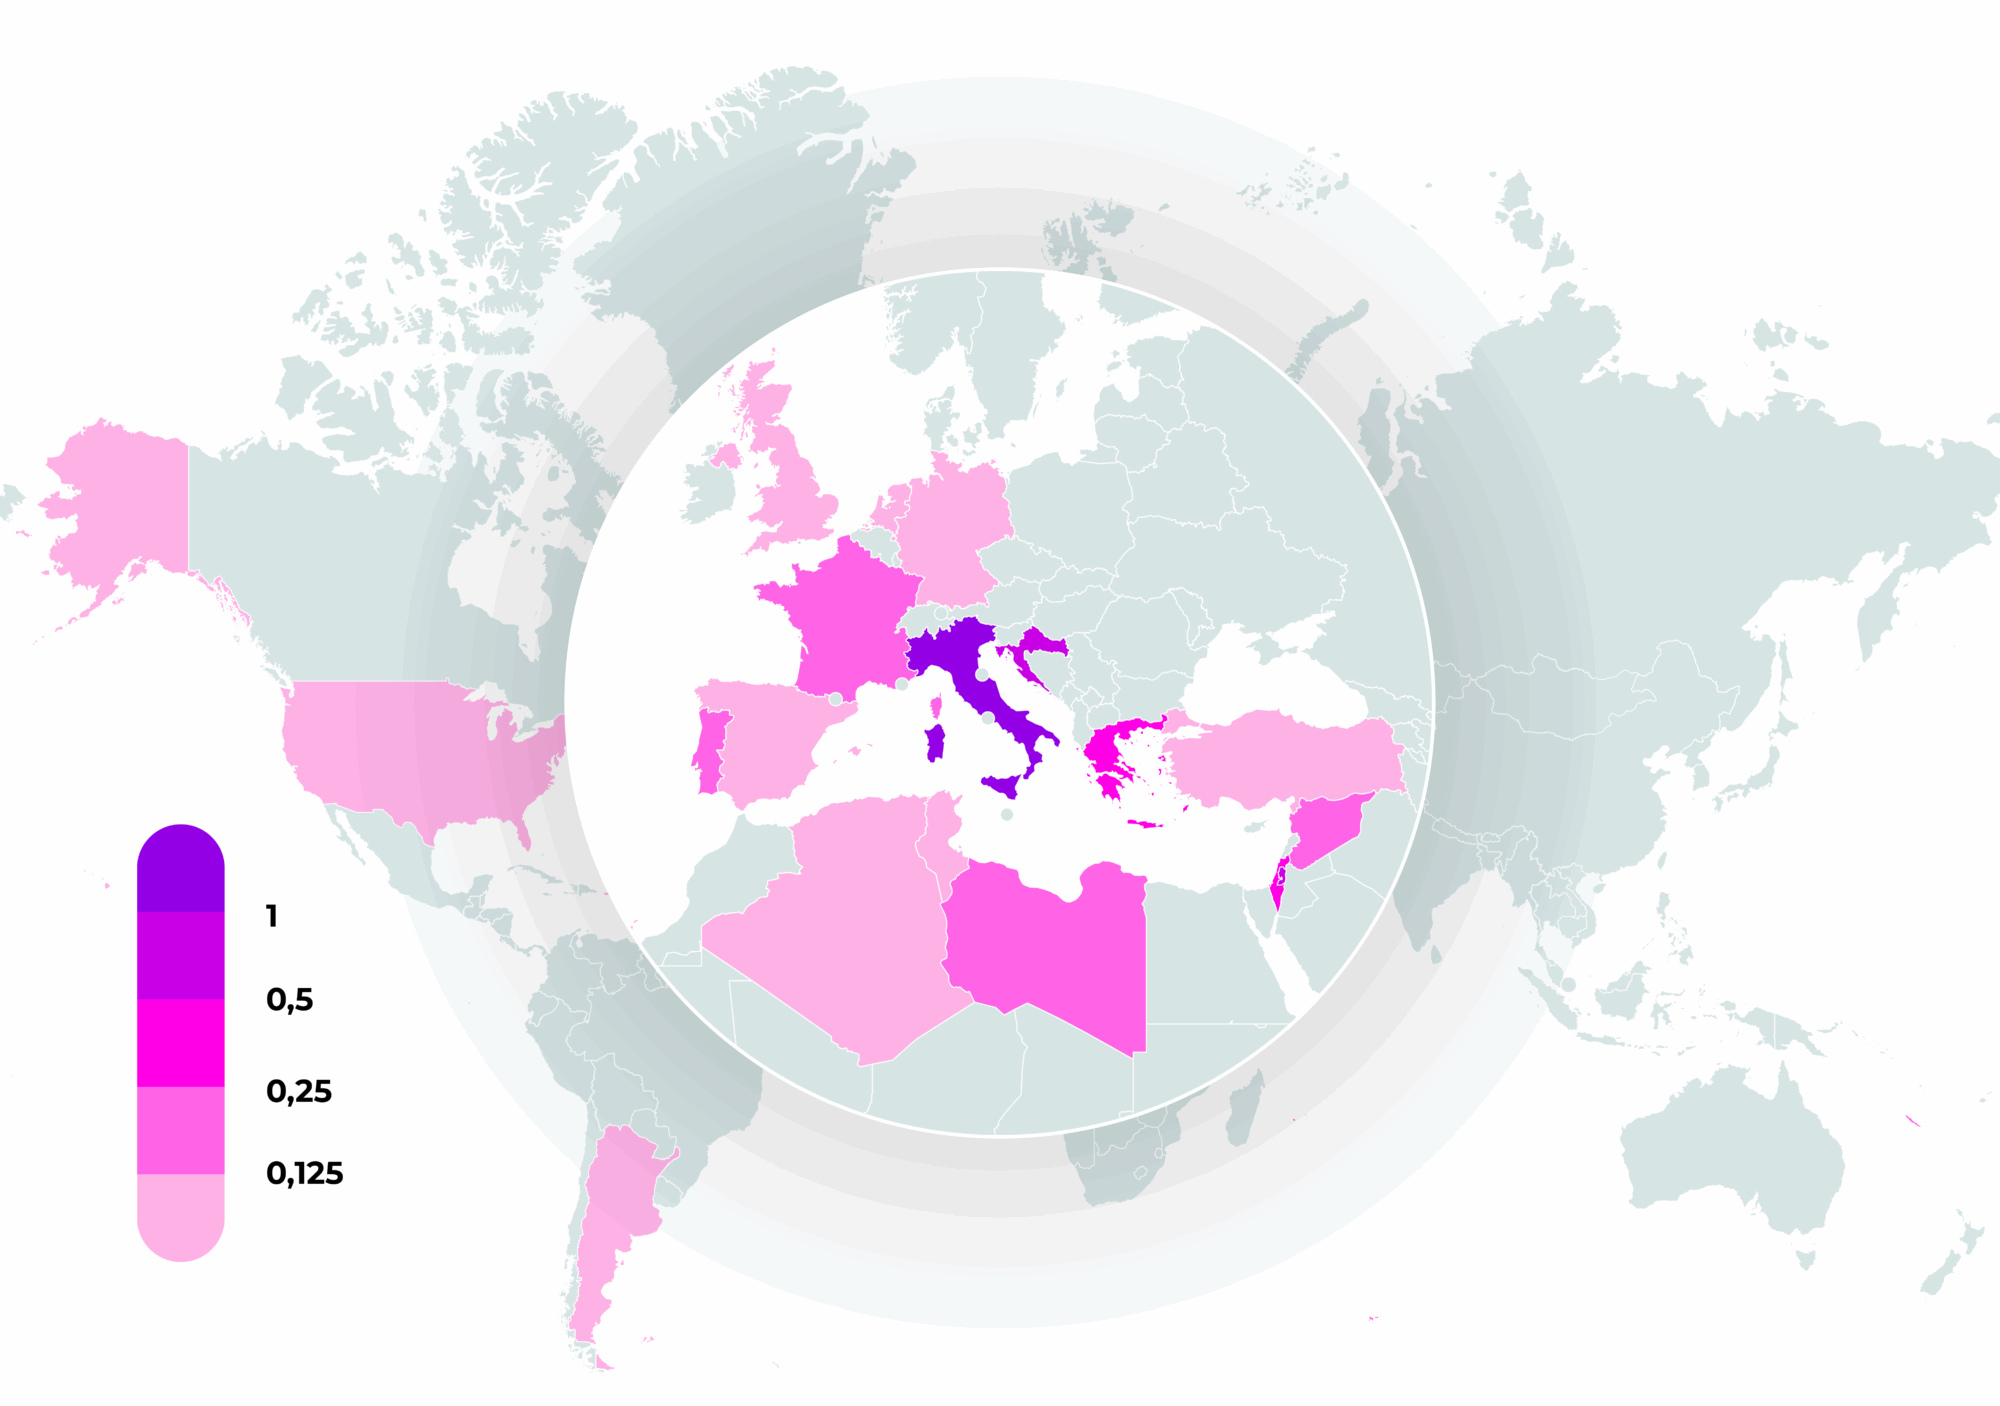
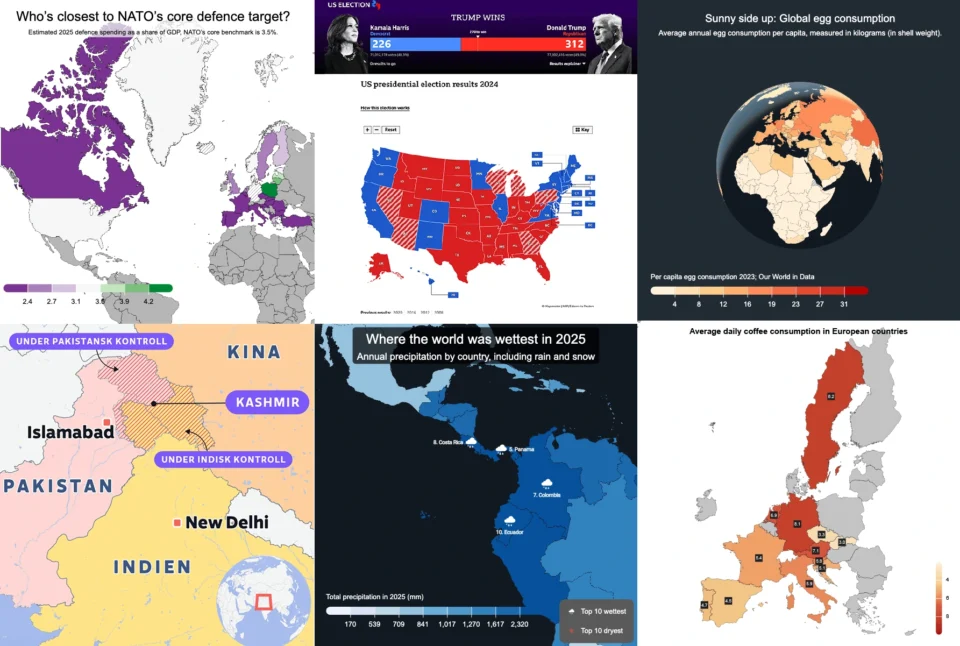
A choropleth map is a color-coded map that shows how values differ between geographic areas, such as countries, regions, or districts. Election results, population density, regional sales, risk levels, tourism numbers — when your data is linked to countries, regions, or other areas, a choropleth map helps people understand the pattern faster. Instead of asking […]

Read more

We just do maps. And that’s the point.

A good map often looks effortless, and that’s the whole point. But behind that simplicity are countless cartographic choices, design decisions, data layers, styling rules, and workflow details. That is where our decades of cartographic experience make all the difference. The longer you work with maps, the more you realize how much care they actually […]

Read more

Why bringing your own data can make for better maps

Some maps do not begin as maps. They begin as bits and pieces of information waiting to make sense together. They start in spreadsheets, route files, design folders, exports, downloads, and sometimes in a file name that has seen far too many versions of the word “final”. Useful, yes. Map-ready? Not always. Eventually, that data […]

Read more

What the 30 Day Map Challenge taught us about creativity (and Mapcreator)

Every November, cartographers, designers, and data nerds gather around the same global campfire: the 30 Day Map Challenge. The rules are simple: one map per day, one theme per day, 30 days straight. This year, Mapcreator joined the challenge, and let’s just say: it was intense, inspiring, and wildly rewarding. In 30 days, we’ve followed […]

Read more

How static, interactive, and animated maps win hearts (and clicks)

There’s a lot of competition for attention out there. Cat videos, doomscrolling, the latest season of [enter your favorite season here]…So, how do you make sure your data, story, or project doesn’t just get a polite glance before people move on? Answer: give it a map. Maps are natural attention magnets. They help us connect […]

Read more

Your 2026 Winter Olympics maps are here!

Italy is getting ready for the 2026 Winter Olympics. Snow, ice, roaring crowds, and at least one person asking if curling really requires athletic skill (spoiler: yes). No matter if you are preparing coverage for TV, online, or print, one thing is clear: you need accurate visuals to show where every event is taking place. […]

Read more
New feature ✨

New! Map animations, now on autopilot with auto-keyframe

We’ve all been there: you want to animate a camera smoothly along a winding route (or just from point A to B), but manually setting every single keyframe feels like… a lot. That’s why we built an auto-keyframe generator. Welcome your new favorite time-saver. Draw or import a path, click one button, and Mapcreator does […]

Read more
New feature ✨

New! Render Globe Maps as Vector Files

We don’t like world maps. There, we said it. Most world maps you come across are distorted. When you flatten a 3D planet onto a 2D surface, you always end up making compromises. That’s why we love globes! They let you see the world just as it really is. Mapcreator now supports globe rendering in vector files […]

Read more
New feature ✨

Import a spreadsheet with automatically numbered icons

If you’re manually placing numbered icons one by one onto a map, stop right there; we need to have a chat. There’s a better way. A faster, smarter, easier way. Over 1k locations to import? No problem. Enter: data binding in Mapcreator. With data binding, you can upload a spreadsheet that automatically adds locations with […]

Read more

Mapcreator’s default map styles for all your mapping needs

Whether you just need a simple map or you’re aiming for something with a bit more personality, Mapcreator’s built-in styles are a great place to start. They give you a solid base to bring your ideas to life. In addition to custom work, we offer a selection of ready-made map styles. You can use them […]

Read more

Create isolated country shape maps in Adobe Illustrator

A clear and focused map conveys a story faster than a thousand words. Isolated country maps, where just one area is highlighted without surrounding borders or visual clutter, are especially powerful in media and communications. And now, there’s a faster, more intuitive way to work with maps in your design workflow. Simply generate the map […]

Read more

How to create a flight map in Mapcreator 

From breaking news stories to travel magazines, flight maps help audiences visualize movement, distance, and connection at a single glance. From complex routes through various locations or simply moving a curved line from A to B, Mapcreator makes it easy to create a flight map in minutes. In this short guide, we’ll walk you through […]

Read more

Cut corners with Mapcreator’s Adobe After Effects extension

With Mapcreator’s new Adobe After Effects extension, journalists, broadcasters, and designers can now create professional-grade map animations directly within their existing workflow—without switching between different tools. In fast-paced news and broadcast environments, as well as for graphic and motion designers, delivering accurate, engaging visuals quickly is crucial. Whether covering breaking news, world events, or creating […]

Read more

Hidden features in Mapcreator you might not be using (but should!)

Mapcreator is a powerful tool for designing customized maps, but did you know it has some hidden features that can take your map-making to the next level? In this article, we’ll explore four lesser-known, yet incredibly useful tools within Mapcreator that can help you improve your maps. 1. Grid and label-free zone: fine-tune label placement […]

Read more
New feature ✨

Cyclone and typhoon live data overlay in Mapcreator

With cyclone and typhoon season coming closer, staying ahead of severe weather events is more important than ever. Mapcreator’s new cyclone and typhoon live data overlay provides real-time and interactive tracking. With this layer, you can always deliver timely and precise updates. The data is sourced from Joint Typhoon Warning Center (JTWC) and is updated […]

Read more

This content is available in English

Would you like to switch?

Diese Inhalte gibt's auch auf Deutsch

Möchtest du wechseln?

Contenu disponible en français

Changer de langue ?

Esta página está disponible en español

¿Te gustaría cambiar?

Deze pagina is ook beschikbaar in het Nederlands

Zullen we je doorverwijzen?