Pinned
NOAA NCEI
27.4K posts

NOAA NCEI
@NOAANCEI
National Centers for Environmental Information (NCEI), an office of @NOAA, is the Nation’s leading authority for environmental data.
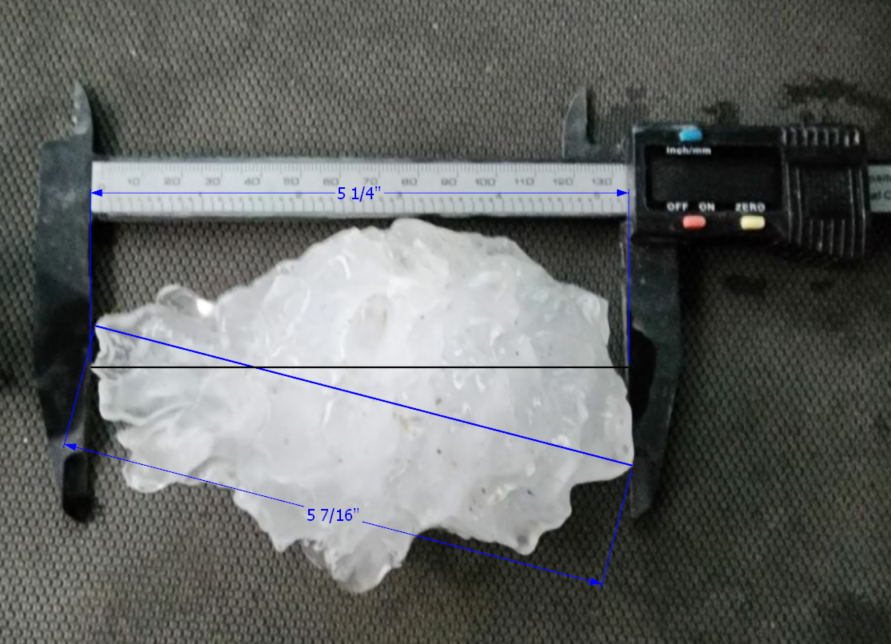
 #ICYMI, a record-setting ~6.4-inch hailstone fell in Hondo on April 28. Where in the hail is Hondo? Texas, silly, where everything is bigger. bit.ly/2U0d1zh
- We’re comparing recent events to expectations of future climate at #AMS2017: bit.ly/NCEIatAMS17 #NCEIatAMS
 00:00
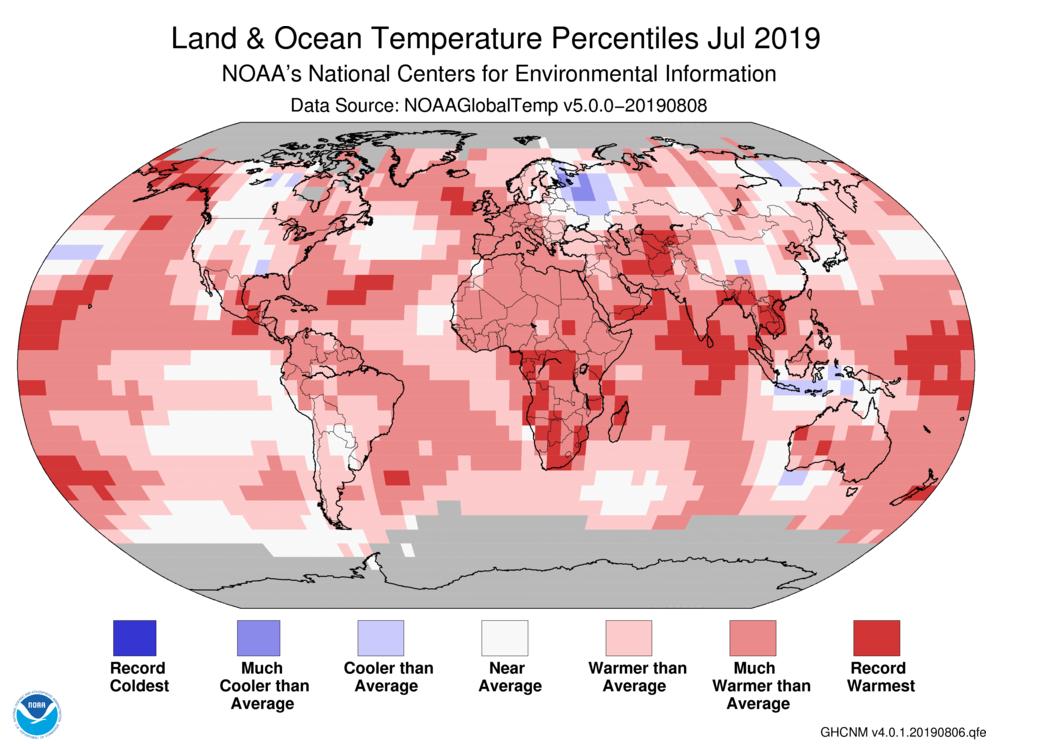
00:00 - Replying to @NOAANCEIAt 1.71°F above average, the July 2019 global temperature ranked as the warmest July and the warmest month on record: bit.ly/Global201907 #StateOfClimate
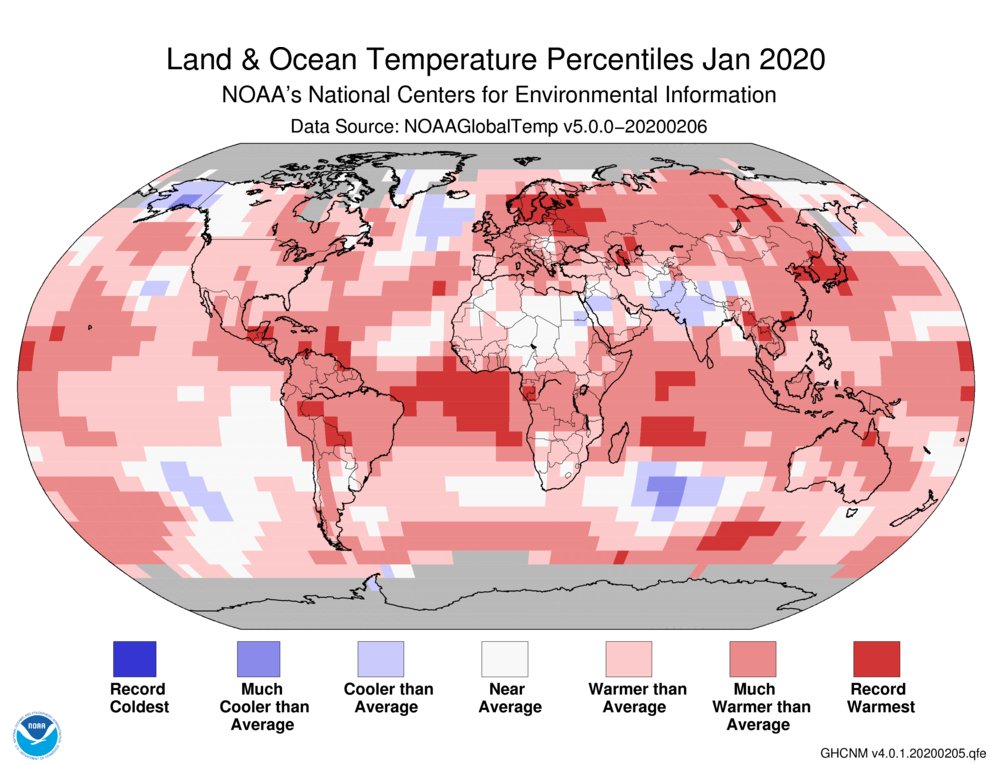
- Replying to @NOAANCEIAt 2.05°F (1.14°C) above average, the January 2020 global temperature ranked as the warmest January on record: bit.ly/Global202001 #StateOfClimate
- RELEASED: Global Climate Report for August 2023. Learn more about significant global weather and climate events and how they compare to the historical record: bit.ly/Global202308 #StateOfClimate

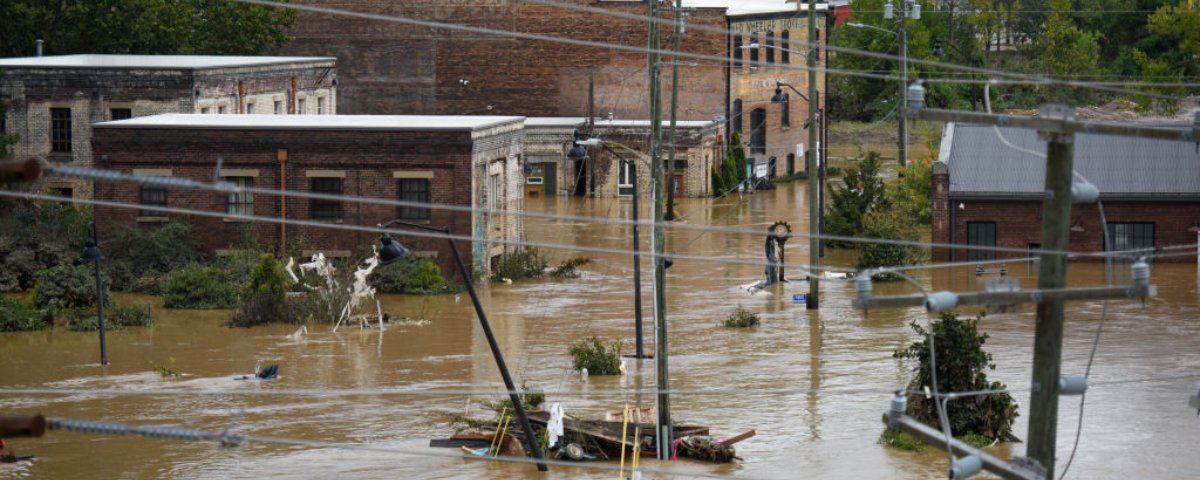
- NCEI headquarters in Asheville, NC, has been severely impacted by Hurricane Helene. We’re grateful to report that all employees and staff have been accounted for and all data holdings are safe, though archived data is currently unavailable. More info: ncei.noaa.gov/news/helene-de…
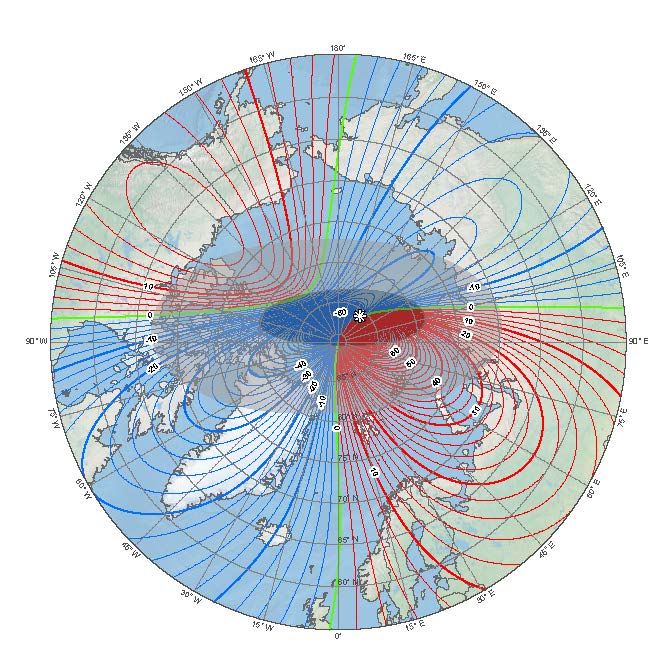
- NCEI has released the World Magnetic Model 2025 that tracks changes in Earth’s magnetic field: bit.ly/WMM2025 @NOAA @BritGeoSurvey @NGA_GEOINT @CIRESnews
- El Niño is here, but how do we know that? Turns out scientists look at a LOT of different environmental factors to figure that out. Learn more about how NCEI products help scientists detect and track ENSO phase: bit.ly/NCEIENSOData @NWSCPC @NOAAClimate

- El Niño has arrived right before winter! If you live in the Midwest, Great Lakes region, or Missouri River basin, our Regional Climate Centers have just released region-specific El Niño impact summaries to prepare you for winter this year. ❄️ Read more at: bit.ly/3tQSI9l

- Happy National Weatherperson’s Day! Celebrate your current or former weather friends today, in honor of John Jeffries. He began to record weather data in 1774! @NWSWPC @NWS bit.ly/3ui1jAc ⛅

- If you hear “El Niño” and just think about tropical season forecasts, you’re not alone. We’re here to tell you that ENSO can impact much more! Learn about potential global weather, water, and climate impacts and how NCEI data help scientists study them: bit.ly/NCEIENSOData

- June 8: Extreme and exceptional drought expanded in northern and central CA, and along the central CA coast. Exceptional drought expanded in central UT. Large areas of exceptional drought persist in CA, NV, UT, AZ, and NM. drought.gov #DroughtMonitor #CAwx

- A State Climate Extremes Committee said “Hail yes!” to a new state hail diameter record set near Kirk, CO on Aug 8, 2023. Besides its impressive 5.25” in diameter, the stone raised questions too. @NWS @NWSGoodland @IBHS_org @ColoradoClimate pulse.ly/mhf08o3gb8