Log inSign up
ESA Earth Observation
European Space Agency
31K posts
Image
user avatar
ESA Earth Observation
European Space Agency
@ESA_EO
@esa #EarthObservation: Taking the pulse of our planet from space. Please see our Privacy Notice: esa.int/connectwithus
esa.int/Our_Activities…
Joined April 2011
2,722
Following
144.4K
Followers
  • user avatar
    ESA Earth Observation
    European Space Agency
    @ESA_EO
    Jun 9
    Good news: economic growth doesn’t have to come at the expense of air quality. Using @CopernicusEU Sentinel-5P data, researchers found many major cities are growing while cutting NO₂ - read the full story⬇️ esa.int/Applications/O…
    Image
    Image
    22K
  • user avatar
    ESA Earth Observation
    European Space Agency
    @ESA_EO
    May 27
    Are you feeling the heat too?🥵 A heatwave is driving temperatures far above average across much of Western Europe and the UK, with record May temperatures reported in several countries. This map shows land surface temperatures across Europe, using @CopernicusEU Sentinel-3 data
    Map of Europe showing land surface temperatures on 26 May 2026, with a colour scale ranging from blue (cooler, below 10 °C) to dark red (very hot, above 50 °C). Large areas of Western and Southern Europe appear in orange and red, indicating high surface temperatures during a heatwave, particularly over Spain, France, Italy and the UK. Northern and northeastern regions, including Scandinavia and parts of Eastern Europe, are shown in lighter colours and blue, indicating cooler conditions. Major cities including London, Paris, Madrid, Rome and Budapest are marked.
    62K
  • user avatar
    ESA Earth Observation
    European Space Agency
    @ESA_EO
    May 4
    Two national EO missions were launched yesterday onboard a @SpaceX Falcon-9 rocket: 🛰️Italy's @IrideSpazio (esa.int/Applications/O…) 🛰️Greece's Hellenic Fire System (esa.int/Applications/O…) Credits: SpaceX
    Image
    Image
    17K
  • ESA Earth Observation reposted
    user avatar
    Josef Aschbacher
    European Space Agency
    @AschbacherJosef
    Apr 22
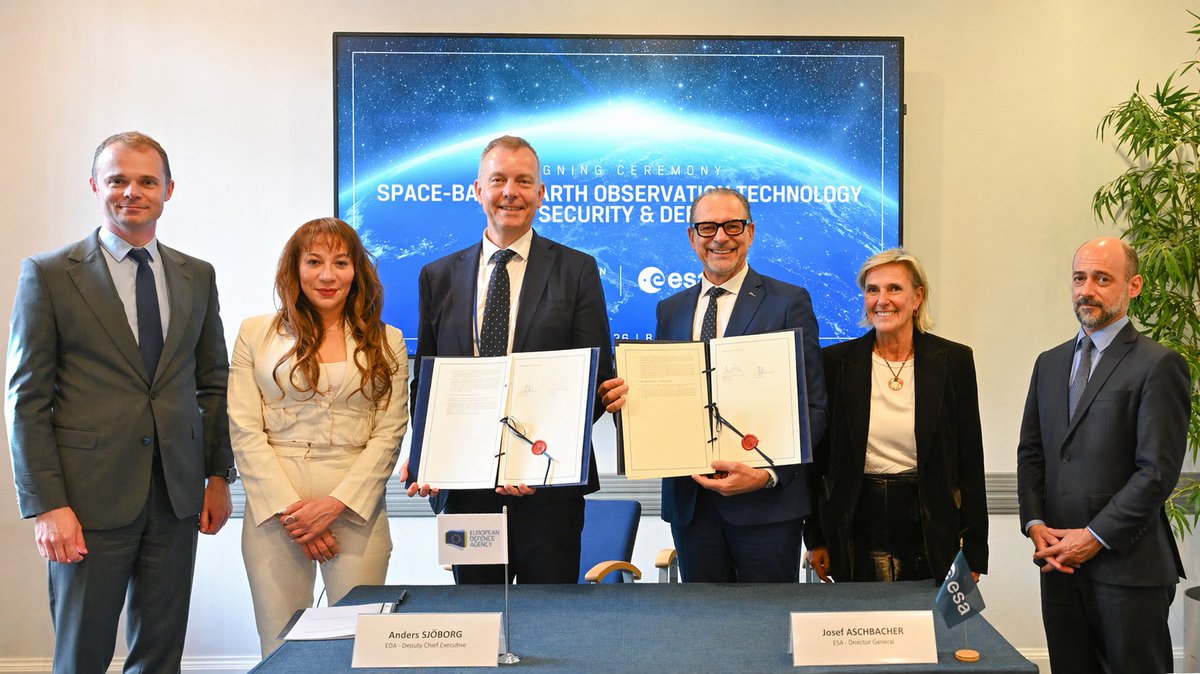
    Following the mandate given by our Member States to step up @esa’s role in security and defence, this agreement marks a meaningful move from intent to delivery. Through initiatives such as the European Resilience from Space (ERS), ESA is already responding to Europe’s urgent
    user avatar
    European Defence Agency
    @EUDefenceAgency
    Apr 22
    👩‍🚀 On 22 April, we signed an arrangement with @esa to better study space-based Earth observation technology for #security and #defence. ➡️ Read more: tinyurl.com/2utscdyd
    Image
    Image
    31K
  • user avatar
    ESA Earth Observation
    European Space Agency
    @ESA_EO
    Mar 24
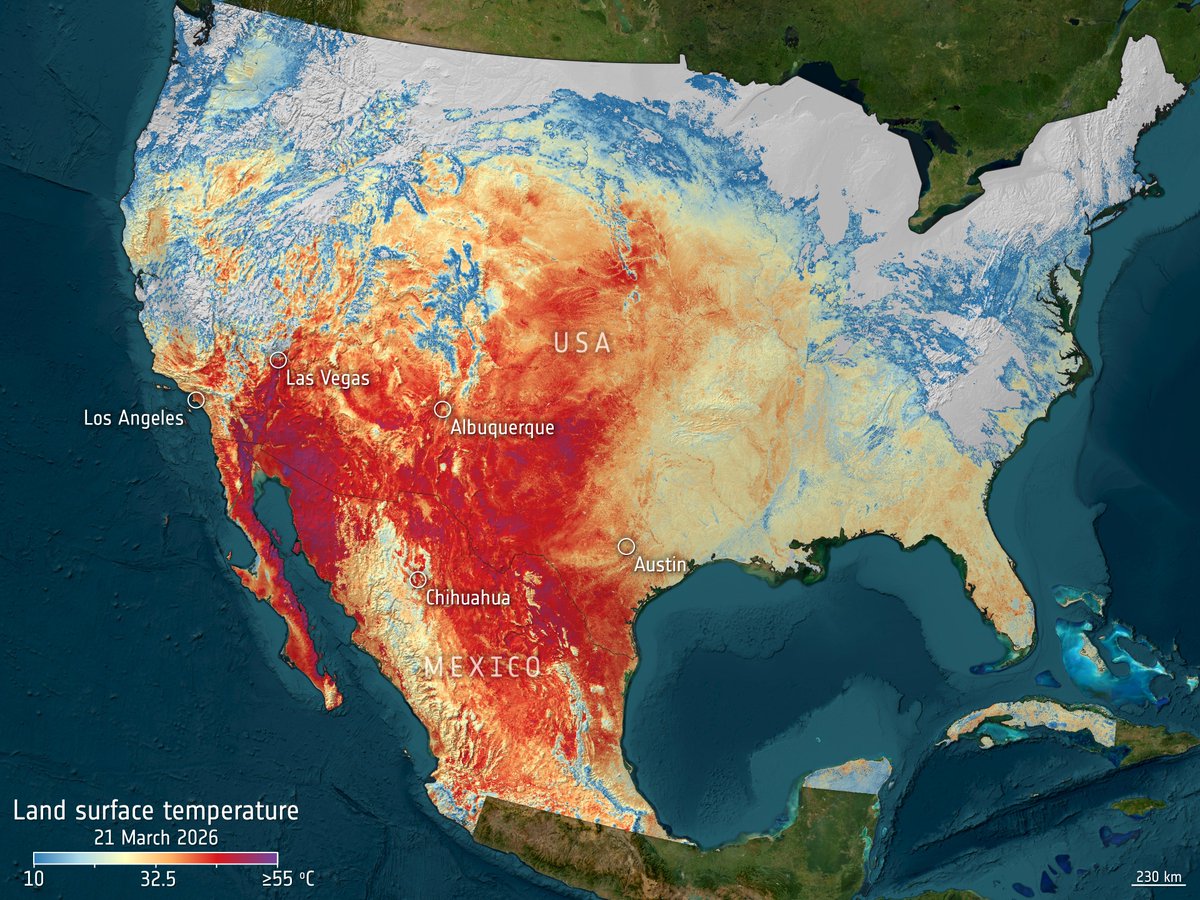
    It's hot - and we can "see" it from space: On 21 March, Copernicus Sentinel-3 measured widespread land surface temperatures exceeding 40°C🥵 Recent extreme heat across the central and southwestern US and Mexico pushed ground temperatures far above seasonal norms according to
    Map showing land surface temperatures across the U.S. and Mexico on 21 March 2026, with intense red heat over the Southwest and Mexico and cooler blue tones in northern and eastern regions.
    Satellite image of Antelope Valley (on 20 March) featuring a patchwork of agricultural fields and desert terrain, with geometric plots bordered by nearby mountains.
    Satellite image of Grass Valley (on 20 March) showing a rugged desert landscape with rocky outcrops and sandy flats in shades of brown, red, and yellow.
    5.4K
  • ESA Earth Observation reposted
    user avatar
    European Space Agency
    @esa
    Mar 11
    #MediaInvitation: journalists are invited to join a one‑off opportunity to see three ESA-built satellites in their final preparations before liftoff, at @Thales_Alenia_S, Cannes, on 16 April 2026. Register by 31 March 👉 esa.int/Newsroom/Press…
    The Second MTG-Imager in the thermal vacuum chamber, at Thales Alenia Space's Cannes clean room.
    16K
  • user avatar
    ESA Earth Observation
    European Space Agency
    @ESA_EO
    Feb 20
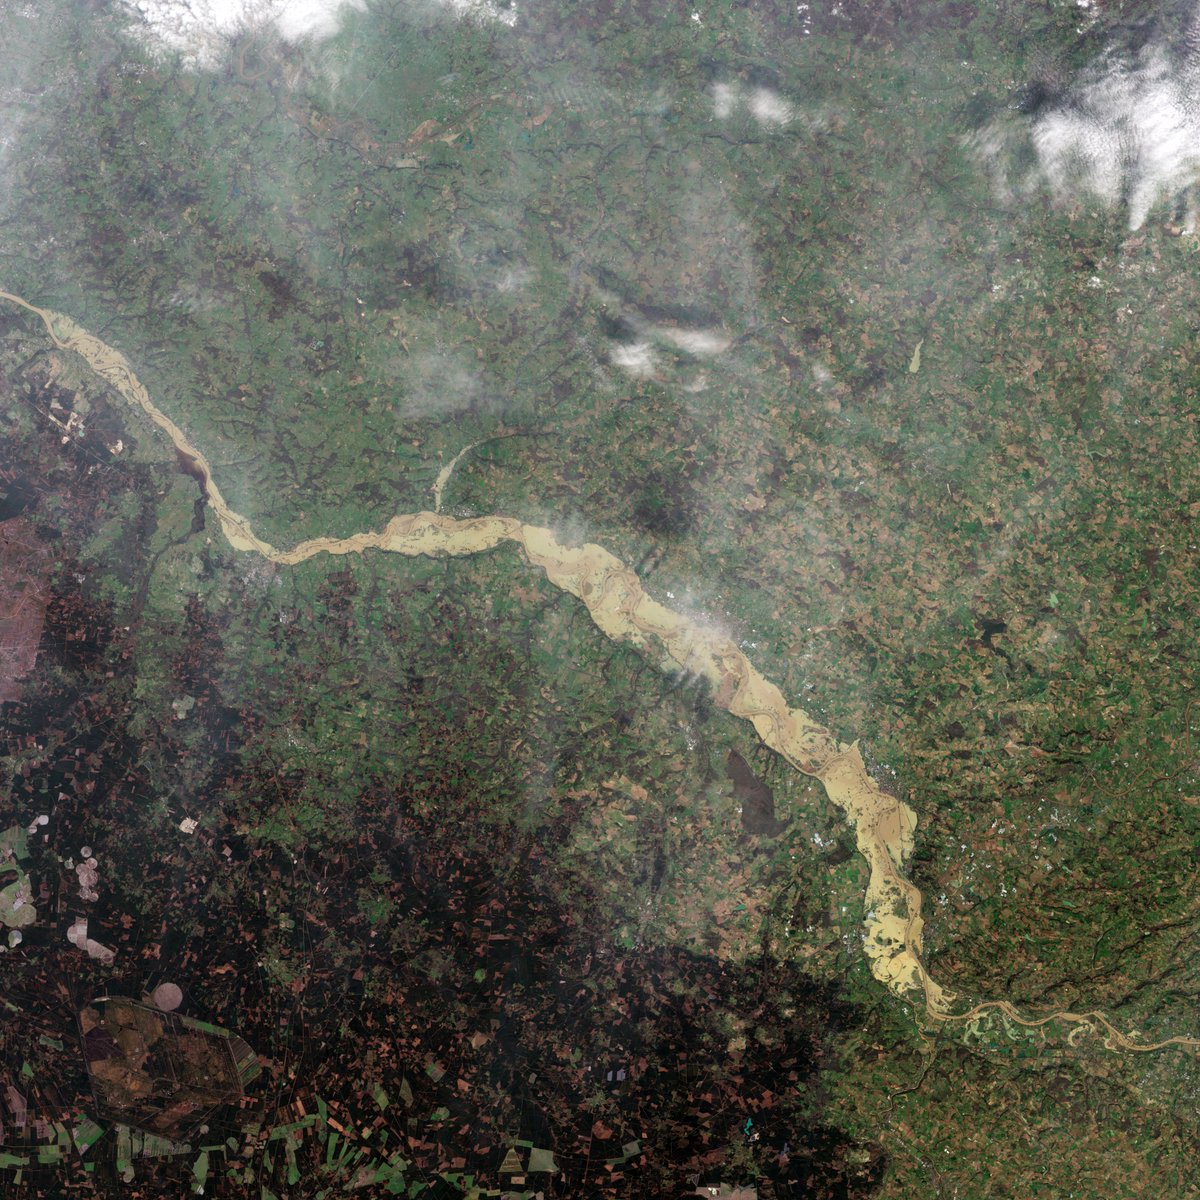
    France has endured 35 consecutive days of rain. One striking example: According to @Vigicrues, the Garonne at Marmande rose from 3.50 m on 10 February to over 10 m by 14 February. Here are 3 images that show the impact of the heavy rainfall from space: • Accumulated rainfall
    Graph showing accumulated rainfail between 9-17 February 2026
    Copernicus Sentinel‑1 radar image showing flooded areas in red
    Copernicus Sentinel‑2 true‑colour view of the same region
    26K
  • user avatar
    ESA Earth Observation
    European Space Agency
    @ESA_EO
    Feb 18
    What does the latest research tell us about Earth's changing climate? The '10 New Insights in Climate Science 2025' report highlights ten key findings, including accelerating ocean warming, record‑breaking global heat and reduced carbon uptake on land. Read more:
    Image
    00:00
    87K
  • user avatar
    ESA Earth Observation
    European Space Agency
    @ESA_EO
    Feb 12
    🆕You can now follow our news/images/updates/quizzes on Bluesky: bsky.app/profile/esaear…
    2.6K
  • ESA Earth Observation reposted
    user avatar
    Josef Aschbacher
    European Space Agency
    @AschbacherJosef
    Feb 12
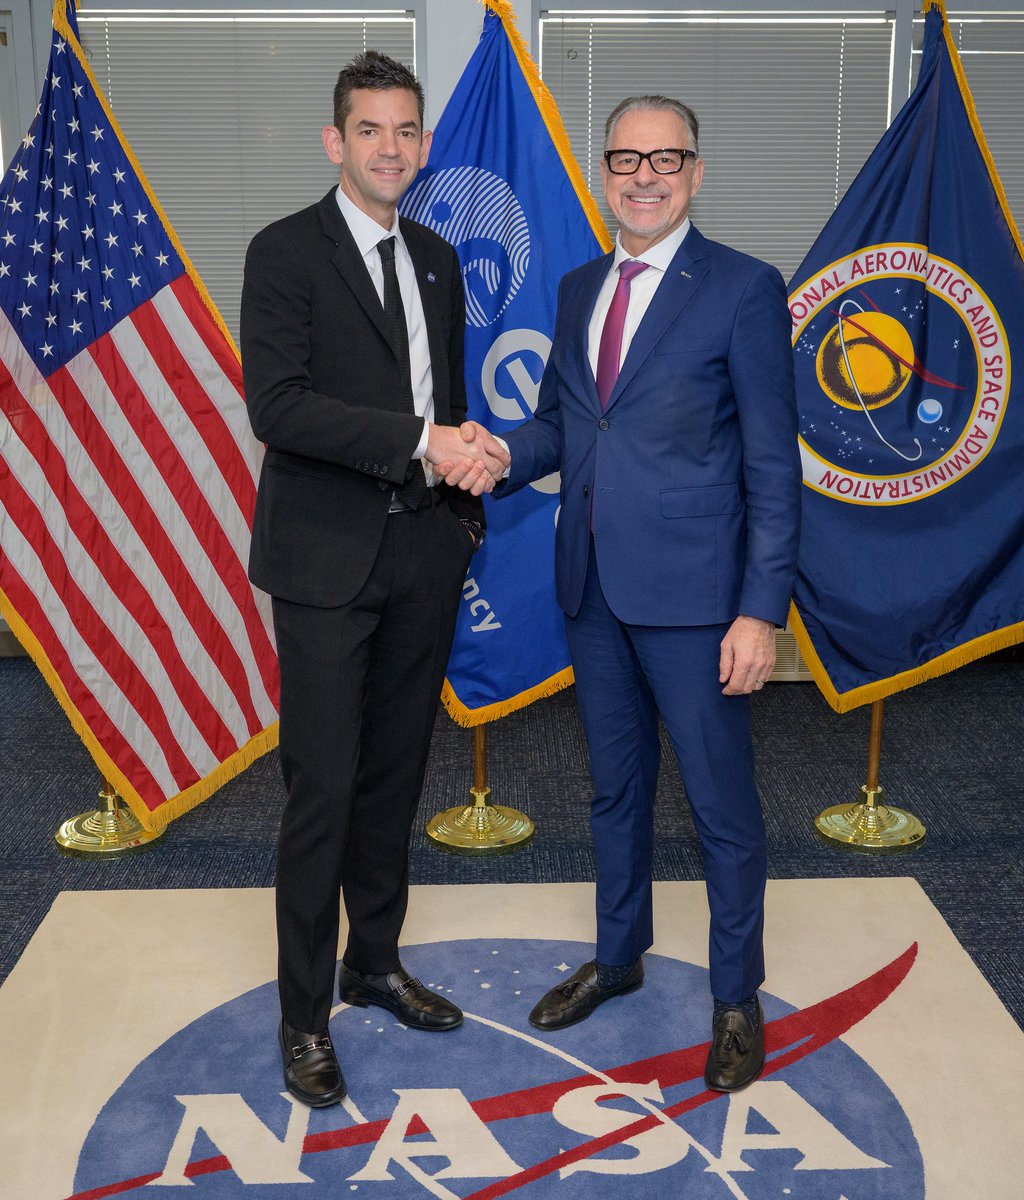
    I had a constructive first meeting in Washington, D.C. with my counterpart at NASA, @NASAAdmin. We had a very constructive discussion on space exploration and are fully aligned on our shared objectives: the Moon, LEO, and Mars. Looking forward to continuing the discussions.
    user avatar
    NASA Administrator Jared Isaacman
    NASA
    @NASAAdmin
    Feb 11
    I was pleased to welcome Director General @AschbacherJosef and our @esa partners to NASA Headquarters today. As we move forward with our return to the Moon, the European Space Agency remains a key partner across much of NASA’s portfolio. Their contributions will be important as
    Image
    26K
  • user avatar
    ESA Earth Observation
    European Space Agency
    @ESA_EO
    Feb 10
    Three winter storms — Kristin, Leonardo and Marta — soaked the Iberian Peninsula in early 2026. 🌧️ Rainfall maps show areas in Portugal and Spain receiving 250+ mm in a week. 🌊 Copernicus Sentinel‑1 radar reveals major flooding along Portugal’s Tejo River, comparing Feb 2026
    A satellite‑derived map showing accumulated rainfall over the Iberian Peninsula from 1 to 7 February 2026. Western Portugal and parts of northwestern Spain appear in deep red, indicating more than 250 millimetres of rainfall. Surrounding areas are shown in shades of blue, representing lower rainfall totals. Cities including Lisbon, Vigo, Madrid and Marbella are labelled. A legend at the bottom right displays rainfall values from 0 to over 250 millimetres.
    A radar‑based comparison image of the Tagus River region in Portugal using Copernicus Sentinel‑1 data from 27 December 2025 and 7 February 2026. Flooded areas are highlighted in bright red, spreading along the river and its tributaries northeast of Lisbon. The surrounding landscape appears in grey‑blue tones. Coastal areas and inland terrain are clearly visible, with a scale bar indicating 10 kilometres and a date label in the lower right corner.
    35K
    user avatar
    ESA Earth Observation
    European Space Agency
    @ESA_EO
    Feb 10
    Images and more info are available here:
    Image
    Intense rainfall brings floods across Iberian Peninsula
    From esa.int
    2.8K
  • user avatar
    ESA Earth Observation
    European Space Agency
    @ESA_EO
    Feb 6
    During Covid, air pollution dropped — but methane levels rose. Now we know why: 1️⃣ Lockdowns reduced emissions of nitrogen oxides, carbon monoxide and other pollutants. 2️⃣ These gases help form hydroxyl radicals — the atmosphere’s “detergent” that removes methane. 3️⃣ With fewer
    Image
    GIF
    6.1K
  • user avatar
    ESA Earth Observation
    European Space Agency
    @ESA_EO
    Feb 3
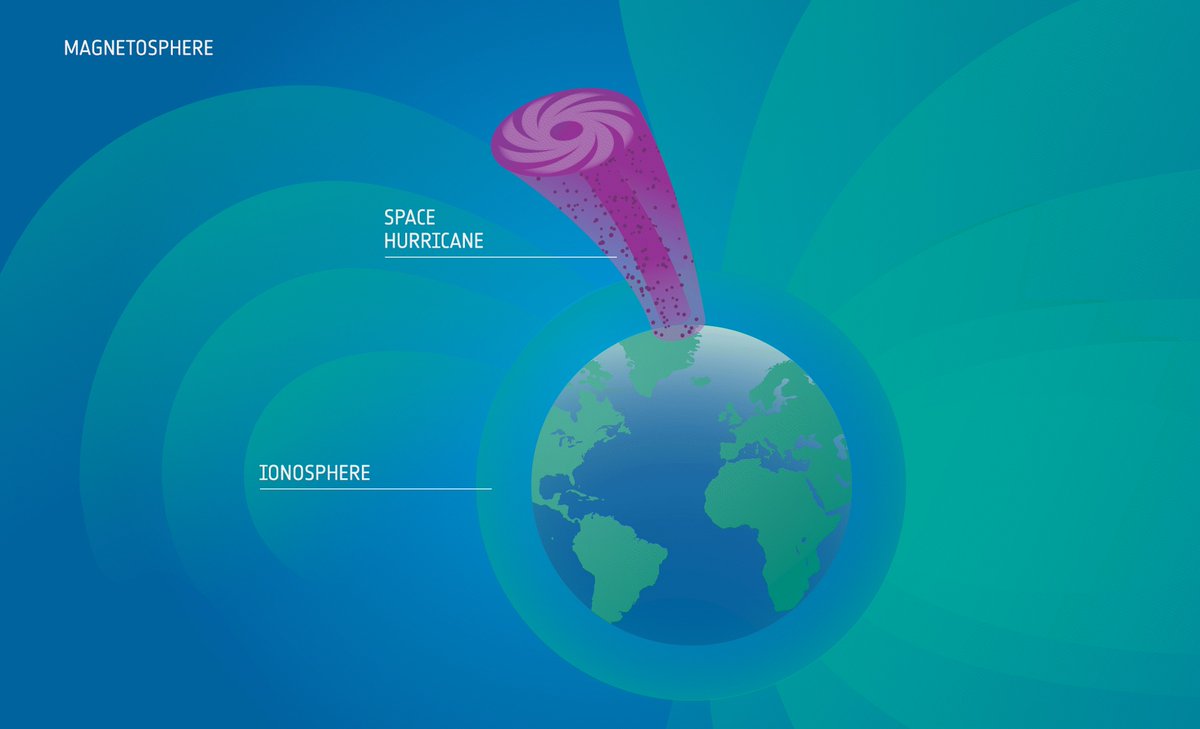
    Data from @esa_swarm have helped scientists study a recently discovered phenomenon: space hurricanes. These spiral storms of charged particles high above the poles can disrupt satellites, navigation and power grids — and the data show they can form even when geomagnetic activity
    Artist's impression of where a space hurricane forms on Earth
    6.4K

New to X?

Sign up now to get your own personalized timeline!

Create account

By signing up, you agree to the Terms of Service and Privacy Policy, including Cookie Use.

Terms of Service|Privacy Policy|Cookie Policy|Accessibility|Ads info|© 2026 X Corp.
Don't miss what's happening
People on X are the first to know.
Log inSign up
Advertisement
Advertisement