Log inSign up
Electricity Maps
644 posts
Image
user avatar
Electricity Maps
@ElectricityMaps
Mapping the climate impact of electricity, worldwide, and in real-time.
Copenhagen
electricitymaps.com
Joined June 2018
16
Following
20.5K
Followers
  • user avatar
    Electricity Maps
    @ElectricityMaps
    Feb 4, 2021
    Year in review 2020 Better late than never. As tradition here's Europe throughout 2020 on electricityMap ⚡️
    Image
    00:00
  • user avatar
    Electricity Maps
    @ElectricityMaps
    Jan 7, 2020
    As is the tradition, here's the year 2019 as seen on @electricitymap. Not all countries are green 24/7!
    Image
    00:00
  • user avatar
    Electricity Maps
    @ElectricityMaps
    Jan 18, 2022
    We know you have been waiting for it for a whole year and the time has finally come - our electricityMap 2021 review is out for Europe!🌍 Can you guess which region we'll share next? Check out our map for a hint app.electricitymap.org/map 👀 #electricitymap
    Image
    00:00
  • user avatar
    Electricity Maps
    @ElectricityMaps
    Dec 13, 2024
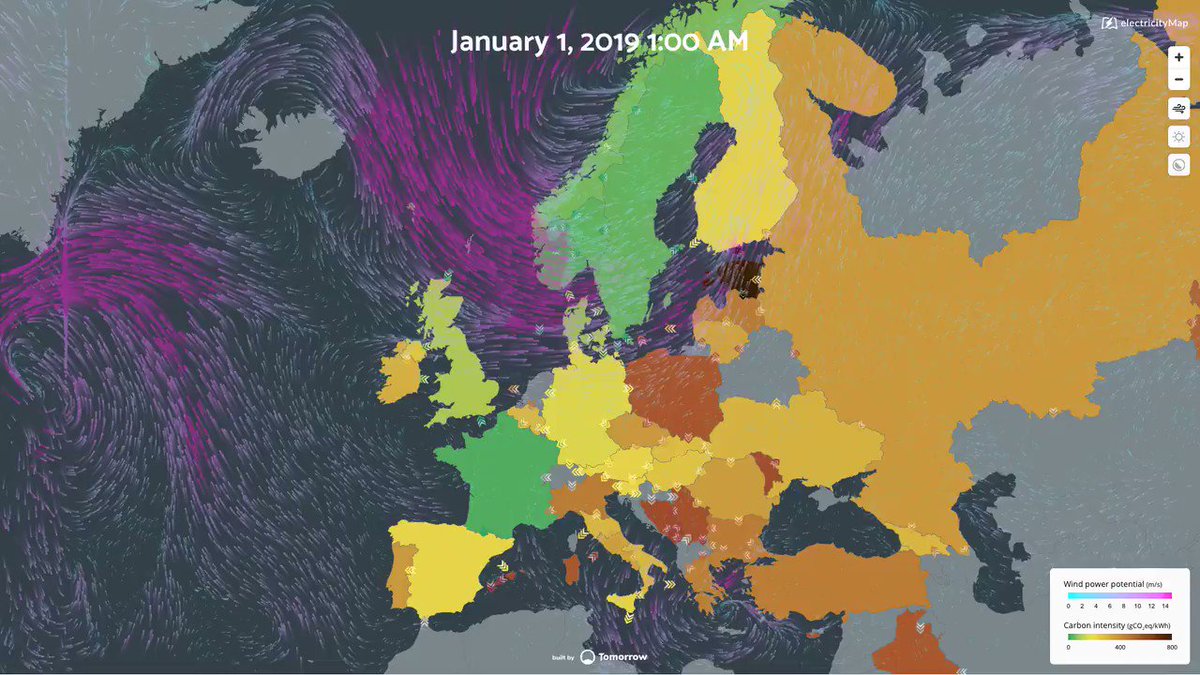
    A large dunkelflaute hits Europe! As dark settled in at 5pm yesterday, both wind and solar generation flatlined across the region. Energy prices in Denmark and Germany surged to €936/MWh as utilities scrambled to meet peak demand with limited renewable output. A stark reminder
    Image
    307K
  • user avatar
    Electricity Maps
    @ElectricityMaps
    Mar 3, 2025
    The big update you’ve been waiting for: China is now live on Electricity Maps! 🇨🇳 Alongside other recently added regions, we’ve expanded our coverage to deliver real-time grid data on our app and API for one of the world’s most crucial energy markets. Explore it on the app:
    Image
    34K
  • user avatar
    Electricity Maps
    @ElectricityMaps
    Jan 23, 2025
    🌎 We’re moving fast toward global coverage: Electricity Maps has just added over 110 new countries to the platform. With greater coverage, we are equipping key drivers of change to reduce emissions and advance sustainability efforts — no matter where they operate. Learn more:
    Image
    18K
  • user avatar
    Electricity Maps
    @ElectricityMaps
    Jan 26, 2023
    The yearly review for the EU is here 👀 Watch the #carbonintensity evolve throughout 2022 across Europe. Our yearly review allows you to see how the carbon intensity fluctuates throughout weeks and months. Go to app: app.electricitymaps.com/map?utm_source… #carbonemissions #electricitymarkets
    Image
    00:00
    96K
  • user avatar
    Electricity Maps
    @ElectricityMaps
    May 15, 2024
    Replying to @HannoKlausmeier
    You are comparing life-cycle analysis (LCA) emissions to direct emissions - in case you don't know what the difference is or forgot it, we have some nice documentation here:
    Image
    Default emission factors
    From github.com
    14K
  • user avatar
    Electricity Maps
    @ElectricityMaps
    Apr 28, 2025
    🚨 Grid alert - Major power outage in Spain and Portugal (Spanish version below) The Iberian network was automatically disconnected from the European grid at 12:38 PM CET, leaving millions without power. This major power blackout hit Spain and Portugal, also affecting Andorra
    Image
    32K
  • user avatar
    Electricity Maps
    @ElectricityMaps
    May 14, 2024
    Replying to @HannoKlausmeier
    Hey @HannoKlausmeier, we already responded to your comments when you posted the same text last year, but here it is again: x.com/pierre_segonne… We are happy to discuss the specific arguments you raise and how we could improve if you are also open to listening :) All said, we
    14K
  • user avatar
    Electricity Maps
    @ElectricityMaps
    Apr 14, 2021
    We’re very happy to finally be able to add Switzerland🇨🇭to @electricityMap! Thanks for the work @swissgridag @BFEenergeia and the many contributors💪! energeiaplus.com/2021/04/14/ele…
    Image
  • user avatar
    Electricity Maps
    @ElectricityMaps
    Dec 22, 2018
    The year 2018 of electricitymap.org condensed in under 3 minutes. #climatechange #electricitymap Full video at youtube.com/watch?v=GxB91I…
    Image
    00:00
  • user avatar
    Electricity Maps
    @ElectricityMaps
    May 15, 2024
    Replying to @HannoKlausmeier
    To be honest, that question seems a bit irrelevant here - the question is rather why you on purpose compare two incomparable sources and present it as if they are using the same data?
    3.3K
  • user avatar
    Electricity Maps
    @ElectricityMaps
    Feb 6, 2024
    Europe's 2023 electricity mapped! See grid-related carbon emissions evolution across Europe. See hourly grid emissions on the map and daily country variations in our race chart. How did your country do? Explore the data: electricitymaps.com/electricity-ma…
    Image
    00:00
    20K

New to X?

Sign up now to get your own personalized timeline!

Create account

By signing up, you agree to the Terms of Service and Privacy Policy, including Cookie Use.

Terms·Privacy·Cookies·Accessibility·Ads Info·© 2026 X Corp.
Don't miss what's happening
People on X are the first to know.
Log inSign up
Advertisement
Advertisement