Log inSign up
FedResearch
2,795 posts
Image
user avatar
FedResearch
@FedResearch
The analysis and conclusions set forth are those of the authors and do not indicate concurrence by other members of the research staff or the Board of Governors
Washington, D.C.
federalreserve.gov/econres.htm
Joined August 2019
7
Following
22.1K
Followers
  • user avatar
    FedResearch
    @FedResearch
    Jul 12, 2022
    Why does the short-term slope of the yield curve predict recessions? (1/3) federalreserve.gov/econres/notes/…
    Figure 3. Expected Path of the Policy Gap, Core Inflation and Probability of Recession under Two Scenarios. This chart shows the expected paths of the policy gap, core inflation, and recession probabilities in the baseline scenario (blue line) and the tighter scenario in which monetary policy becomes restrictive in 2023 (red line).
  • user avatar
    FedResearch
    @FedResearch
    Sep 24, 2021
    New #FEDSPaper Why Do We Think That Inflation Expectations Matter for Inflation? (And Should We?) go.usa.gov/xMRNv #EconTwitter
  • user avatar
    FedResearch
    @FedResearch
    Jun 24, 2024
    Higher inflation can lead to greater efficiency. It all has to do with the price dispersion that inflation generates, which might motivate some consumers to search for the lowest prices, increasing competition among sellers. federalreserve.gov/econres/feds/i… #FEDSPaper
    Board of Governors of the Federal Reserve System
    federalreserve.gov
    Inflation, Price Dispersion, and Welfare: The Role of Consumer Search
    The Federal Reserve Board of Governors in Washington DC.
    468K
  • user avatar
    FedResearch
    @FedResearch
    Dec 26, 2019
    Research shows recent tariffs associated with reductions in manufacturing employment: a positive effect from lower import competition offset by negative effects from rising input costs & retaliatory tariffs. Tariffs also lead to higher factory-gate prices. go.usa.gov/xpHw5
    Image
  • user avatar
    FedResearch
    @FedResearch
    Aug 4, 2022
    Did fiscal stimulus fuel #inflation during the Covid-19 pandemic? This #IFDPPaper research argues that it might, with effect spreading across countries: federalreserve.gov/econres/ifdp/d… #EconTwitter (1/3)
    Figure 2. Real Consumption and Industrial Production during the pandemic
  • user avatar
    FedResearch
    @FedResearch
    Sep 7, 2022
    Decline in interest and tax expenses is responsible for a full 1/3 of all corporate profit growth over the prior 2 decades. This boost is unlikely to continue, indicating notably lower profit growth, and thus stock returns, in the future: federalreserve.gov/econres/notes/… #FedResearch
    Figure 5. Real growth indicators for S&P 500 nonfinancial firms
  • user avatar
    FedResearch
    @FedResearch
    Oct 11, 2024
    Who's driving consumer spending? It's middle- and high-income households! They're the ones fueling strong spending growth on retail goods and food services, while spending by low-income households has been flat. See this new #FEDSNote for more information:
    Board of Governors of the Federal Reserve System
    federalreserve.gov
    A Better Way of Understanding the US Consumer: Decomposing Retail Spending by Household Income
    The Federal Reserve Board of Governors in Washington DC.
    32K
  • user avatar
    FedResearch
    @FedResearch
    May 24, 2023
    New #FEDSPaper: The authors build a new measure of credit and financial market sentiment from Twitter data. They find that the Twitter Financial Sentiment Index (TFSI) helps predict intraday stock market returns. (1/2) federalreserve.gov/econres/feds/m… #EconTwitter
    Twitter Financial Sentiment Index
    63K
  • user avatar
    FedResearch
    @FedResearch
    Dec 18, 2019
    Welcome to the official Twitter research account of the @federalreserve. @FedResearch highlights new research in the Board’s working papers & notes series, staff articles, & conferences. In Dec, we will also tweet research published in Nov. go.usa.gov/xpGyc #EconTwitter
    Image
  • user avatar
    FedResearch
    @FedResearch
    Aug 9, 2024
    FR-HANK, a new quantitative heterogeneous agent model, successfully predicts the decumulation rate of pandemic-era excess savings. (1/2) federalreserve.gov/econres/feds/t…  #FEDSPaper #EconTwitter
    Board of Governors of the Federal Reserve System
    federalreserve.gov
    The Macroeconomic Effects of Excess Savings
    The Federal Reserve Board of Governors in Washington DC.
    14K
  • user avatar
    FedResearch
    @FedResearch
    Jan 20, 2023
    New research on the financial and macroeconomic factors that are useful in recession prediction. federalreserve.gov/econres/feds/r… #FEDSPaper #EconTwitter
    Board of Governors of the Federal Reserve System
    federalreserve.gov
    Recession Signals and Business Cycle Dynamics: Tying the Pieces Together
    The Federal Reserve Board of Governors in Washington DC.
    27K
  • user avatar
    FedResearch
    @FedResearch
    Sep 25, 2023
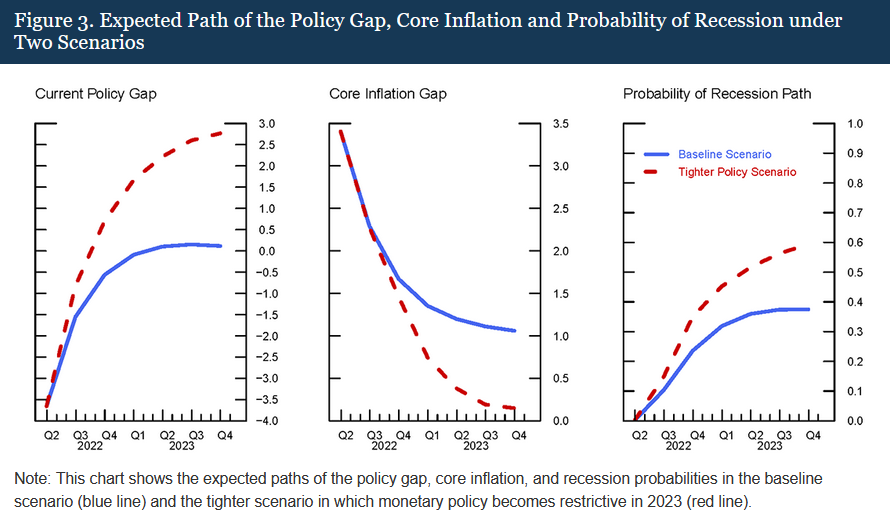
    The path of inflation since the beginning of COVID has been historically and objectively difficult to predict. U.S. and foreign inflation uncertainty may be acting as a headwind to U.S. growth and pose challenges for monetary policy.
    Board of Governors of the Federal Reserve System
    federalreserve.gov
    Global Inflation Uncertainty and its Economic Effects
    The Federal Reserve Board of Governors in Washington DC.
    144K
  • user avatar
    FedResearch
    @FedResearch
    Apr 1, 2025
    Inflation targeting has become the predominant monetary policy strategy and has been remarkably successful in anchoring inflation, reflecting its reaction process, which allows it to flexibly incorporate a wide range of factors. federalreserve.gov/econres/feds/t… #FEDSPaper #EconTwitter
    Board of Governors of the Federal Reserve System
    federalreserve.gov
    The Evolution of Inflation Targeting from the 1990s to 2020s: Developments and New Challenges
    The Federal Reserve Board of Governors in Washington DC.
    11K
  • user avatar
    FedResearch
    @FedResearch
    Jul 6, 2022
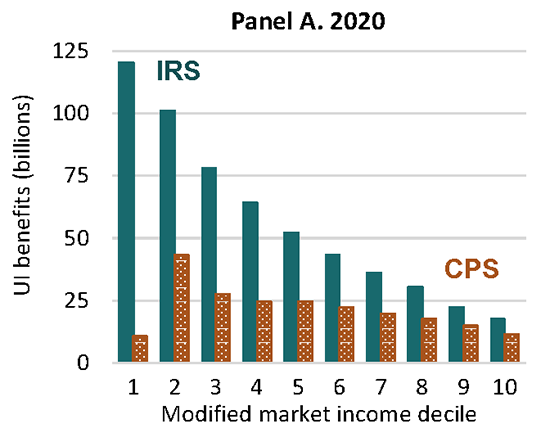
    New #FEDSNote shows Census data understated the increase in unemp. benefits in 2020 - particularly among low-income families. As a result, official poverty rates were overstated by about 2 pct. points, and corrected poverty reached a 6-decade low: federalreserve.gov/econres/notes/…
    Figure 3. Distribution of UI Benefits by recipient income (by year)

New to X?

Sign up now to get your own personalized timeline!

Create account

By signing up, you agree to the Terms of Service and Privacy Policy, including Cookie Use.

Terms·Privacy·Cookies·Accessibility·Ads Info·© 2026 X Corp.
Don't miss what's happening
People on X are the first to know.
Log inSign up
Advertisement
Advertisement