Log inSign up
ResiClub πŸ‘πŸ“Š
1,061 posts
Image
user avatar
ResiClub πŸ‘πŸ“Š
@ResidentialClub
Your data-driven gateway to the heart of the U.S. housing market. An independent news and research firm that covers the housing market. πŸ‘πŸ“Š
USA
resiclubanalytics.com/subscribe
Joined September 2023
3
Following
16.6K
Followers
  • user avatar
    ResiClub πŸ‘πŸ“Š
    @ResidentialClub
    Jun 11, 2024
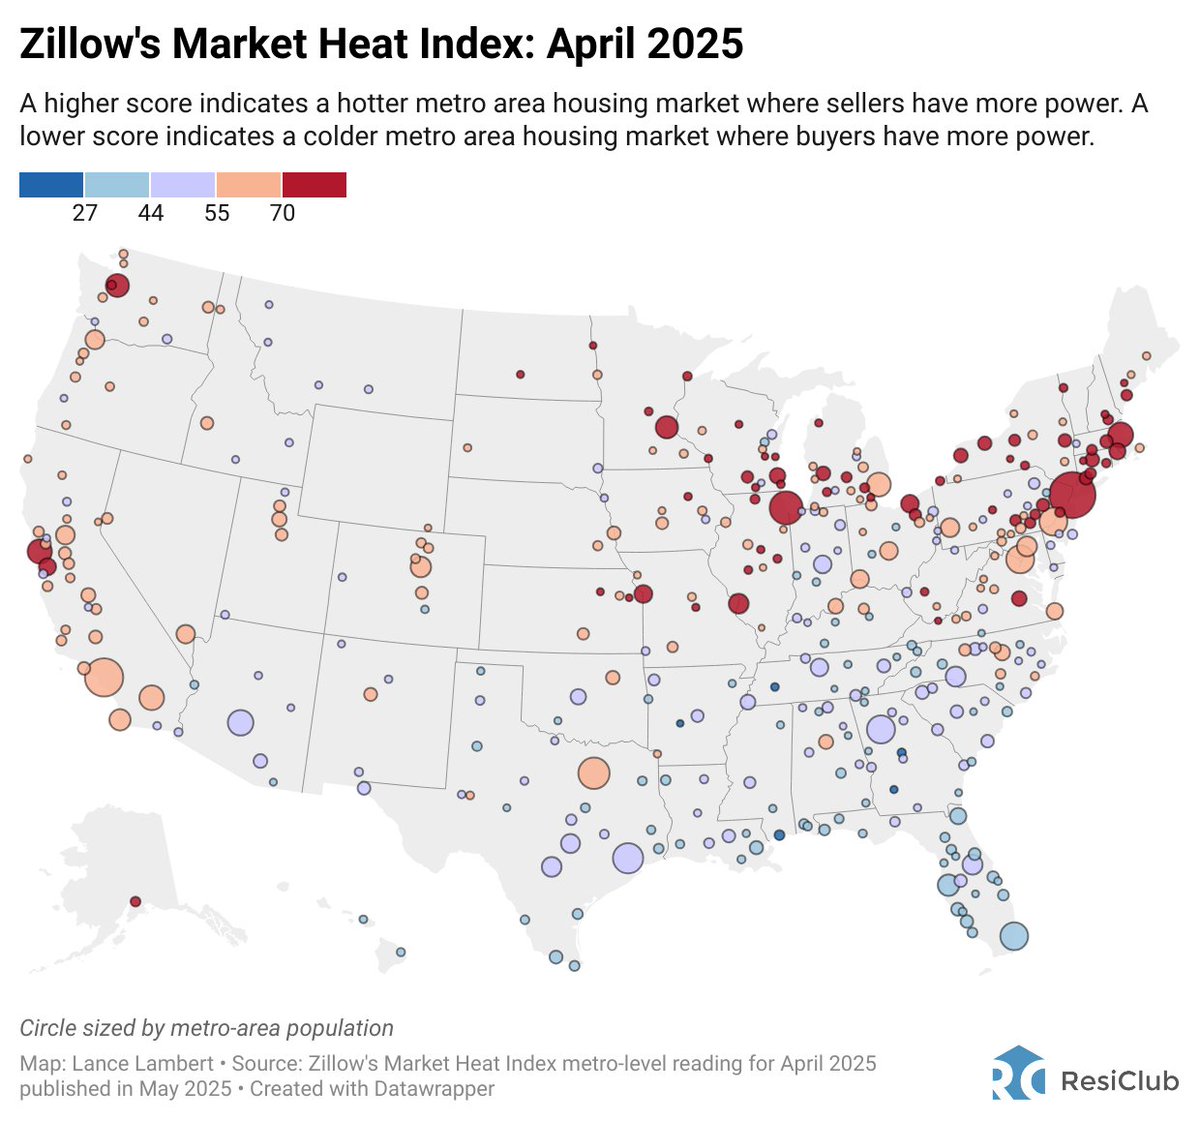
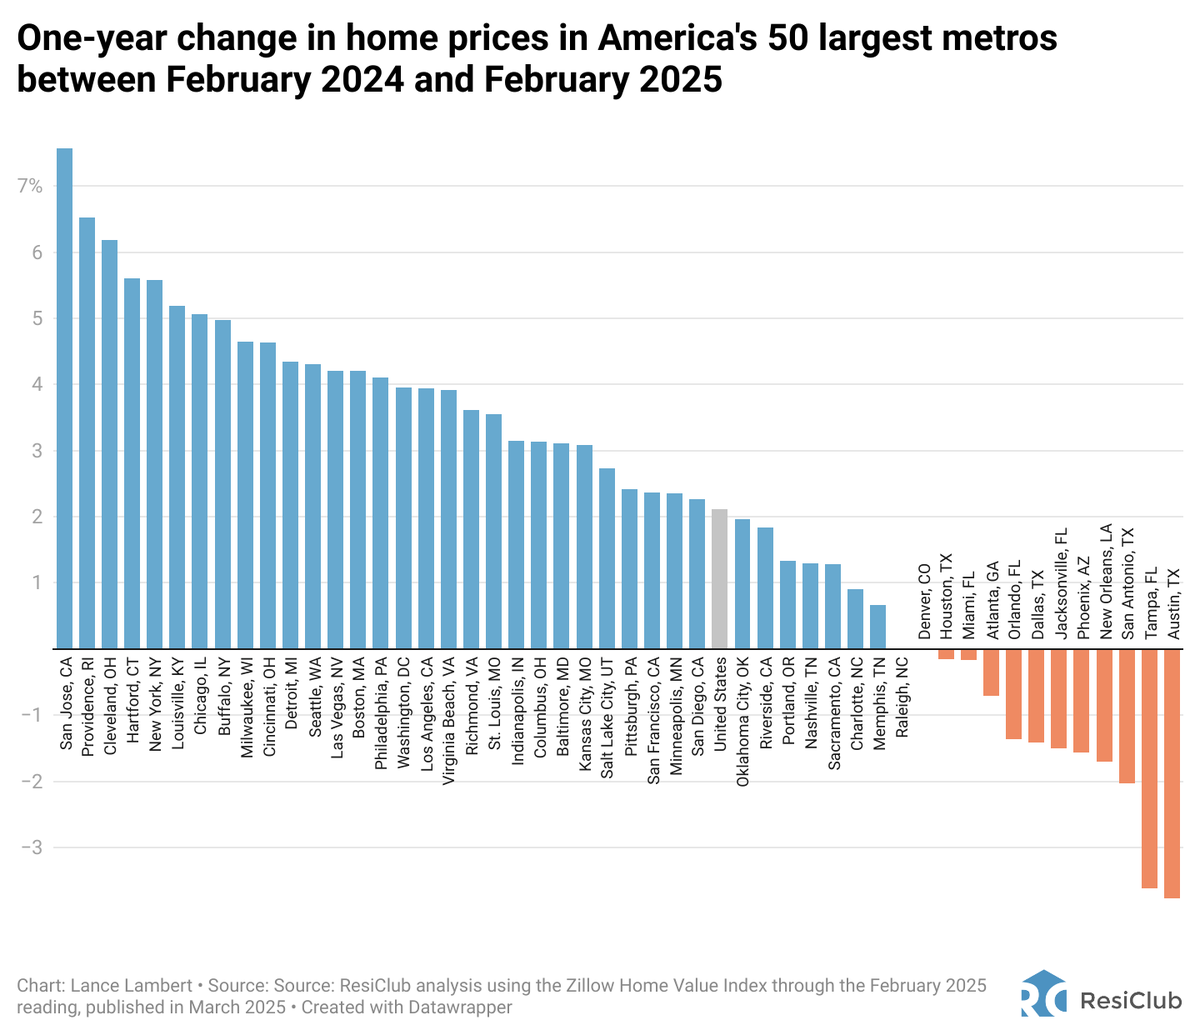
    Housing markets DOWN the most since their 2022 price peak Austin -> -18.7% New Orleans -> -13.7% Lake Charles, LA -> -11.7% Boise -> -10.4% Idaho Falls -> -9.7% Chico, CA -> -8.8% San Francisco -> -8.2% Provo -> -8.0% Punta Gorda -> -7.8% Phoenix -> 7.3% resiclubanalytics.com/p/10-housing-m…
    Image
    546K
  • user avatar
    ResiClub πŸ‘πŸ“Š
    @ResidentialClub
    May 6, 2025
    BIGGEST METRO AREA HOME PRICE DECLINE SINCE THEIR 2022 PEAK: -23.2% -> Austin, TX -16.9% -> Punta Gorda, FL -16.2% -> New Orleans, LA -14.4% -> Lake Charles, LA -12.2% -> Cape Coral, FL -11.9% -> North Port, FL -10.5% -> Boise City, ID -10.2% -> Phoenix, AZ
    Image
    45K
  • user avatar
    ResiClub πŸ‘πŸ“Š
    @ResidentialClub
    Oct 21, 2024
    BIGGEST HOME PRICE DECLINES SINCE THEIR 2022 PEAK Among the 300 largest metros... Austin, TX -> -20.4% New Orleans, LA -> -14.4% Lake Charles, LA -> -14.1% Punta Gorda, FL -> -11.8% Boise, ID -> -9.7% San Francisco, CA -> -9.4% Chico, CA -> -8.8% resiclubanalytics.com/p/updated-home…
    Image
    62K
  • user avatar
    ResiClub πŸ‘πŸ“Š
    @ResidentialClub
    May 20, 2025
    #NEW Zillow home price data for America's 50 largest metropolitan housing markets 1. MoM (month over month) 2. YoY (year over year) 3. Shift since 2022 peak 4. Shift since March 2020 Without seasonal adjustment, through April 2025 reading
    Image
    44K
  • user avatar
    ResiClub πŸ‘πŸ“Š
    @ResidentialClub
    Sep 15, 2025
    A staggering 40.3% of U.S. owner-occupied housing units are now mortgage-free @MalasMeghan's latest report for ResiClub PRO members: resiclubanalytics.com/p/the-share-of…
    Image
    95K
  • user avatar
    ResiClub πŸ‘πŸ“Š
    @ResidentialClub
    Mar 25, 2025
    Here is Zillow’s Market Heat Index Score of 70 or above = strong sellers market Score from 55 to 69 = sellers market Score from 44 to 55 = neutral market Score from 28 to 44 = buyers market Score of 27 or below = strong buyers market
    Image
    40K
  • user avatar
    ResiClub πŸ‘πŸ“Š
    @ResidentialClub
    May 29, 2025
    According to Zillow: Score of 70 or above = strong sellers market Score from 55 to 69 = sellers market Score from 44 to 55 = neutral market Score from 28 to 44 = buyers market Score of 27 or below = strong buyers market
    Image
    35K
  • user avatar
    ResiClub πŸ‘πŸ“Š
    @ResidentialClub
    Mar 2, 2025
    Everywhere. Active housing inventory for sale is rising on a year-over-year basis in all 50 states.
    Image
    34K
  • user avatar
    ResiClub πŸ‘πŸ“Š
    @ResidentialClub
    May 13, 2025
    U.S.Β housing foreclosures, by Q1 πŸ‘‡ Q1 2015 β€”>Β 111,820 Q1 2016 β€”>Β 96,680 Q1 2017 β€”>Β 90,460 Q1 2018 β€”>Β 76,360 Q1 2019 β€”>Β 71,040 Q1 2020 β€”>Β 74,720 Q1 2021 β€”>Β 11,400 Q1 2022 β€”>Β 24,220 Q1 2023 β€”>Β 35,640 Q1 2024 β€”>Β 44,180 Q1 2025 β€”>Β 61,660 +40% YoY -13% below pre-pandemic 2019
    Image
    45K
  • user avatar
    ResiClub πŸ‘πŸ“Š
    @ResidentialClub
    Mar 18, 2025
    12 of the nation's 50 largest metro area housing markets now have falling year-over-year home prices -3.8% -> Austin, TX -3.6% -> Tampa, FL -2.0% -> San Antonio, TX -1.7% -> New Orleans, LA -1.6% -> Phoenix, AZ -1.5% -> Jacksonville, FL -1.4% -> Dallas, TX continued...
    Image
    90K
  • user avatar
    ResiClub πŸ‘πŸ“Š
    @ResidentialClub
    Sep 25, 2024
    BIGGEST HOME PRICE DECLINES Among the 450 largest metro area housing markets, these 50 markets have seen the biggest corrections since their 2022 peak Austin, TX -> -19.8% Lake Charles, LA -> -13.7% New Orleans, LA -> -13.7% Ukiah, CA -> -13.6%
    Image
    46K
  • user avatar
    ResiClub πŸ‘πŸ“Š
    @ResidentialClub
    Jun 5, 2025
    #NEW 10 states are back above pre-pandemic 2019 active housing inventory levels: Arizona Colorado Florida Idaho Hawaii Oregon Tennessee Texas Utah Washington
    Image
    43K
  • user avatar
    ResiClub πŸ‘πŸ“Š
    @ResidentialClub
    Jul 30, 2025
    Nearly 40% of owner-occupied homes have no mortgage In some pockets of the country, that figure is +60%
    Image
    135K
  • user avatar
    ResiClub πŸ‘πŸ“Š
    @ResidentialClub
    Jan 6, 2024
    In 2023, the U.S. witnessed a surge in apartment supply, reaching the highest levels since 1987 Here's the intriguing part: Last year was just the warm-up act This year, @RealPage expects us to hit the highest level since 1974 resiclubanalytics.com/p/2024-us-hous…
    Image
    94K

New to X?

Sign up now to get your own personalized timeline!

Create account

By signing up, you agree to the Terms of Service and Privacy Policy, including Cookie Use.

TermsΒ·PrivacyΒ·CookiesΒ·AccessibilityΒ·Ads InfoΒ·Β© 2026 X Corp.
Don't miss what's happening
People on X are the first to know.
Log inSign up
Advertisement
Advertisement