Log inSign up
Will Deakin @[email protected]
1,398 posts
Image
user avatar
Will Deakin @[email protected]
@WillDeakin1
I do governance for British railway IT plus European regulation I believe data makes rail passengers lives better. Ask me how! #Physicist #OpenData #DataScience
UK
fosstodon.org/@wnd
Joined January 2020
346
Following
699
Followers
  • user avatar
    Will Deakin @[email protected]
    @WillDeakin1
    Jan 1, 2024
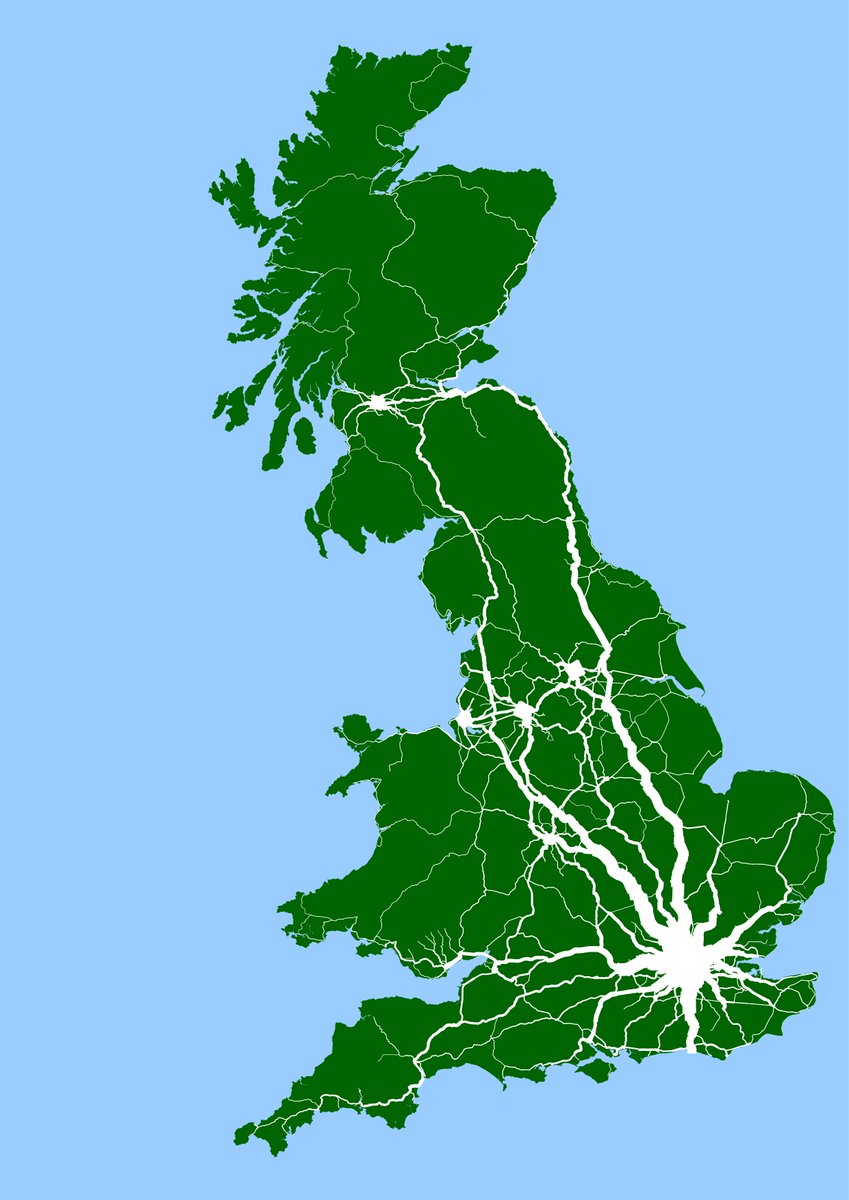
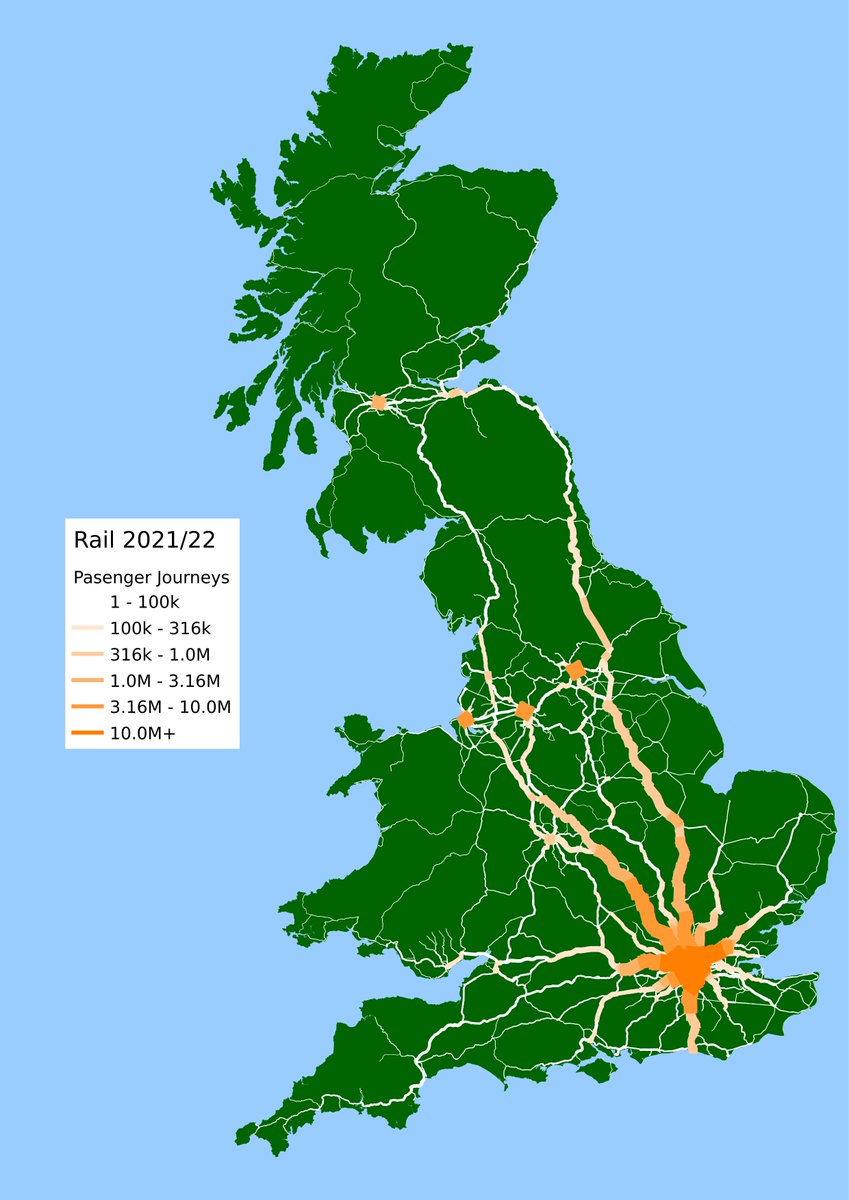
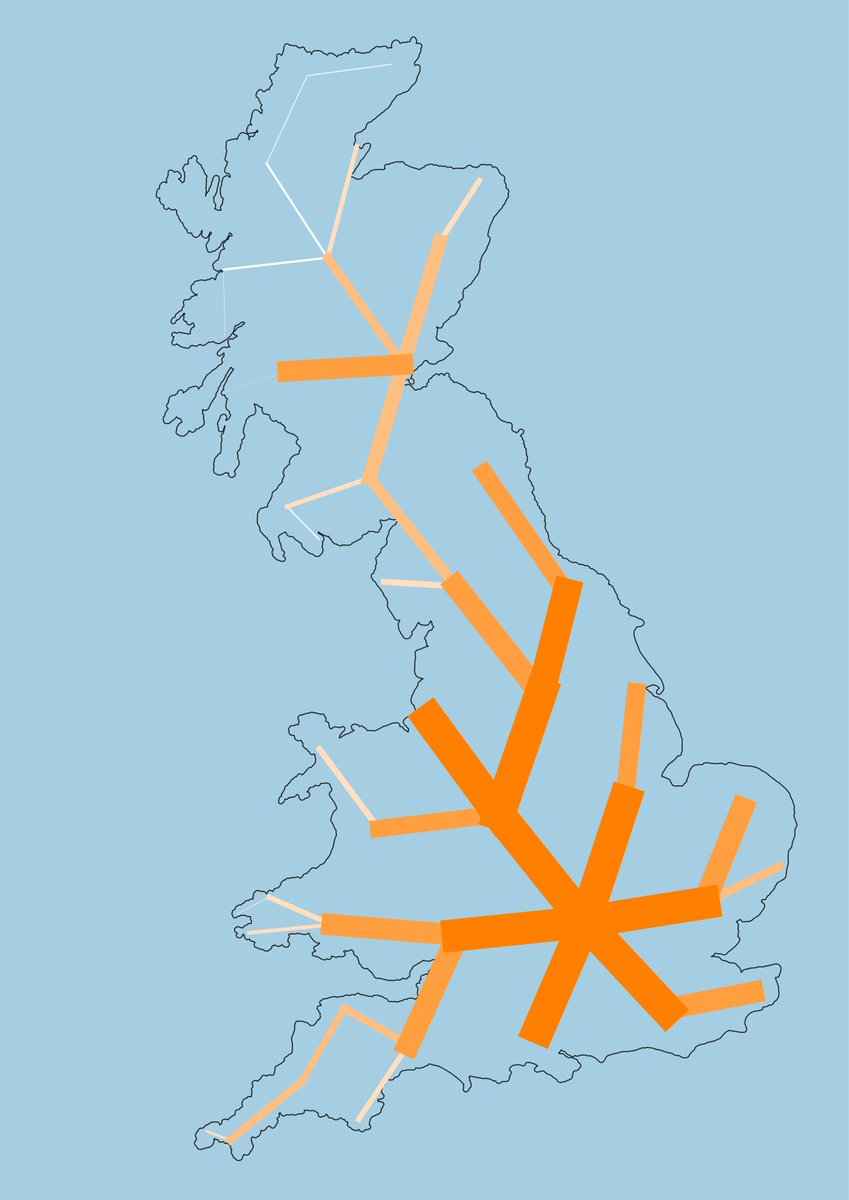
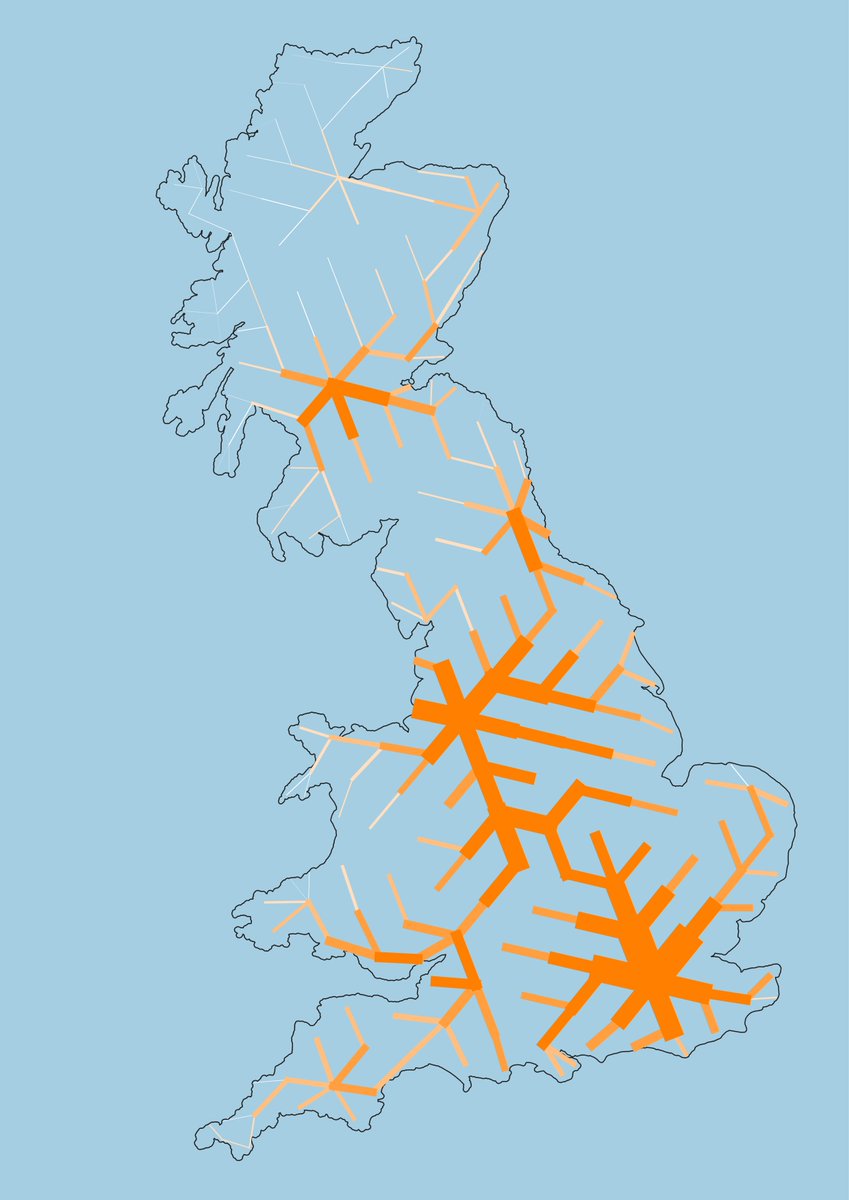
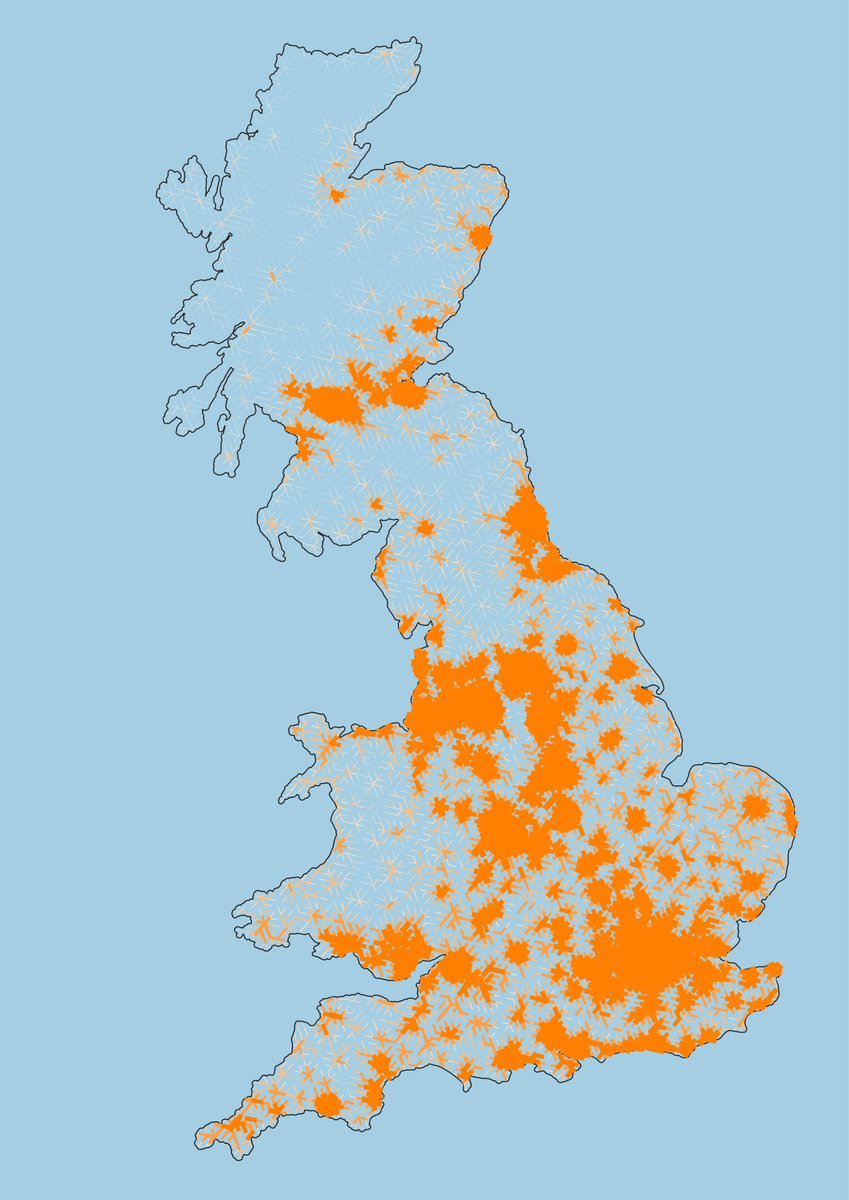
    For those interested in such things, here are cuts of the @railandroad 2021/22 passenger travel data projected onto a shortest-path network using the centre-line track-model with log and linear colour gradient and line width Thanks to @undertheraedar @poggs #rail #DataVis
    Rail network model of mainland Great Britain showing a log-scale white to orange representation of annual passenger journeys. Sea in blue and land in green.
    Rail network model of mainland Great Britain showing a linear-scale white to orange representation of annual passenger journeys. Sea in blue and land in green.
    Rail network model of mainland Great Britain showing a representation with white line with scaled to annual passenger journeys. Sea in blue and land in green.
    Rail network model of mainland Great Britain showing a representation with both log-scale coloured white to orange lines and line width with scaled to annual passenger journeys. Sea in blue and land in green.
    35K
  • user avatar
    Will Deakin @[email protected]
    @WillDeakin1
    Feb 23, 2024
    For those interested in such things based on the ORR Great Britain passenger origin-destination matrix, here is a short animation showing the change aggregated rail passenger flow in FY2019/20-2021/22 #DataVisualization #rail #PassengerTransport #ChangeInDemand
    Map showing change in aggregated rail passenger flow in Great Britain between FY2018/19 with blue sea, dark green land in dark green and scaled passenger flow in white
    Map showing change in aggregated rail passenger flow in Great Britain between FY2019/20 with blue sea, dark green land in dark green and scaled passenger flow in white
    Map showing change in aggregated rail passenger flow in Great Britain between FY2020/21 with blue sea, dark green land in dark green and scaled passenger flow in white
    Map showing change in aggregated rail passenger flow in Great Britain between FY2021/2 with blue sea, dark green land in dark green and scaled passenger flow in white
    4K
  • user avatar
    Will Deakin @[email protected]
    @WillDeakin1
    Jan 9, 2024
    For those interested in such things, the nice folk at @OpenInnovates asked me to blog about recent passenger journey visualization shenanigans. Thanks to @paulcconnell for the invitation, #taz and #stuart at OI publishing this, and @undertheraedar @poggs
    Image
    open-innovations.org
    Passenger journeys: pictures at a (rail transport) exhibition
    This blog is about using the Office of Road and Rail (ORR) passenger travel data projected onto a shortest-path network to create a visualisation for passenger journey numbers for the active rail...
    5.6K
  • user avatar
    Will Deakin @[email protected]
    @WillDeakin1
    Jan 2, 2024
    Replying to @WillDeakin1
    Update: the 2 657 images showing the ORR 2021/22 passenger travel data for each of the active mainline railway stations here github.com/anisotropi4/ki…. The main code still needs work and will be posted on GitHub here github.com/anisotropi4/ki…
    2.3K
  • user avatar
    Will Deakin @[email protected]
    @WillDeakin1
    Jan 2, 2024
    For those interested in such things, here are 2 657 images showing the ORR 2021/22 passenger travel data projected onto a shortest-path network for each of the active mainline railway stations github.com/anisotropi4/ki… #DataVisualization #Rail #PassengerData #ORR #2021 1/2
    1.5K
  • user avatar
    Will Deakin @[email protected]
    @WillDeakin1
    Jan 1, 2024
    Replying to @DanielPhilips1 @railandroad and 2 others
    FWIW I excluded the LDS to LDS (and other zero distance) point data from the original dataset. Here is the Leeds railway station data at a slightly different scale
    Image
    3.8K
  • user avatar
    Will Deakin @[email protected]
    @WillDeakin1
    Feb 19, 2023
    For those interested in such things, here is a theoretical rail-network based on applying a minimum spanning tree to a series of scaled hexagon population distributions geographies #RailNetwork #DataVisualisation #Census2021
    Coarse network model with star network centred on London with a WCML from Sussex to Liverpool and an EC line from Birmingham to Tyne and Wear
    A less coarse network with a WCML S-network from Sussex to Leeds via Birmingham and Manchester.
    Finer MST network showing South coast network from Hastings to Poole, Edinburgh to Glasgow and a Central mainline Birmingham to Bradford via Leicester, Sheffield and Leeds
    Fine grain MST more akin to a GB population density map
    1.5K
  • user avatar
    Will Deakin @[email protected]
    @WillDeakin1
    Feb 24, 2024
    For those interested in such things, a per station animation of the FY2018-2022 #ORR Origin Destination Matrix (#ODM) dataset for 2 579 rail stations in Britain github.com/anisotropi4/ki… Details here github.com/anisotropi4/ki… #DataScience #DataVisualization #rail #RailPassenger
    Financial Year 2022-23 aggregated rail passenger flow in Britain shown as a white with line width proportion to passenger numbers, on map of Britain in dark green and sea in light blue.
    597
  • user avatar
    Will Deakin @[email protected]
    @WillDeakin1
    Jan 3, 2024
    Update: the site should be back here github.com/anisotropi4/ki… Given the popularity I'm going to look at an alternative hosting solution but hopefully this will work for a bit. Please shout if it isn't* * As if you wouldn't
    965
  • user avatar
    Will Deakin @[email protected]
    @WillDeakin1
    May 23, 2020
    I would like to thank all the staff at @YorkTeachingNHS in York A&E and Day Admissions today for the kindness and care given to an anxious bloke with chest pains, and the reassurance it was skeletomuscular brought on by to stress at work rather than an acute coronary event
  • user avatar
    Will Deakin @[email protected]
    @WillDeakin1
    Feb 26, 2020
    Really enjoyed @tracywestall's talk at #raildigital2020. Great points about #digitaldisruption #leadership and #resilience
  • user avatar
    Will Deakin @[email protected]
    @WillDeakin1
    Jan 2, 2023
    Replying to @undertheraedar
    The fix is in, with 202 country files, 17 regions with 19,752MB of zip'd GeoPackage files for the 47.8M km of repackaged Microsoft road data Code here github.com/anisotropi4/ro… (14 of 17 processed regions data are also hosted) Any further questions shout
    2.9K
  • user avatar
    Will Deakin @[email protected]
    @WillDeakin1
    May 14, 2023
    For those interested in such things here is a draft set of UK rail planning (TIPLOC) and operations (STANOX) locations snapped to the centre-line track-model, or OpenStreetMap data where require Code and data is here github.com/anisotropi4/wo… #DataVisualisation #rail 1/2
    Map of UK rail TIPLOC locations at York snapped to centre-line and OpenStreetMap data
    Map of UK rail TIPLOC locations at Doncaster snapped to centre-line and OpenStreetMap data
    Map of UK rail STANOX locations at Doncaster snapped to centre-line and OpenStreetMap data
    390
  • user avatar
    Will Deakin @[email protected]
    @WillDeakin1
    Feb 8, 2024
    Replying to @SwissKrono_JH @Coneee and @BloombergUK
    No. It's GB not UK by design The Irish dataset is not available otherwise I would have visualised that For the absence of doubt, I did ask and told this is not available either for NI or elsewhere
    100

New to X?

Sign up now to get your own personalized timeline!

Create account

By signing up, you agree to the Terms of Service and Privacy Policy, including Cookie Use.

Terms·Privacy·Cookies·Accessibility·Ads Info·© 2026 X Corp.
Don't miss what's happening
People on X are the first to know.
Log inSign up
Advertisement
Advertisement