

- Neuralink update will drop soon
- The best tech feels like magic because it’s so normal you don’t even notice it… until you do. Took a ride in a Tesla Robotaxi today. In this clip, it pulls aside on a narrow street with construction, making room for an oncoming car that illegally turns into our lane. The
 00:00
00:00 - P8 fed himself for the first time since the injury by controlling a robotic arm, purely by thinking with Telepathy. Mind over matter.ALS took Nick’s arm mobility. Now, he can control a robotic arm with his Neuralink device to feed himself. “Life with my BCI has been and continues to be so surreal and so rewarding. Can’t wait to see what comes next!”
 00:00
00:00 - This is a spike raster plot, where each row represents neural activity of a single channel over time. There are over 1,000 rows, a channel count of the N1 implant. Each white pixel represents a spike. You can tell the precise time when our participant wakes up.Moments after implantation, our device can provide visibility into real-time neural activity. This video shows the gradual increase in activity as one of our recent participants wakes up post-procedure 🌅🧠
 00:00
00:00 - You don’t even need to walk up to it, Teslas come to you
- Open the freezer → take out the pretzel → open the microwave → put the plate with the pretzel inside → cook → enjoy 🥨 All via telepathy, pure brain power
 00:00
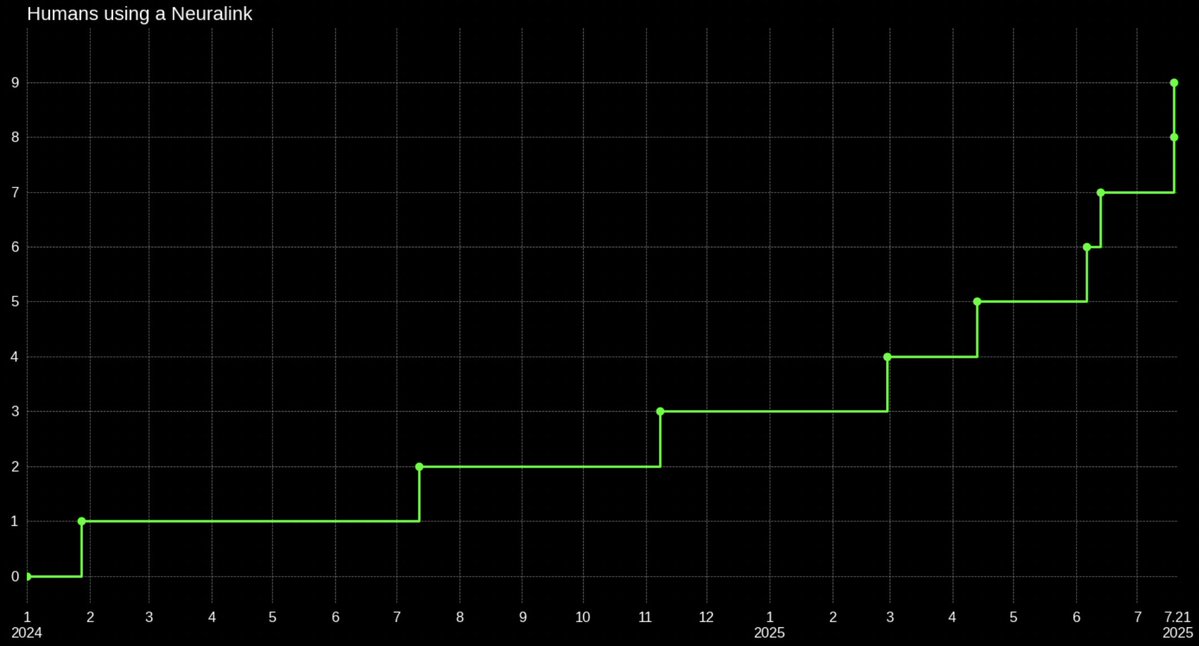
00:00 - Our goal is at least 20 before the end of 2025
 Two surgeries in one day ✅
 - This is common across all Elon companiesTesla has a very unique way to incubate leaderships. Because we are deeply mission oriented, each one of us really care what we work on. You often see people organically organize, assigning tasks, and taking on initiatives. More motivated employees would carry the balls all
- Neuralink is 300 people strong. Massive talent density.The Future of Neuralink: We are witnessing a truly *historic* technology develop in real-time. The idea of implanting a device to regulate electrical pulses in the brain used to be stuck in academic labs. But Neuralink is bringing this technology to the masses. They are
- We’ve been busy, that’s 3 surgeries in the past 3.5 weeks. Lots of exciting updates coming soon.🇨🇦 We just completed two surgeries in Canada—our first procedures outside the United States! This marks an important step towards bringing our technology to more people around the world.