PinnedNathan Yau@flowingdataFeb 18, 2025Defense Against Dishonest Charts flowingdata.com/projects/disho…441212747416K16K
Nathan Yau@flowingdataMar 26, 2019The stages of relationships towards marriage flowingdata.com/2019/03/26/rel…GIF48487997992K2K
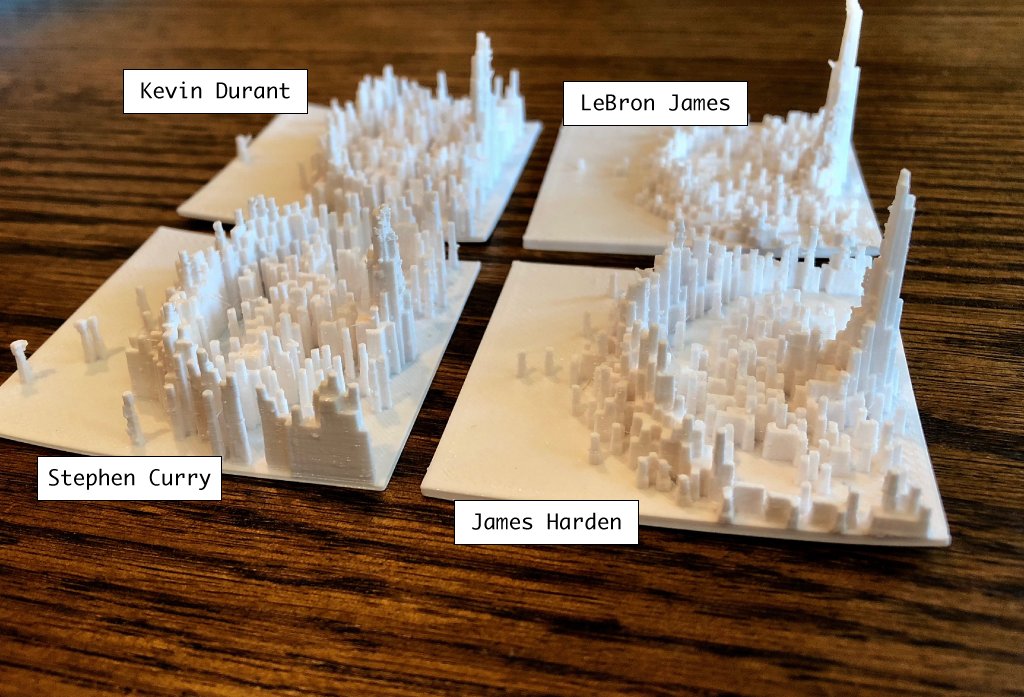
Nathan Yau@flowingdataApr 25, 2018Messing around with Data -> R -> 3-D printer. Shooting charts for the 2017-18 regular season.49495465462K2K
Nathan Yau@flowingdataApr 11, 2017A story of humanity in the pixels of a Reddit April Fool’s experiment. And dickbutt. sudoscript.com/reddit-place/GIF115815811.3K1.3K
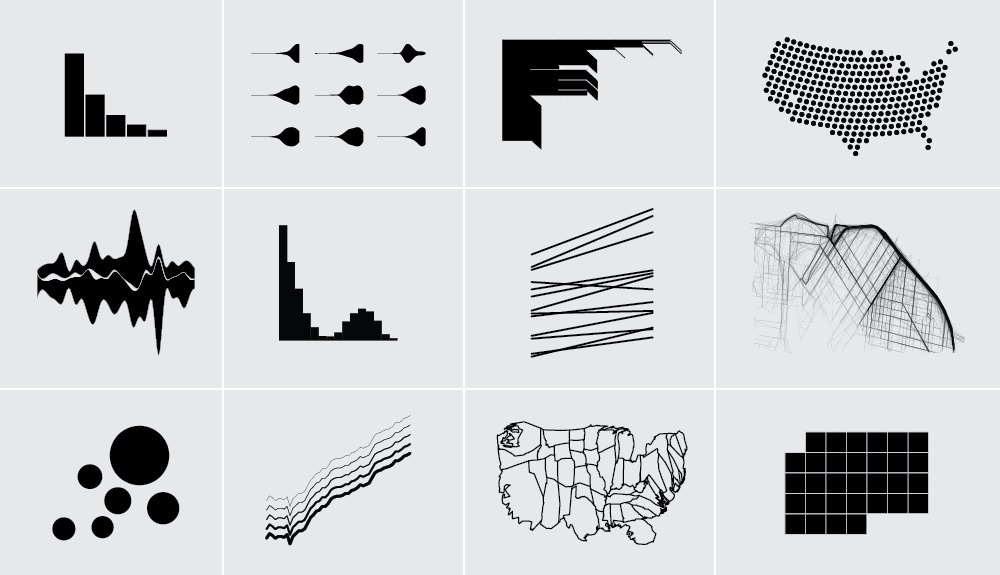
Nathan Yau@flowingdataOct 17, 2018One dataset, visualized with 14 different charts. Let the questions guide you. flowingdata.com/2018/10/17/ask…GIF1010332332968968
Nathan Yau@flowingdataJan 29, 2019Closeness throughout various relationships illustrated with a couple of lines oliviaderecat.com/shop/closeness…1111371371934934
Nathan Yau@flowingdataNov 28, 2017I daisy chained job switches to construct career paths from any given job to every other job flowingdata.com/2017/11/28/car…GIF1616330330847847
Nathan Yau@flowingdataMay 6, 2015Visualization in R. A course that starts at beginner and takes you to advanced. Step-by-step. flowingdata.com/2015/05/06/int… 88289289683683
Nathan Yau@flowingdataDec 27, 2018Here are my picks for best data visualization projects of 2018 Best Data Visualization Projects of 2018From flowingdata.com66223223665665
Nathan Yau@flowingdataAug 27, 2018A search engine for color palettes flowingdata.com/2018/08/27/a-s…1212170170639639
Nathan Yau@flowingdataDec 31, 2021Here are my favorite data visualization projects from 2021. Best Data Visualization Projects of 2021From flowingdata.com66124124578578
Nathan Yau@flowingdataAug 26, 202124-hour cycle for one weekday in the life of Americans flowingdata.com/2021/08/25/cyc…1010101101524524
Nathan Yau@flowingdataOct 18, 2019Microsoft open sourced their visual data exploration tool SandDance cloudblogs.microsoft.com/opensource/201…GIF66157157534534