Joshua Stevens
15.3K posts

Joshua Stevens
@jscarto
Cartographic Editor @mapsdotcom. Prev: DataViz Lead @NASAEarth, @NSF PhD Fellow in Big Data Social Sci @PSUGeography. Dad stuff everywhere else. Views my own.
- Water + time = a continuous evolution of meanders and braids that fade in and out of a landscape. Here, the Padma River in Bangladesh carves a changing course over 14 years: earthobservatory.nasa.gov/images/92529/t…
 GIF
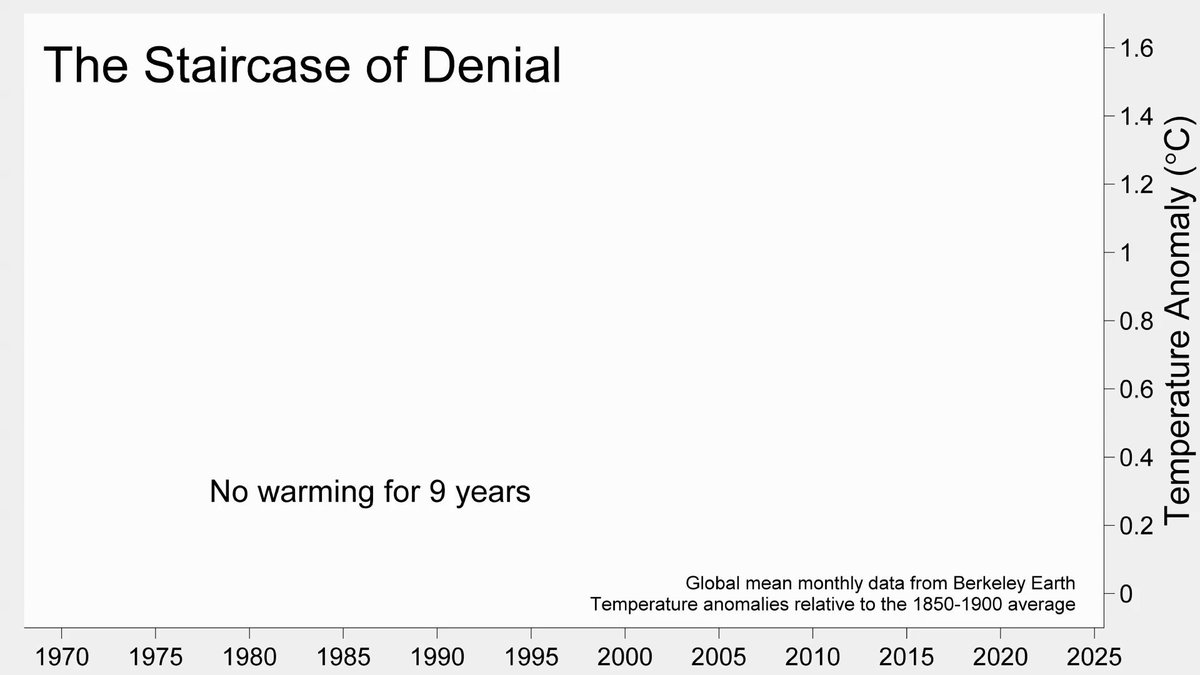
GIF - Fascinating how those who deny global warming simultaneously dismiss data for not going back 4.5 billion years and then rest their entire thought process on a single year's weather. They continue, event by event, up the staircase of denial (via reddit.com/r/dataisbeauti…)
 00:00ALGERIA SEES RARE SNOWFALL; 157 AFGHANS NOW CONFIRMED TO HAVE FROZEN-TO-DEATH IN “COLDEST WINTER ON RECORD”; BENCHMARKS BUSTED IN U.S.; + *ALL-TIME* RECORDS CONTINUE TO FALL ACROSS JAPAN Mainstream 'climate science' has it entirely backwards. electroverse.co/algeria-snow-1…
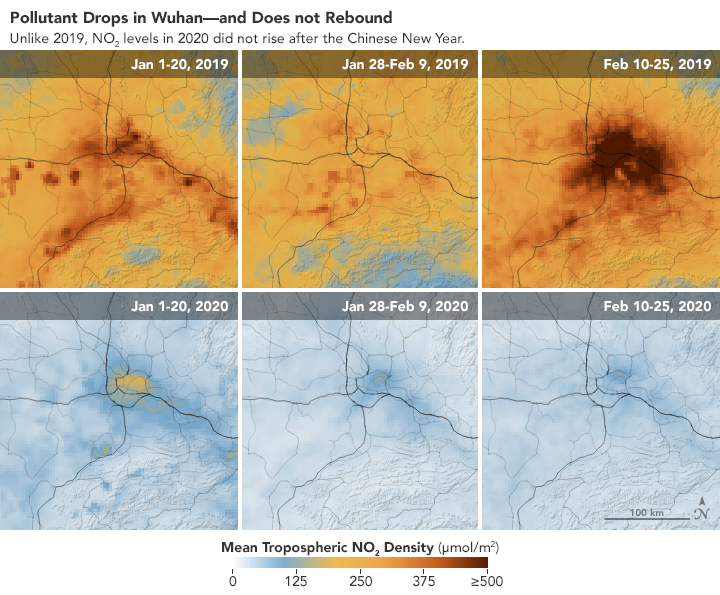
 - #Coronavirus: Amid efforts to reduce pollution in #China, the signal from quarantines remains clear. Unlike the past, activity levels have not rebounded after the Chinese New Year. New reporting from @KashaPatel & me earthobservatory.nasa.gov/images/146362/… #maps #dataviz
- Okjökull was an iconic glacier in Iceland. Next week, a plaque is being installed at the site in memoriam. The land is now mostly ice-free. In glacier terms, Okjökull is dead. Yes—it was climate change: earthobservatory.nasa.gov/images/145439/…
 00:00
00:00 - Replying to @jscartoThe reduction in activity is measurable throughout China. The reduced activity follows one of the largest quarantines in history #coronavirus #COVID19

- #HurricanLane near Hawaii, two typhoons in the West Pacific, wildfire smoke crossing North America, and Saharan dust reaching Portugal and Spain. Just a few of the things you can see in our new map of aerosol components earthobservatory.nasa.gov/images/92654/j… #dataviz #maps

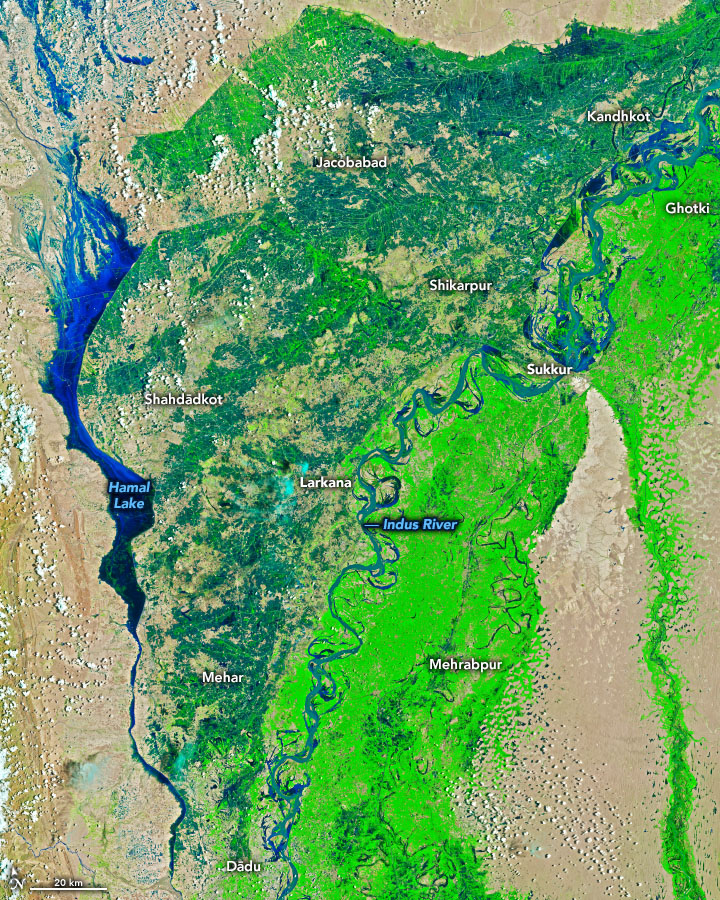
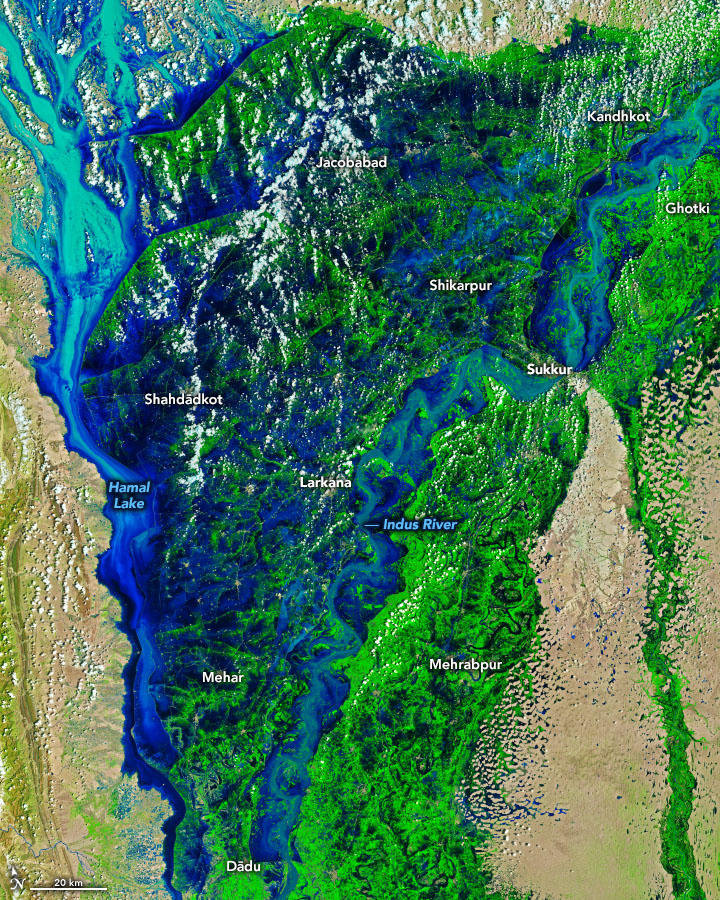
- Truly gut wrenching imagery of the devastating floods in #Pakistan Left: 🛰️ Landsat 8 on August 4 Right: 🛰️ Landsat 9 on August 28 More info and reporting from @GeoScienceSara: earthobservatory.nasa.gov/images/150279/…
- It is unfortunate that this needs saying... but this needs saying. Thank you, Eric! The atmospheric signal as a result of activity following coronavirus is temporary, and does not outweigh the fact that people are dying and the lives of the living are being turned upside down.You’re unable to view this Post because this account owner limits who can view their Posts. Learn more
- The smoke from Australia's wildfires has been reaching South America since early November (video here). But that the fires are still raging, so intensely, for this smoke to *still* be crossing the Pacific at such an amount is just astounding
 00:00
00:00 - Incredible new analysis: parallax observations by GOES & Himawari show that the Hunga Tonga eruption sent its plume of ash and gas to the mesosphere. This is likely a new record in the satellite era. earthobservatory.nasa.gov/images/149474/… #remotesensing #earthobservation #scicomm #gis #maps
 00:00
00:00 - Super computers, NASA, and collaborations with commercial imagery vendors allow scientists to map forests.... one tree at a time. earthobservatory.nasa.gov/images/147612/…

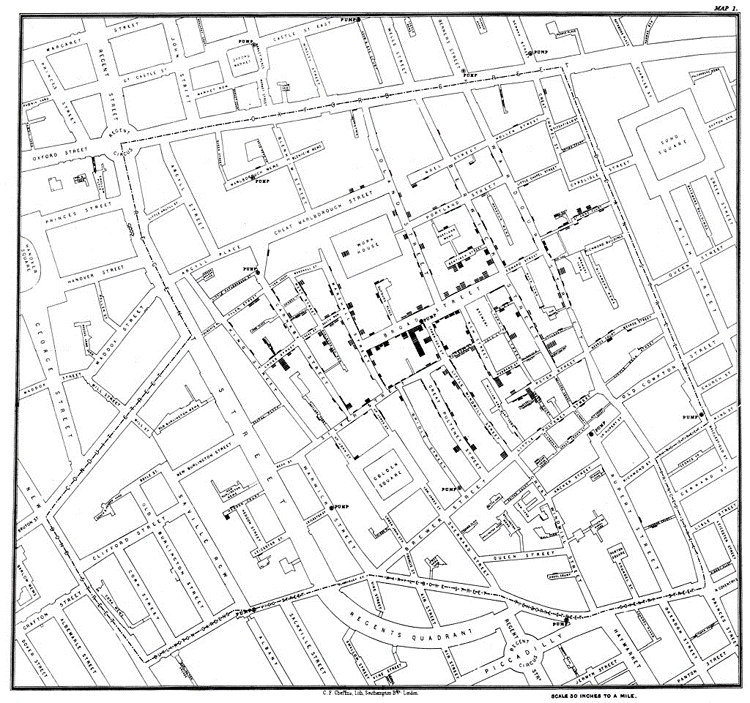
- Important context: Snow didn’t use this map to discover how cholera spread. He knew water was the source 5 whole years before he commissioned this map from cartographer Charles Cheffins. The map was used to convince authorities and the public collections.nlm.nih.gov/ext/cholera/PD…By using data visualisation back in 1854, John Snow was able to discover the source of the cholera outbreak. What is data visualisation? Find out on our blog: ow.ly/DgJ350CiUvM #OSDeveloper
- NASA Harvest researchers are using satellite observations and economic data to track how the #Russia-#Ukraine conflict is disrupting the global food system. The latest from @avoiland and me: earthobservatory.nasa.gov/images/150025/… #maps #gis #remotesensing #dataviz