Pinned

This is a thread of me QTing myself so I can pin all my posted-on-Twitter projects.
Causal inference animated graphs:
As requested, slower graphs! Also added a graph on collider bias, the webpage explanation helps there.
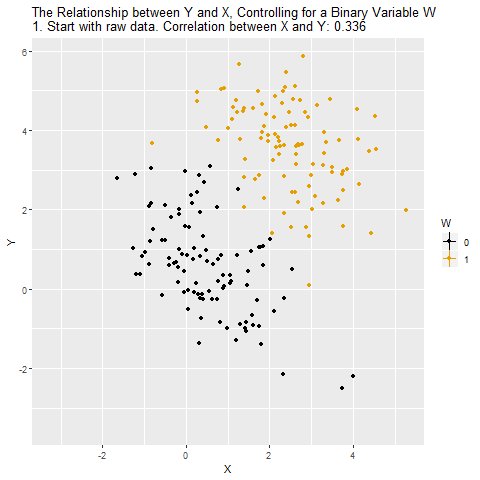
These graphs are intended to show what standard causal inference methods actually *do* to data, and how they work.
This is what controlling for a binary variable looks like:
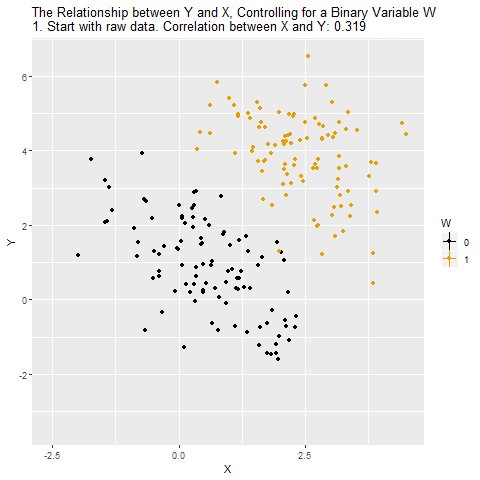
GIF