-
-
 GIF
GIF
Summarize with containers
-
 GIF
GIF
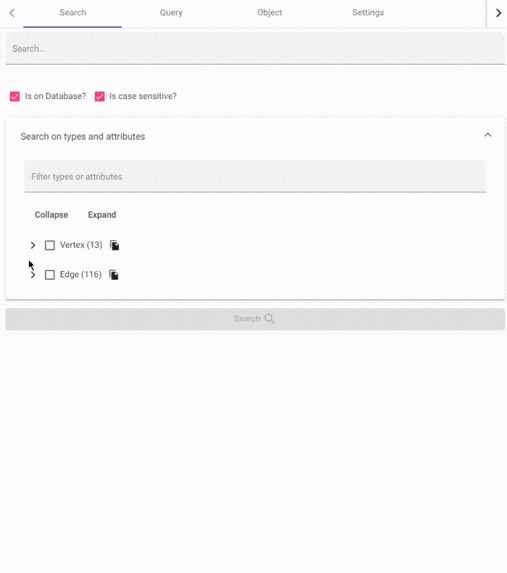
filter attributes and types
-
 GIF
GIF
search any string
-
 GIF
GIF
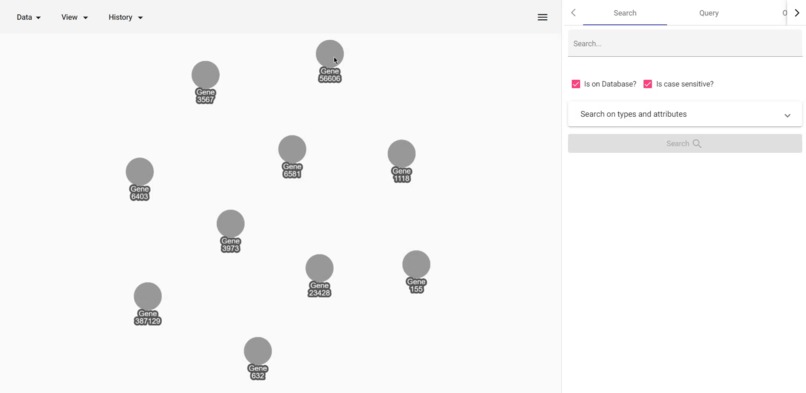
search client-side data
-
 GIF
GIF
data schema as tree
-
 GIF
GIF
edit distance of 'inchi' values
-
 GIF
GIF
Adamic Adar calculation
-
 GIF
GIF
Jaccard similarity of neighborhoods
-
 GIF
GIF
load, delete, go back, inspect, resize
-
 GIF
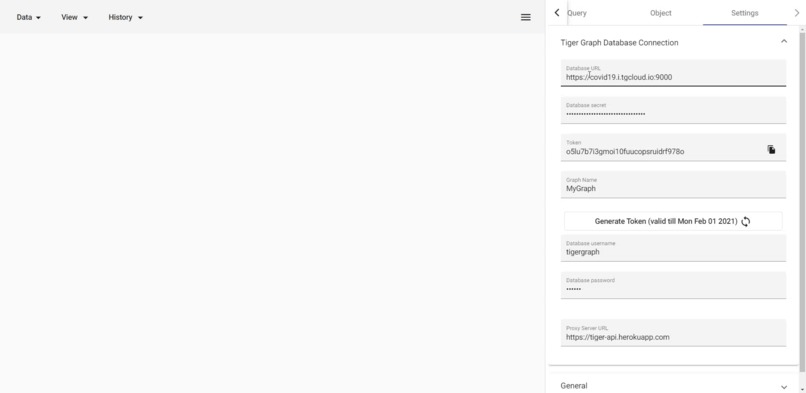
GIF
connect to tiger graph


Inspiration
In drug discovery and drug repurposing, interactions between objects are significant. Graph (network) based inference can use and expose these interactions pretty efficiently. The graph-based inference is based on the topology of the graph. In addition to the topology, the attributes of objects can also play an important role in the analysis. As a result, benefiting from both the topological properties of the graph and data attributes can give the best results.
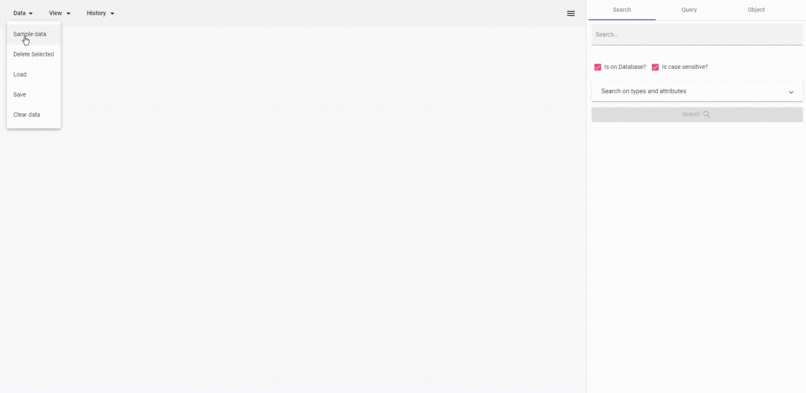
What it does
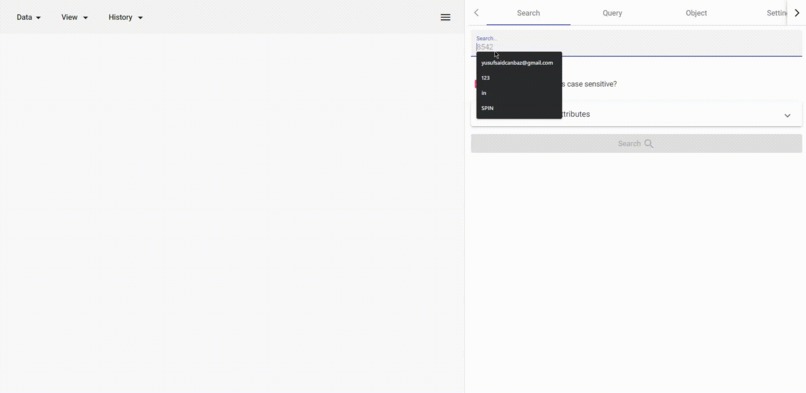
- Search ANY
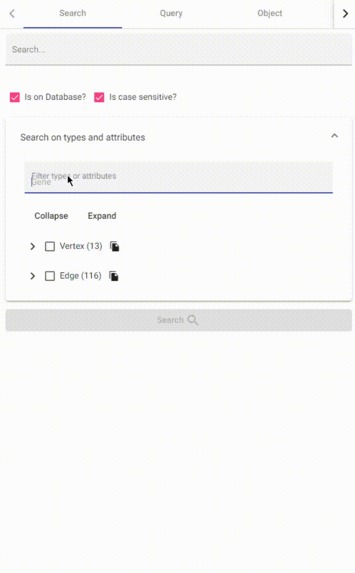
stringattribute inside the TigerGraph database easily. - Filter attributes and types on
stringsearch. - Search also in client-side data to highlight in the user interface.
- Run 'Interpreted' and 'Installed' GSQL queries.
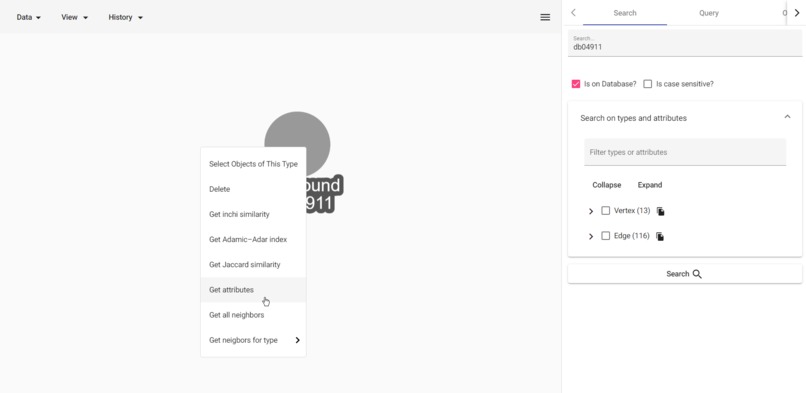
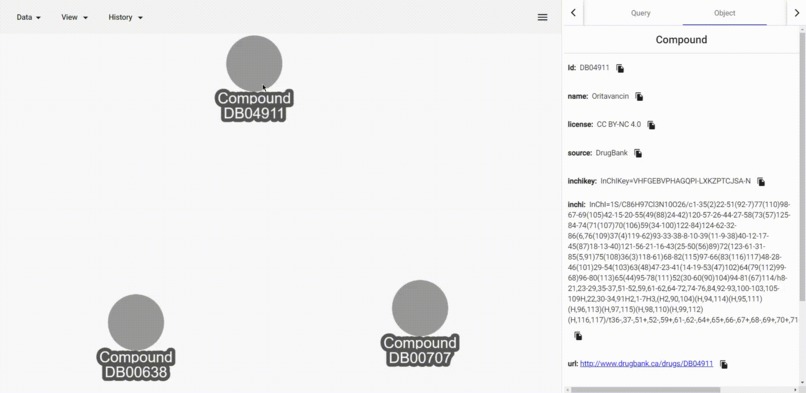
- Inspect attributes of a vertex/edge.
- Inspect attributes of multiple vertices and edges as a table.
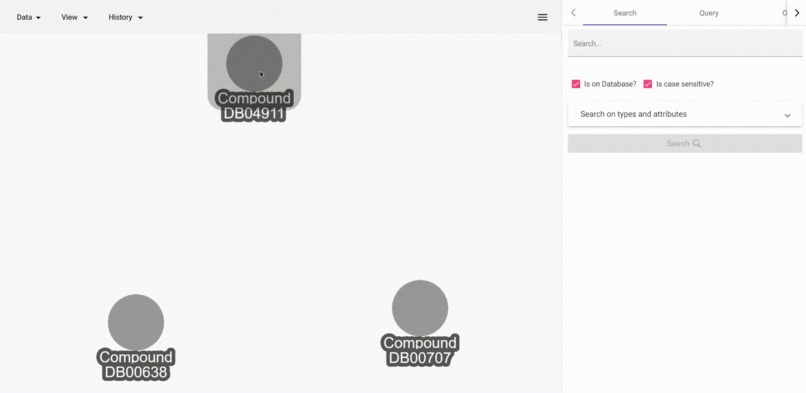
- Dynamically resize graph canvas.
- Save and load data as JSON for visualization.
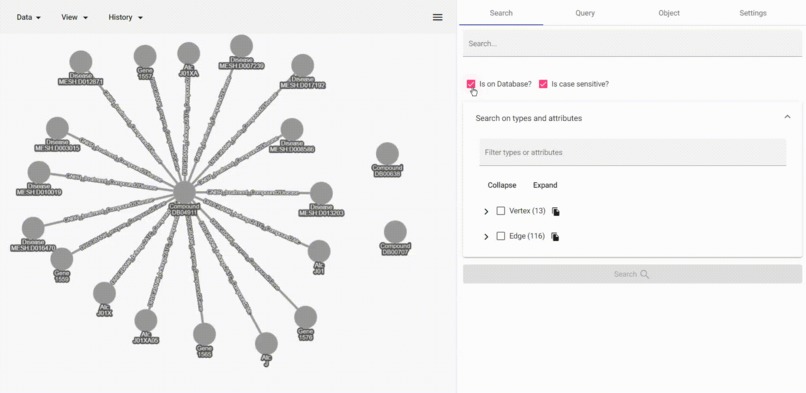
- Summarize crowded neighborhoods with containers to make visualization readable
- Go back and forward on the history of the graph.
- Get Adamic-Adar values of a vertex to all other visible nodes to predict connections.
- Get Jaccard similarity of a vertex to all other vertices in the whole database. Here Jaccard similarity is defined as (count of the intersection of 1-neighborhood) / (count of the union of 1-neighborhood).
- Get inchi similarity of a Compound to all other visible Compound. Here similary of inchi values are calculated with edit distance algorithm.
- Bring neighbors of a vertex from a specific type or all types.
How we built it
Firstly, we created dataset. To create dataset, we used Python and Jupyter notebook and pyTigerGraph library. Implementation of creating dataset, creating data schema and inserting to TigerGraph is available inside another repository called "derman". Derman also contains all the data as text inside a compressed file. So you can recreate your own database.
To generate the database We used the DRKG dataset. Then we enriched this with DGIDB and hetionet datasets. Basically, we merged these 3 datasets to create an extensive dataset.
We used Angular and Angular Material in the frontend.
Challenges we ran into
- Understanding the domain was difficult. We read lots of papers and get help from Molecular Biolog friends.
- Creating a useful and understandable dataset was hard. The DRKG was a knowledge graph dataset. So it doesn't contain any data properties . We wanted to use both data properties such as International Chemical Identifier (inchi) and also the topology of the graph. That's why we enriched the DRKG with 'hetionet' and 'DGIDB' datasets.
- Writing efficient GSQL query that scans whole database is hard. It must be efficient. we wrote some queries like that. But later we see that they are not that performant. So we switched to run on subsets given as parameters.
Accomplishments that we're proud of
- Original and generic (schema-agnostic) GSQL algorithms such as
adamicAdar,editDistance, andjaccardSimilarity. - Domain-specific GSQL algorithm
inchiSimilarity - Generic (schema-agnostic) way to search for ANY
stringinside the database. - A resizeable graph canvas for easy interaction using User-Interface.
- With the help of compound nodes, make complex graphs a lot more readable.
What we learned
- Powerful GSQL features such as dynamic arrays
- Using Tiger Graph with Docker
- A little knowledge about drug discovery
What's next for Dervish
- Many different algorithms can be used to find similarities or connections between diseases and/or compounds.
- More collaboration with domain experts can make the tool more user-friendly
Built With
- angular.js
- cytoscape.js
- material-theme

Log in or sign up for Devpost to join the conversation.