damo is a user space tool for DAMON. Using
this, you can monitor the data access patterns of your system or workloads and
do data access-aware memory management operations.

Official git repos for damo are hosted on kernel.org and GitHub:
- kernel.org: https://git.kernel.org/pub/scm/linux/kernel/git/sj/damo.git
- GitHub: https://github.com/damonitor/damo
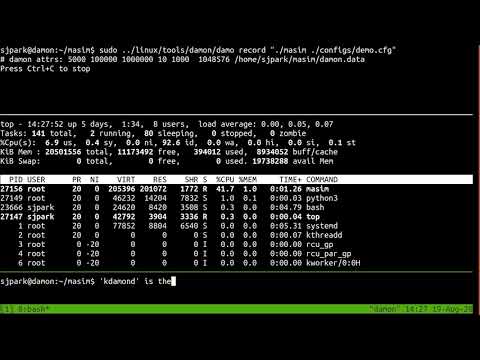
Please click the below thumbnail to show the short demo video. Note that the video is recorded in 2020, and hence not showing features added after the demo.
Follow below instructions and commands to monitor and visualize the access pattern of your workload.
$ # install damo using packaging systems listed above,
$ # or cloning the source repo and updating $PATH.
$ sudo damo start $(pidof <your workload>)
$ sudo damo report access
$ sudo damo record ongoing
$ sudo damo report heatmap --draw_range hottest
The second and last commands will show the access pattern of your workload, like below:


damo tries its best to support as many kernels as it can. Some of its
features are fully independent to the kernel, while some of the features are.
Refer to "DAMON availability check" usage
section for more details.
The below sections provide quick introductions for damo's major features.
For more detailed usage, please refer to USAGE.md file.
Nothing at all but indicate which version is more fresh. A higher version number means it is more recently released.
This also means that there is no special versions for hotfixes. Instead, all bug fixes and new features are released together in fast speed (nearly once per week) under the single version scheme. We also strive a high level of stability across all versions. Users are therefore recommended to use latest version always if possible. It is the only way to get all bug fixes and new features. If there is any problem at upgrading the version, please report an issue.
We try our best to make damo stable and doesn't introduce regressions to
users. However, nothing goes forever. Sometimes, some features will be
deprecated. Some features will have longer support more than others.
In short, features that documented on USAGE.md and not explicitly
marked as experimental will be better supported, and provides at least three
months of deprecation grace period. Within the grace period, users can ask
extension of the support. Even after the grace period, please reach out to
damo developers if that makes problem to your usage.
Detailed features deprecation process is documented at FEATURES_DEPRECATION_PROCESS.md. Schedules and status of deprecations are updated on FEATURES_DEPRECATION_SCHEDULE.md.
Please refer to CONTRIBUTING file.
Below are quick introductions for damo's major features.
For more detailed usage, please refer to USAGE.md file.
Below commands repeatedly get a snapshot of the access pattern of a program for every second.
$ git clone https://github.com/sjp38/masim
$ cd masim; make; ./masim ./configs/zigzag.cfg --silent &
$ sudo damo start --target_pid $(pidof masim)
$ sudo damo report access --repeat
The first two lines of the commands get an artificial memory access generator program and run it in the background. It will repeatedly access two 100 MiB-sized memory regions one by one. You can substitute this with your real workload.
The third line asks damo to start monitoring the access pattern of the
process. Finally, the last line retries a snapshot of the monitoring results
every second and show on terminal.
Below commands record memory access patterns of a program and save the
monitoring results in damon.data file.
$ git clone https://github.com/sjp38/masim
$ cd masim; make; ./masim ./configs/zigzag.cfg --silent &
$ sudo damo record -o damon.data $(pidof masim)
The first two lines of the commands get an artificial memory access generator
program and run it in the background. It will repeatedly access two 100
MiB-sized memory regions one by one. You can substitute this with your real
workload. The last line asks damo to record the access pattern in
damon.data file.
Below three commands visualize the recorded access patterns into five image files.
$ damo report heatmap --output access_pattern_heatmap.png --draw_range all
$ damo report wss --range 0 101 1 --plot wss_dist.png
$ damo report wss --range 0 101 1 --sortby time --plot wss_chron_change.png
The first command will create three files, namely access_pattern_heatmap.png,
access_patern_heatmap.1.png, and access_pattern_heatmap.2.png.
access_pattern_heatmap{,1,2}.pngwill show the data access pattern of three address ranges nearby stack,mmap()-ed region, and heat in heatmaps, which shows when (x-axis) what memory region (y-axis) is how frequently accessed (color).wss_dist.pngwill show the distribution of the working set size.wss_chron_change.pngwill show how the working set size has chronologically changed.
Those similarly made with other realistic workloads are available [1,2,3].
[1] https://damonitor.github.io/test/result/visual/latest/rec.heatmap.1.png.html
[2] https://damonitor.github.io/test/result/visual/latest/rec.wss_sz.png.html
[3] https://damonitor.github.io/test/result/visual/latest/rec.wss_time.png.html
Below command makes every memory region of size >=4K that hasn't accessed for
=60 seconds in your workload to be swapped out. By doing this, you can make your workload more memory efficient with only modest performance overhead.
$ sudo damo start --damos_access_rate 0 0 --damos_sz_region 4K max \
                    --damos_age 60s max --damos_action pageout \
                    --target_pid <pid of your workload>
You can also show access pattern heatmap, memory footprints, and hotspot functions of the system and/or workloads all at once in live, like below.
