
Table of Contents
Requires Opti-Behavior Pro. Errors & Performance is a Pro module. View pricing or start the 6-month free trial.
The Errors & Performance module watches your site for technical and UX problems that cost conversions. This overview introduces the five monitoring tools and the page layout.
Requirements #
- Plan: Opti-Behavior Pro
- WordPress: 5.9+
Opening the module #
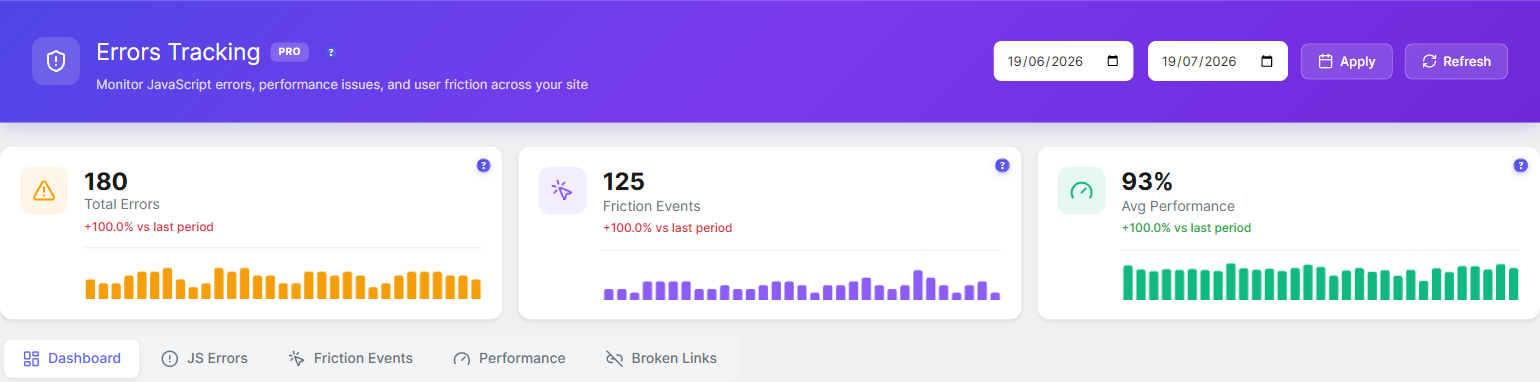
Go to WP Admin → Opti-Behavior → Errors Tracking. The page has a summary header (Total Errors, Friction Events, Avg Performance) and tabs: Dashboard, JS Errors, Friction Events, Performance, and Broken Links.
The 5 monitoring tools #
| Tool | What it watches |
|---|---|
| JavaScript error tracking | Uncaught JS errors with stack traces |
| Friction detection | Rage clicks, dead clicks and related friction |
| Core Web Vitals | Per-page LCP, INP, CLS and more |
| Performance score | A 0–100 score per page |
| Broken link detection | 404 and 500 responses |
Expected result #
You get one place to see technical errors, friction, page speed, and broken links, each with its own tab.
FAQ #
Does this need an external service? #
No. Monitoring runs on your own site; no data is sent to a third party.