Log inSign up
Rose Mintzer-Sweeney
54 posts
@rosemintzers

Rose Mintzer-Sweeney

@rosemintzers
words 🤝 numbers 🤝 pictures | writer @datawrapper
Joined June 2021
98
Following
683
Followers
RepliesRepliesRepostsRepostsMediaMedia

Log in or sign up for X

See what’s happening and join the conversation

Continue with phone
or
Log in with username or email
Terms·Privacy·Cookies·Accessibility·Ads Info·© 2026 X Corp.
  • @rosemintzers
    Rose Mintzer-Sweeney
    @rosemintzers
    Aug 3, 2022
    A hundred years ago, no raccoon had ever lived wild in Germany — today, one is probably rummaging through your trash right now. If you live in Kassel, that is. My latest Weekly Chart on the 20th century's great raccoon escapes: 🦝 blog.datawrapper.de/raccoons-invas…
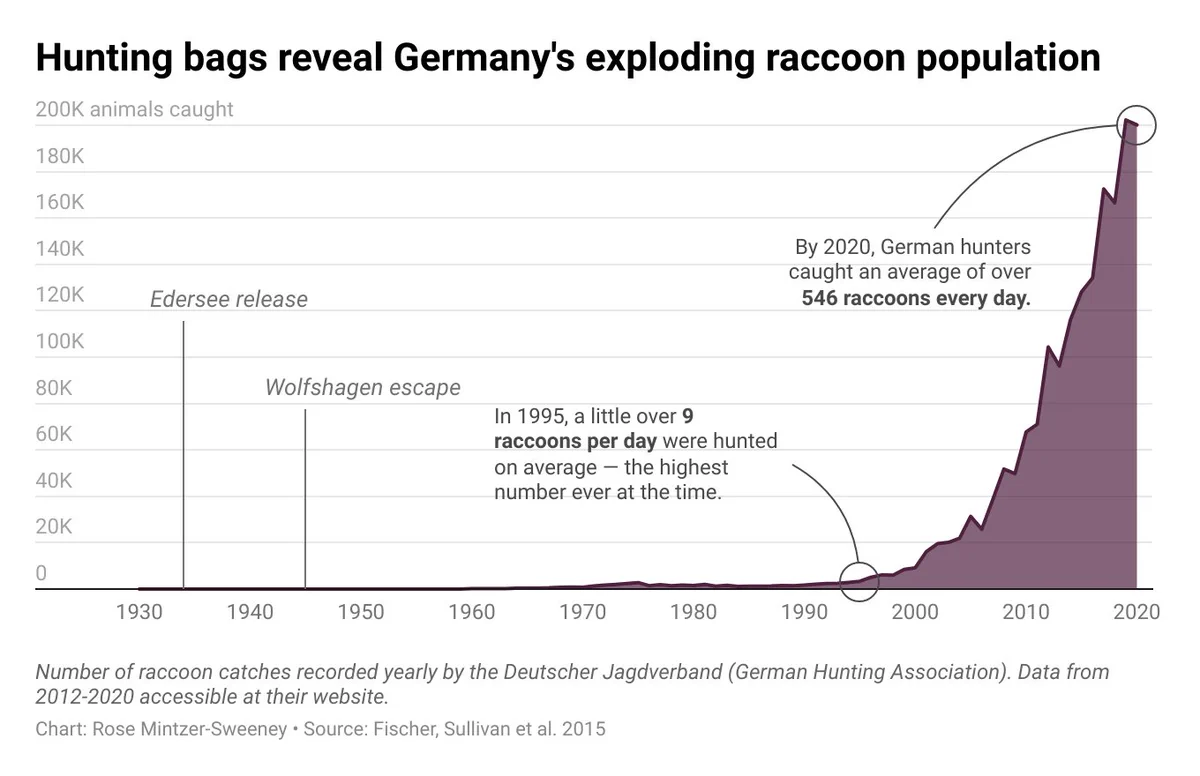
    A line chart showing Germany's estimated raccoon population growing exponentially from 1930-2020
    A choropleth map showing the estimated raccoon population density in each district of Germany. The raccoon "hotspots" are in Hesse and Brandenburg; almost no raccoons live in Bavaria or Baden-Württemberg.
  • @rosemintzers
    Rose Mintzer-Sweeney
    @rosemintzers
    Jun 9, 2022
    Come be my colleague! We're looking for TWO new faces in communications — a second data vis writer to join me on the blog as well as an evangelist for workshop and video formats. Feel free to get in touch with any questions about what it's like to work at Datawrapper 🌟
    @lisacmuth
    Lisa Charlotte Muth
    @lisacmuth
    May 31, 2022
    If you're excited about #dataviz, this might be your dream job: We're hiring two new team members who will work closely with the great @rosemintzers and me in the future. Let me tell you more 🧵.
  • @rosemintzers
    Rose Mintzer-Sweeney
    @rosemintzers
    May 12, 2022
    Most Americans are women. But that's not true in every town. And it wasn't true in every era. A look at the geography of gender, and what it says about U.S. history: blog.datawrapper.de/gender-ratio-a…
    Image
    00:00
  • @rosemintzers
    Rose Mintzer-Sweeney
    @rosemintzers
    Apr 25, 2022
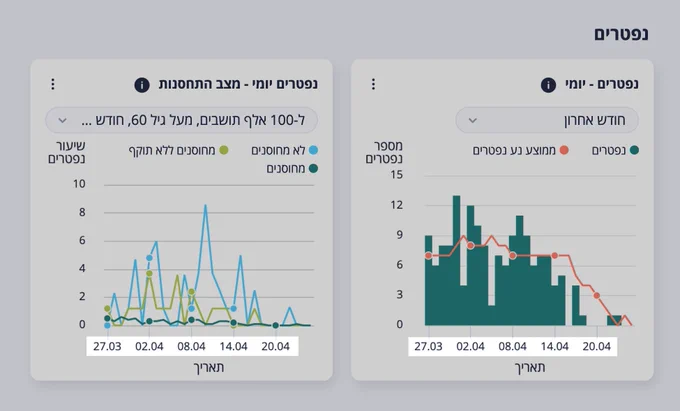
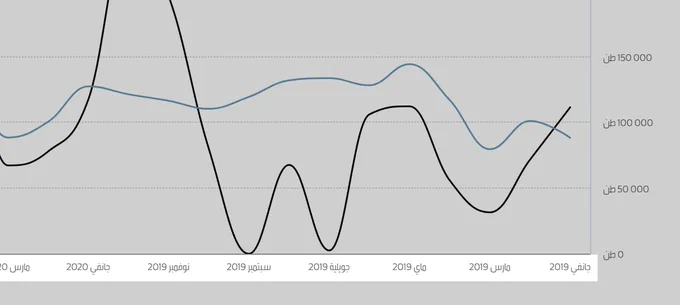
    How do you prefer to read charts in your right-to-left language? Please weigh in and share! (Readers of other RTL languages like Urdu, Persian, etc. also very welcome to comment 📉)
    @lisacmuth
    Lisa Charlotte Muth
    @lisacmuth
    Apr 25, 2022
    A question for all Arabic and Hebrew-speaking people out there: In a #dataviz in your language with a date/time x-axis, would you prefer it to go from right to left, or from left to right? (Polls in the next tweets!) Examples: datadashboard.health.gov.il/COVID-19/gener… & inkyfada.com/ar/2021/08/20/…
    Two Hebrew data visualizations with an x-axis that shows the dates going from left to right
    Part of a line chart showing the x-axis going from right to left
  • @rosemintzers
    Rose Mintzer-Sweeney
    @rosemintzers
    Apr 13, 2022
    In case you missed it: this week's Data Vis Dispatch is full of amazing maps, with a huge section on the French presidential election 🇫🇷 blog.datawrapper.de/data-vis-dispa…
    Image
    Image
    Image
    Image
Advertisement
Advertisement