1. X
  2. Our World in Data
Log inSign up
Our World in Data
3,000 posts
Image
user avatar
Our World in Data
@OurWorldInData
Our World in Data is a free, nonprofit website with a mission to increase understanding of the world’s largest problems and drive informed action to solve them.
Oxford, England
ourworldindata.org
Joined April 2015
21
Following
306.7K
Followers
RepliesRepliesMediaMedia

Log in or sign up for X

See what’s happening and join the conversation

Continue with phone
or
Log in with username or email
Terms·Privacy·Cookies·Accessibility·Ads Info·© 2026 X Corp.
  • Pinned
    user avatar
    Our World in Data
    @OurWorldInData
    Jan 3
    All three statements are true at the same time—
    Image
    111K
  • user avatar
    Our World in Data
    @OurWorldInData
    21h
    The latest OWID Brief newsletter is out on Substack! It delivers all our recent work plus curated highlights from across Our World in Data, right to your inbox twice a month. This edition: AI energy use, economic inequality, global population growth, land use over the
    Horizontal bar chart of the percentage of total electricity demand used by data centers in 2025 where the United States is highest at 4.9%, Europe is 1.9%, the world average is 1.5%, China is 1.1%, and other regions are 0.3% to 0.1%. The chart highlights that data center electricity demand is geographically concentrated and notes some US states exceed 10% to 25% of local demand, which could strain local grids. Data source: International Energy Agency (2025, 2026); Ember (2026). License: CC BY.
    7.3K
  • user avatar
    Our World in Data
    @OurWorldInData
    Jul 30
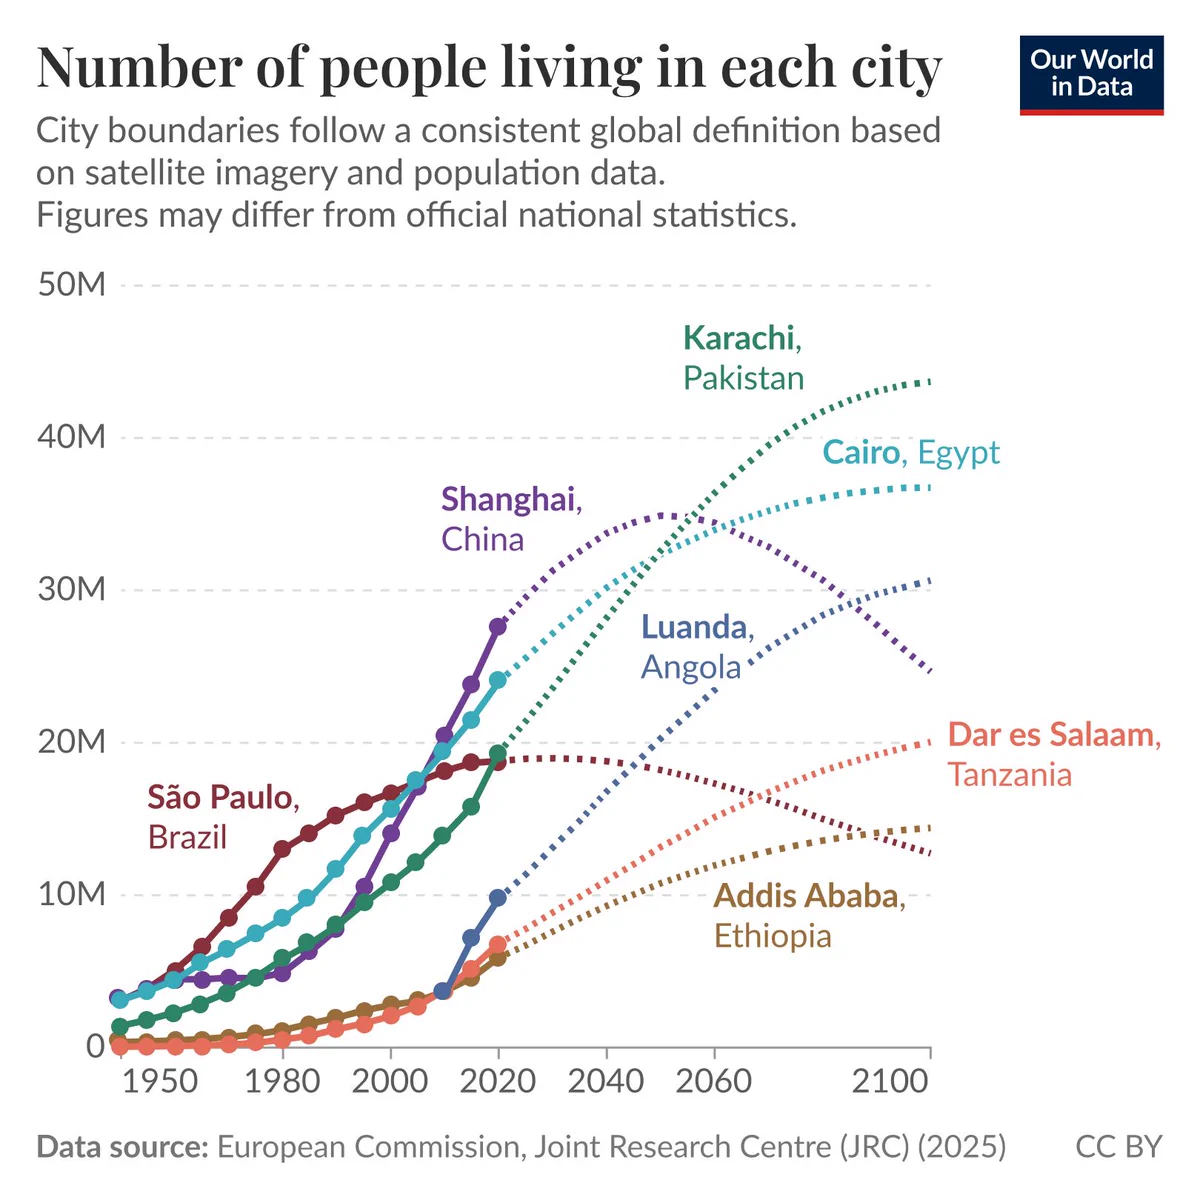
    Most of the world’s fastest-growing megacities will soon be in Africa— Many cities across East Asia and Latin America have grown quickly over the last few decades. Since 1950, São Paulo’s population has grown sixfold. Shanghai’s nearly tenfold. This rapid growth is now ending.
    Line chart of historical and projected population of major world cities from 1950 to 2100 where solid lines show past estimates and dashed lines show projections, illustrating rapid growth with several cities projected to reach 30 million to 50 million people. Source: European Commission, Joint Research Centre (JRC) (2025). License: CC BY.
    10K
  • user avatar
    Our World in Data
    @OurWorldInData
    Jul 30
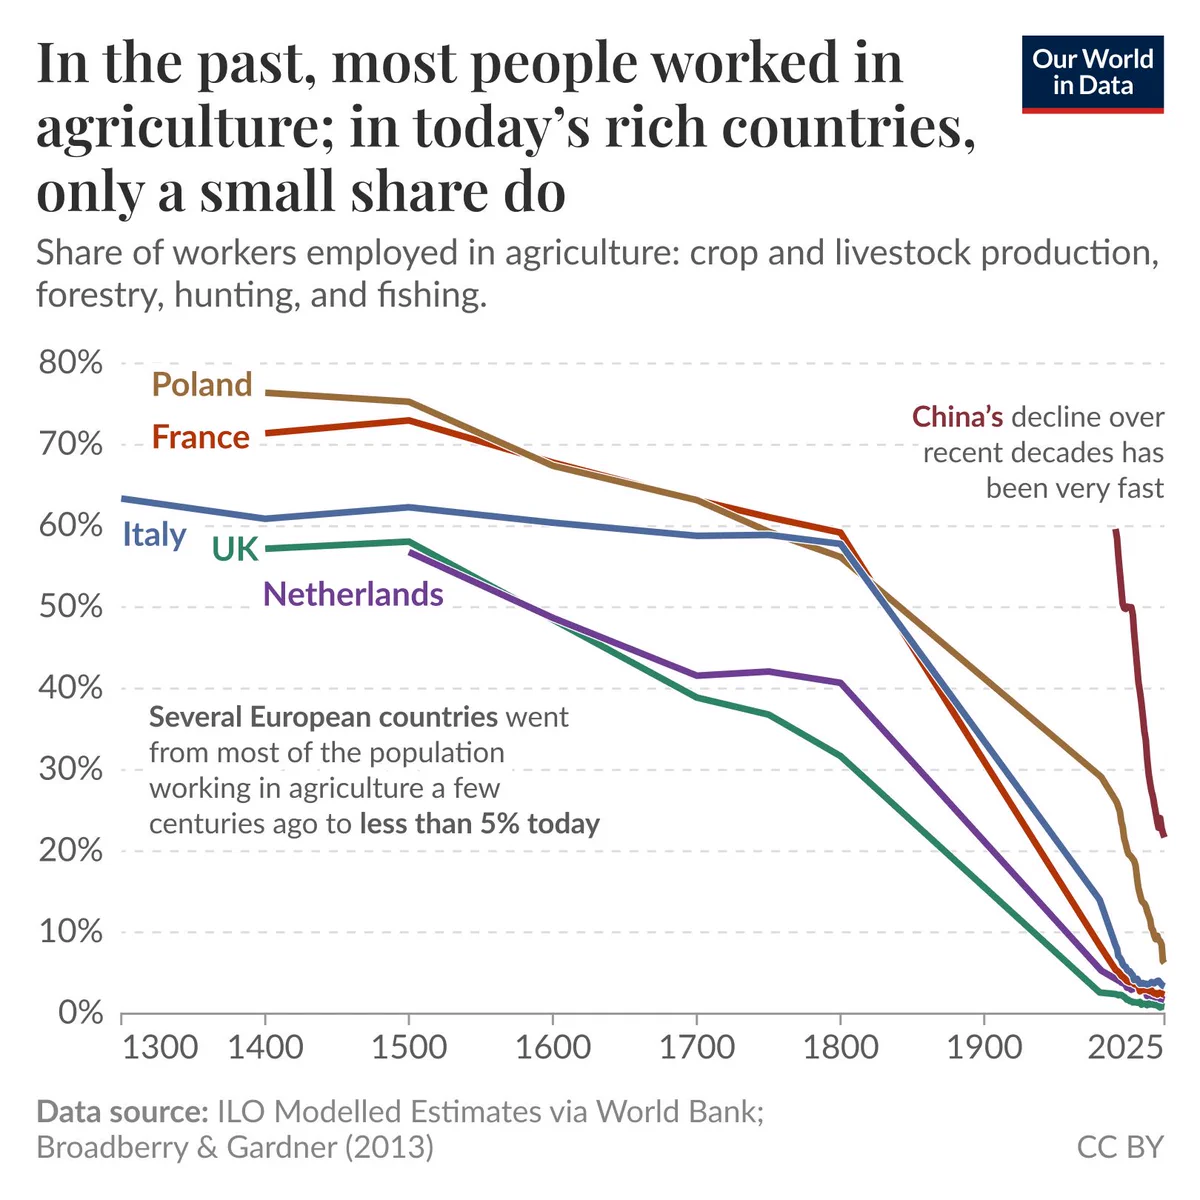
    In the past, most people worked in agriculture; in today’s rich countries, only a small share do. Since the agricultural revolution, the majority of the labor force in countries like France, the United Kingdom, Italy, and the Netherlands worked in farming. But over the last few
    Line chart of the share of workers employed in agriculture from 1300 to 2025 for several countries, where it shows that many European countries fell from most of the population working in agriculture a few centuries ago to less than 10% in recent years and that China’s decline over recent decades was much faster. Data source: ILO Modelled Estimates via World Bank (2026); Broadberry and Gardner (2013). License: CC BY.
    15K
  • user avatar
    Our World in Data
    @OurWorldInData
    Jul 27
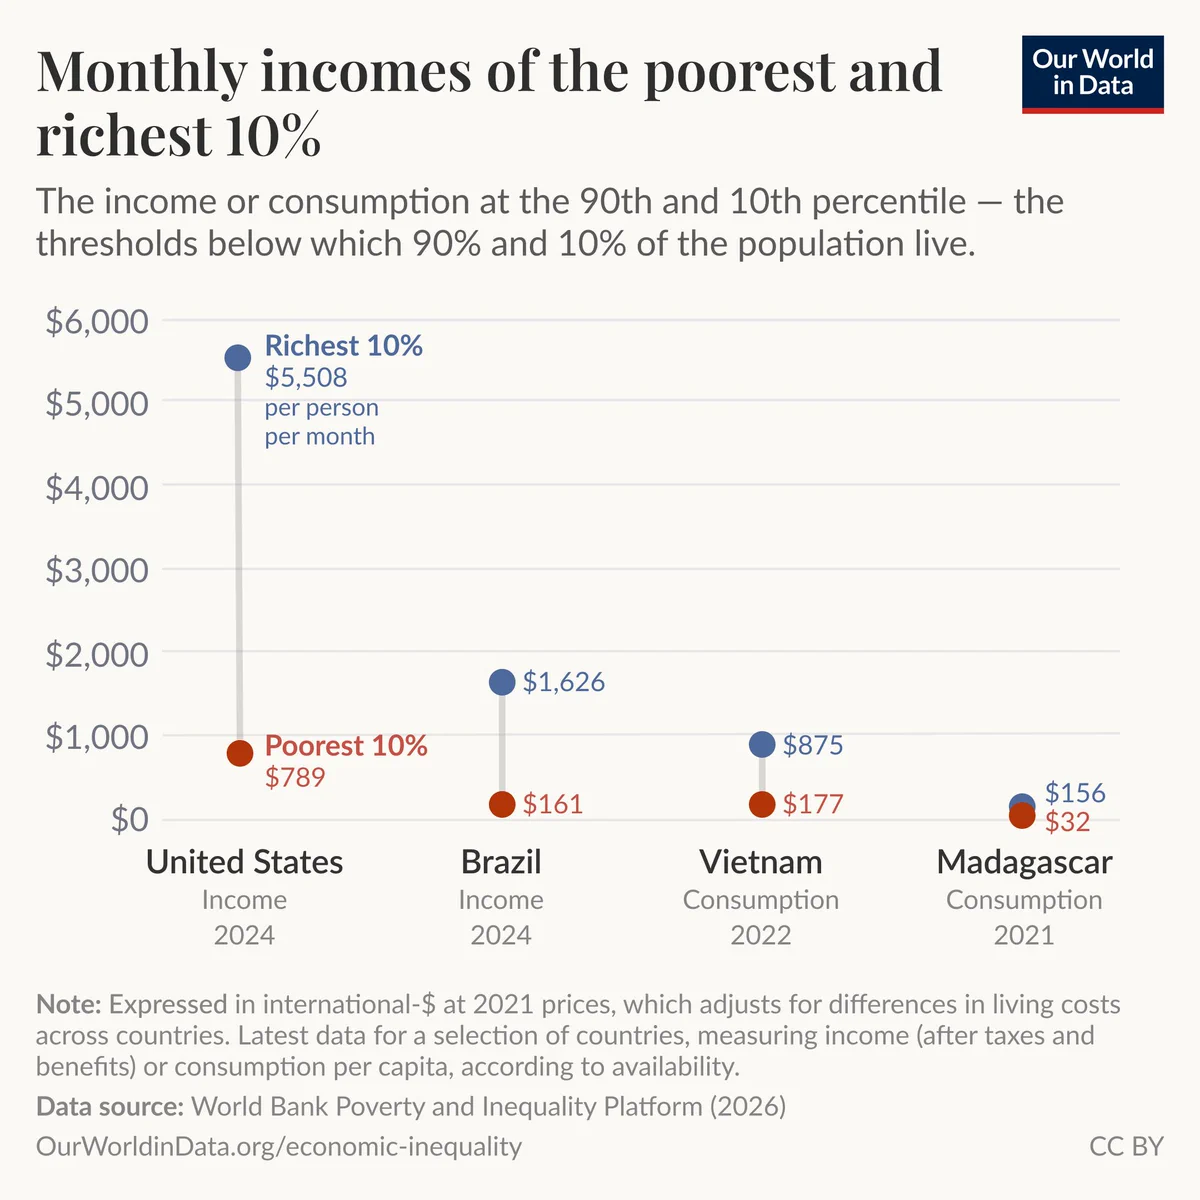
    We have a new Economic Inequality topic page— Public attention to economic inequality has grown a lot over the last twenty years. At the same time, the available data has greatly improved too: it now covers many more countries and longer time periods, and is more comparable and
    Dot-and-line chart of monthly income or consumption at the 90th and 10th percentiles for selected countries, where it illustrates large gaps between the richest and poorest 10%. It shows the richest 10% in the United States at about $5,508 per person per month versus $789 for the poorest 10%, and smaller absolute amounts but clear gaps in Brazil (about $1,626 vs $161), Vietnam (about $875 vs $177) and Madagascar (about $156 vs $32). Data source: World Bank Poverty and Inequality Platform (2026). License: CC BY to Our World in Data.
    25K
  • See @OurWorldInData's full profile

    Sign up
    Log in
Advertisement
Advertisement