University of Bristol

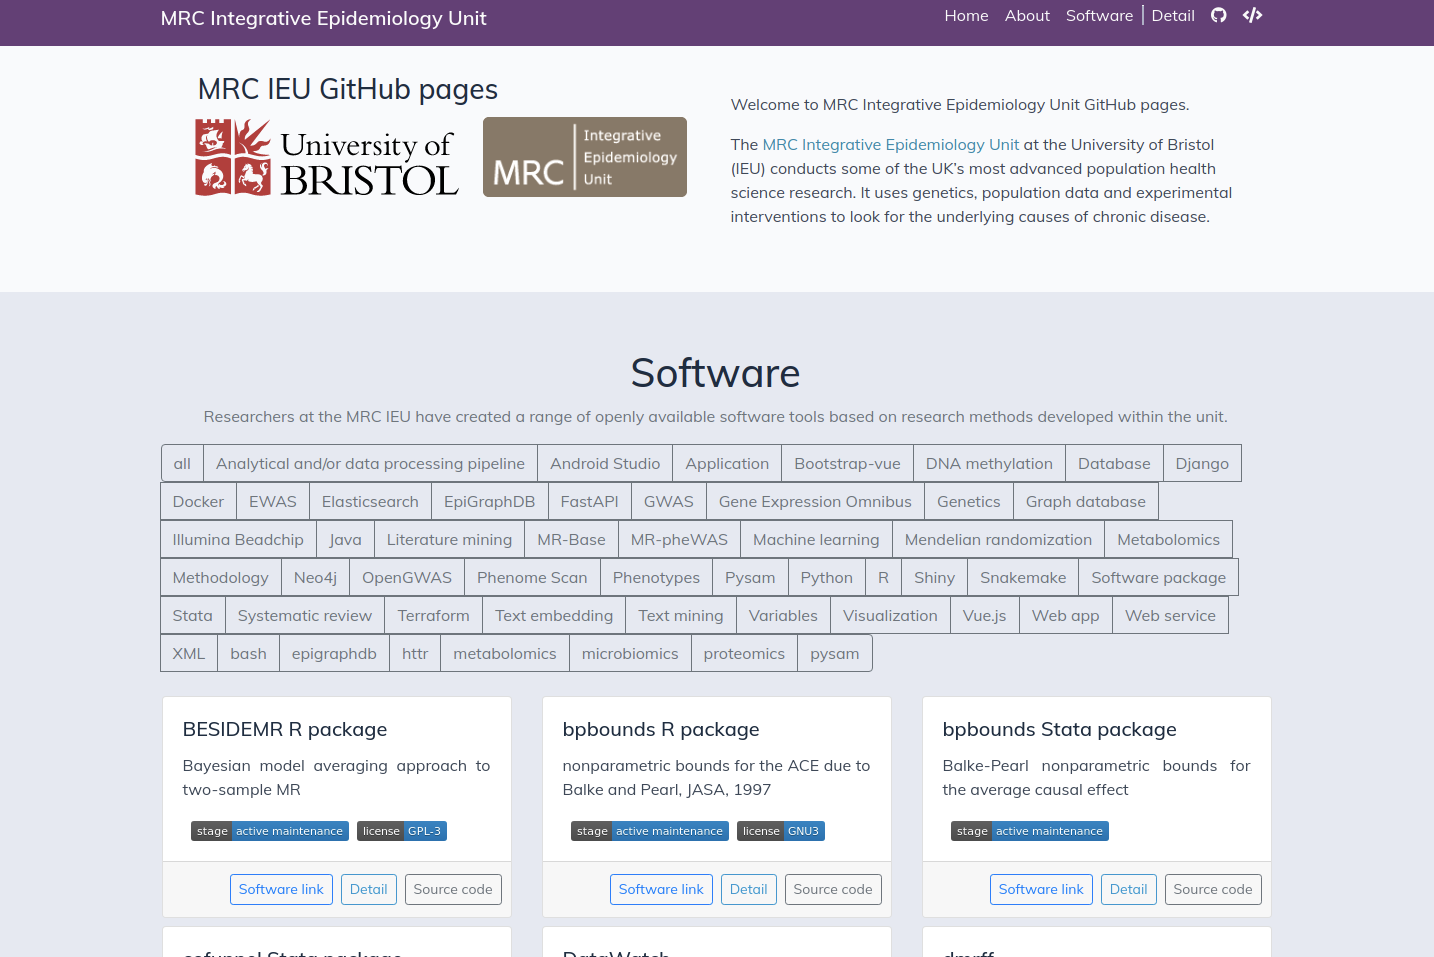
Welcome to MRC Integrative Epidemiology Unit GitHub pages.

The MRC Integrative Epidemiology Unit at the University of Bristol (IEU) conducts some of the UK’s most advanced population health science research. It uses genetics, population data and experimental interventions to look for the underlying causes of chronic disease.

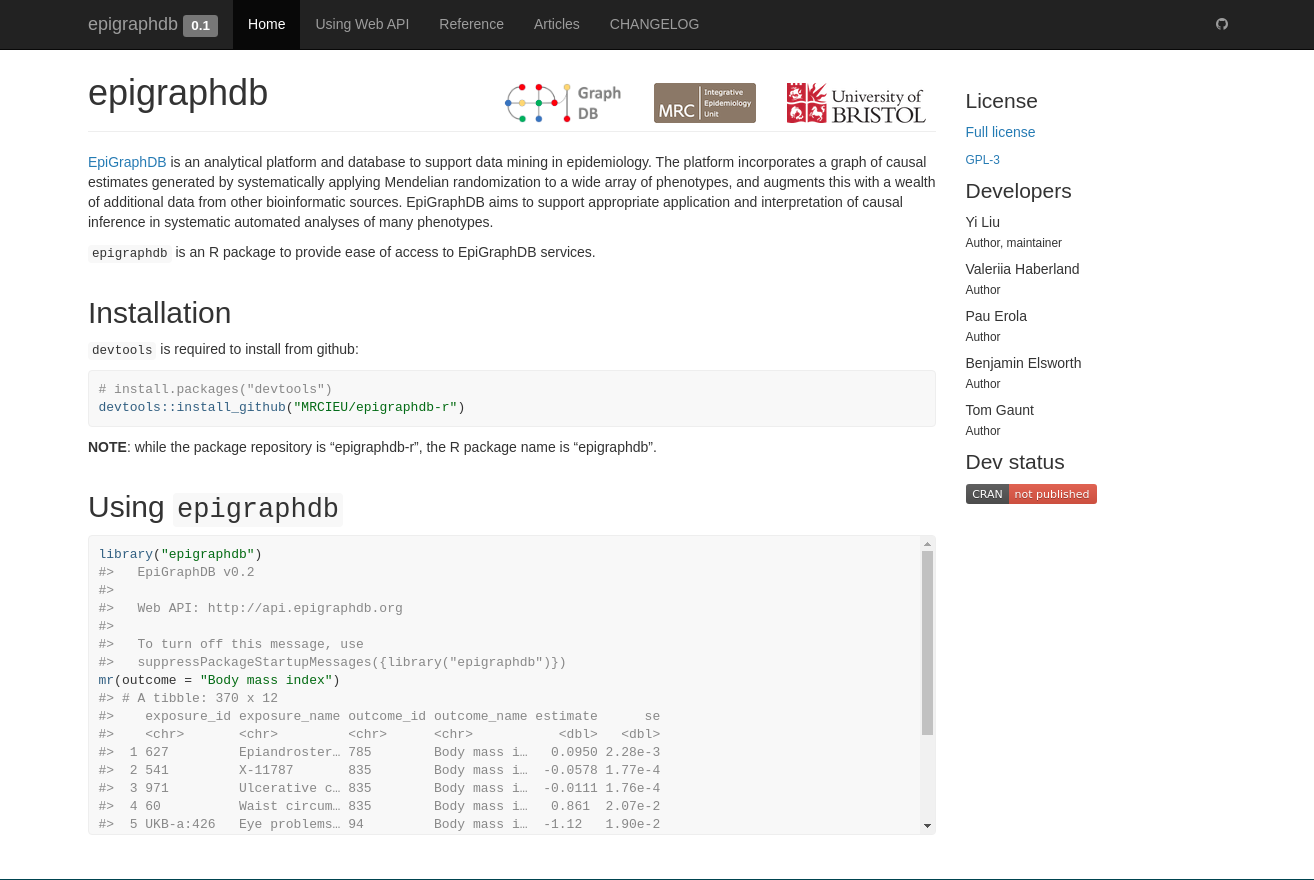
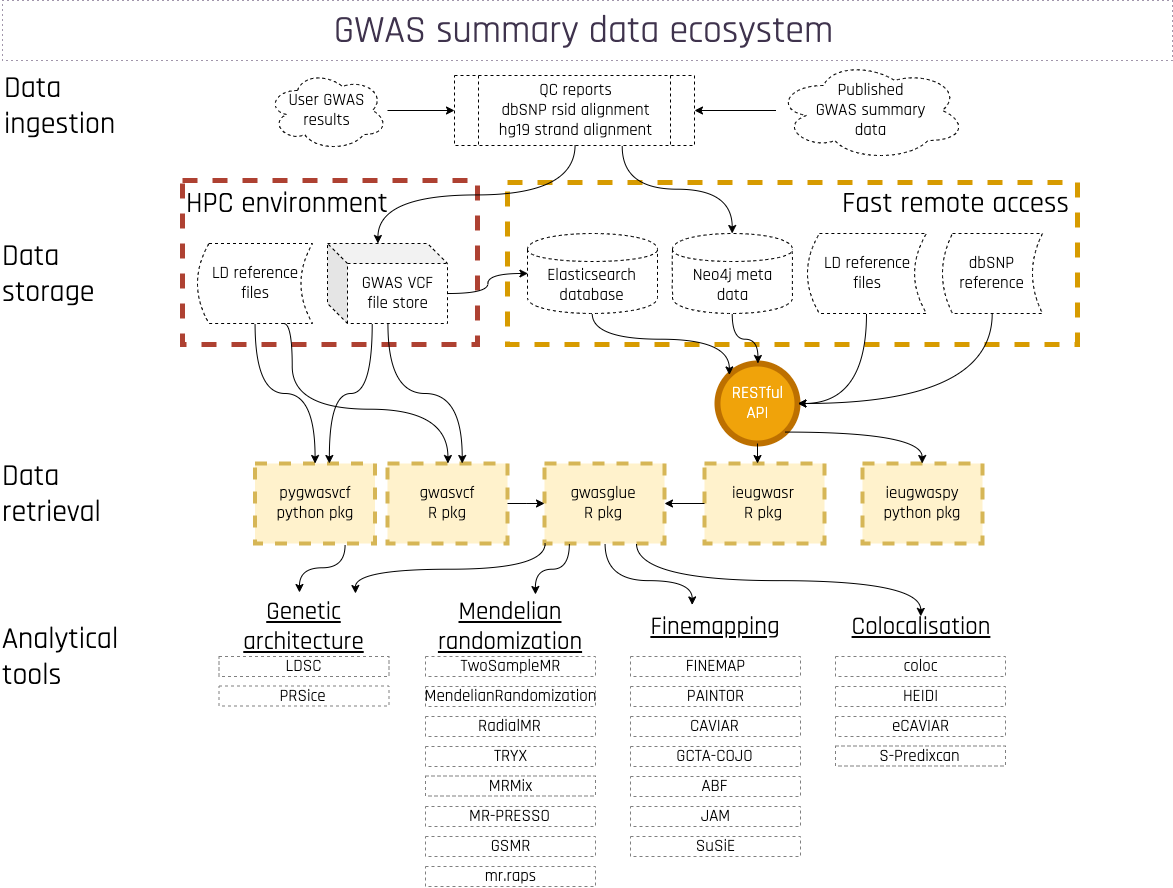
Researchers at the MRC IEU have created a range of openly available software tools based on research methods developed within the unit.

wordcloud

MRC IEU software browser

BESIDEMR R package

Bayesian model averaging approach to two-sample MR

Image
Image
bpbounds R package

nonparametric bounds for the ACE due to Balke and Pearl, JASA, 1997

Image
Image
bpbounds Stata package

Balke-Pearl nonparametric bounds for the average causal effect

Image
confunnel Stata package

contour enhanced funnel plots for meta-analysis

Image
DataWatch

Smartwatch app for data capture using micro-ecological momentary assessment

Image
dmrff

An R package for identifying differentially methylated regions in genome-wide DNA methylation profiles generated using the Illumina Beadchips or RRBS.

Image
Image
dnamalci

dnamalci is an R-package that provides functions to easily apply the DNA methylation alcohol scores (DNAm-Alcs) generated and characterized in: Liu C, Marioni RE, Hedman ÅK, Pfeiffer L, Tsai P-C, Reynolds LM et al. A DNA methylation biomarker of alcohol consumption. Mol Psychiatry 2016. doi:10.1038/mp.2016.192. Yousefi PD, Richmond R, Langdon R, Ness A, Liu C, Levy D et al. Validation and characterization of a DNA methylation alcohol biomarker across the life course. bioRxiv 2019. doi:10.1101/591404.

Image
Image
Image
EpiGraphDB

A graph database and data mining platform for health data science

Image
Image
EpiGraphDB API

API of the EpiGraphDB platform

Image
Image
Image
Annotated Semantic Queries

Natural language query interface to the EpiGraphDB platform

Image
Image
Image
EpiGraphDB Graph Database

Neo4j graph database of the EpiGraphDB platform

Image
Image
Image
EpiGraphDB R package

R package for EpiGraphDB

Image
Image
Image
EpiGraphDB WebUI

EpiGraphDB platform web application

Image
Image
epigraphdbpy

Python package for EpiGraphDB

Image
EpiViz

R package and shiny web app for the production of circos plots to display results from large epidemiological analyses

Image
Image
ewaff

R package for performing epigenome-wide association studies (EWAS).

Image
Image
Image
The EWAS Catalog

A database of associations from EWAS summary datasets, for querying or download.

Image
The EWAS Catalog R package

R package that can be used to query The EWAS Catalog database

Image
Image
The EWAS Catalog web app

The EWAS Catalog platform web application

Image
Image
FATHMM

Predicting the Functional Consequences of Non-Coding and Coding Single Nucleotide Variants (SNVs). Various different prediction algorithms, including FATHMM, FATHMM-MKL, FATHMM-XF, CScape

Image
geograbi

A tool for efficiently grabbing usable metadata and experiment data off GEO for use in R.

Image
Image
GLU R package

A tool for analysing continuously measured glucose in epidemiology

Image
Image
gwas2vcf

Converts GWAS summary statistics into GWAS-VCF format

Image
Image
Image
IEU GitHub Pages

Website promoting software developed by IEU members

Image
Image
IEU GitHub Wiki

Wiki and knowledge base for IEU members

Image
ieugwaspy

Python package to access the IEU OpenGWAS API (modeled on ieugwasr)

Image
iPVs

iPVs, identification of principal variables: The iPVs R package is designed to aid users with with the identification of representative (or independent) principal variables in an inter-correlated data set and to provide an estimation of the number of "independent" features (Me) to aid in deriving an appropriate Bonferroni corrected p-value for a study.

Image
Image
ivonesamplemr Stata package

Useful functions for one-sample (individual level data) Mendelian randomization and instrumental variable analyses

Image
Image
medrxivr

The goal of the medrxivr R package is two-fold. In the first instance, it provides programmatic access to the Cold Spring Harbour Laboratory (CSHL) API, allowing users to easily download medRxiv and bioRxiv preprint metadata (e.g. title, abstract, publication date, author list, etc) into R. The package also provides access to a maintained static snapshot of the medRxiv repository (see Data sources). Secondly, medrxivr provides functions to search the downloaded preprint records using regular expressions and Boolean logic, as well as helper functions that allow users to export their search results to a .BIB file for easy import to a reference manager and to download the full-text PDFs of preprints matching their search criteria.

Image
Image
meffil

R package providing functions for efficiently preprocessing and analyzing very large DNA methylation datasets generated using Infinium HumanMethylation450 or MethylationEPIC BeadChips.

Image
Image
MELODI

MELODI is a hypothesis generator. It identifies enriched overlapping objects which have been assigned to scientific literature and uses these to derive intermediate mechanisms.

Image
Image
MELODI-Presto

A quicker and more agile method to identify overlapping elements between any number of exposures and outcomes.

Image
Image
MendelVar

gene prioritization at GWAS loci using phenotypic enrichment of Mendelian disease genes

Image
Image
MetaboQC

A standardized pipeline for processing, QCing, and summarizing (un)targeted metabolomics data, with special considerations for data derived from the Nightingale and Metabolon platform.

Image
Image
midoc R package

A Decision-Making System For Multiple Imputation. The Multiple Imputation DOCtor (midoc) R package is a decision-making system which incorporates expert, up-to-date guidance to help you choose the most appropriate analysis method when there are missing data. midoc will guide you through your analysis, examining the structure of the dataset to advise on whether multiple imputation (MI) is needed, and if so how to perform it.

Image
Image
Mood Music

A Django application to run an ecological momentary assessment study using text messaging through Twilio, and regularly collect API data (in this case Spotify, but generally adaptable). Currently in development, and may eventually be adapted as an reusable Django app.

Image
Image
mrbayes R package

Bayesian implementation of IVW and MR-Egger

Image
Image
mrdags R package

Code to draw DAG figures for MR studies

Image
Image
Image
MR Dictionary

The MR Dictionary aims to provide useful definitions and descriptions for undertaking, understanding and interpreting MR studies to a wide, inter-disciplinary audience – both those new to MR and those who are experienced in its use but who want to remain up to date.

Image
mrrobust Stata package

Stata version of MR methods

Image
Image
MVMR R package

Multivariable MR

Image
Image
NeDec

Causal network deconvolution

Image
Neo4j Build Pipeline

Building a Neo4j graph using Snakemake and Docker

Image
Image
OneSampleMR R package

Useful functions for one-sample (individual level data) Mendelian randomization and instrumental variable analyses

Image
Image
Image
OpenGWAS

A database of genetic associations from GWAS summary datasets, for querying or download.

Image
API for MRC-IEU OpenGWAS

Backend Python REST-API for https://gwas-api.mrcieu.ac.uk

Image
Image
OpenGWAS Elasticsearch Cluster

Terraform code to create OpenGWAS Elasticsearch cluster on Oracle Cloud

Image
OpenGWAS Elasticsearch Indexer

Python code to add data to OpenGWAS Elasticsearch

Image
PharmIV

a power calculator for instrumental variable analysis in pharmacoepidemiology

Image
Image
PHESANT R package

Run a phenome scan (pheWAS, Mendelian randomisation (MR)-pheWAS etc.) in UK Biobank

Image
Image
pygwasvcf

Python parser for GWAS-VCF

Image
Image
RadialMR R package

Radial MR

Image
Image
RbG Study Planner

RbG study planner assists in the planning stages and power assessment of recall by genotype studies.

Image
reffadjust Stata package

random effects adjustment

Image
RMVMR R package

Multivariable Radial MR

Image
Image
robvis

robvis makes it easy to produce high quality figures that summarise the risk-of-bias assessments performed as part of a systematic review or research synthesis project.

Image
Image
StopWatch

Smartwatch app for passive detection of cigarette smoking

Image
TeMMPo

Text Mining for Mechanism Prioritization

Image
tmsens

Sensitivity analysis using the trimmed means (TM) estimator: The tmsens R package is designed to aid users in performing a trimmed means analysis on a given dataset, and calculating, under assumption of normally distributed outcomes, the bias and bias-adjusted estimate for various user-specified parameters.

Image
Image
uob-sharepoint-scraper

Scraper for Microsoft SharePoint sites in University of Bristol

Image
Image
GWAS of trait variance

Software to perform GWAS of trait variance effects to prioritise loci for detection of genetic interaction effects

Image
Image
Vectology

Exploring biomedical variable relationships using sentence embedding and vectors

Image
xtmixediou Stata package

Stata command to estimate the linear mixed effects integrated Ornstein-Uhlenbeck model

Image