Generate dashboards, analytics, chart based wireframes with AI
MockFlow AI just got smarter: wireframes generated with AI can now include real charts, analytics, and data visualizations. This makes it easier than ever to design dashboard wireframes and UIs that showcase graphs, reports, and insights.
Prompt-to-Wireframe creation in MockFlow continues to evolve with new features, fixes, and smarter generation. Today’s update is a major step forward, especially for wireframing business apps.
MockFlow has long supported native chart components to help teams brainstorm UIs with graphs. Now, this capability is extended to AI. With just a text prompt, you can instantly generate wireframes for dashboards, analytics, metrics, mobile charts, and more, making it easier to visualize complex data-driven interfaces.
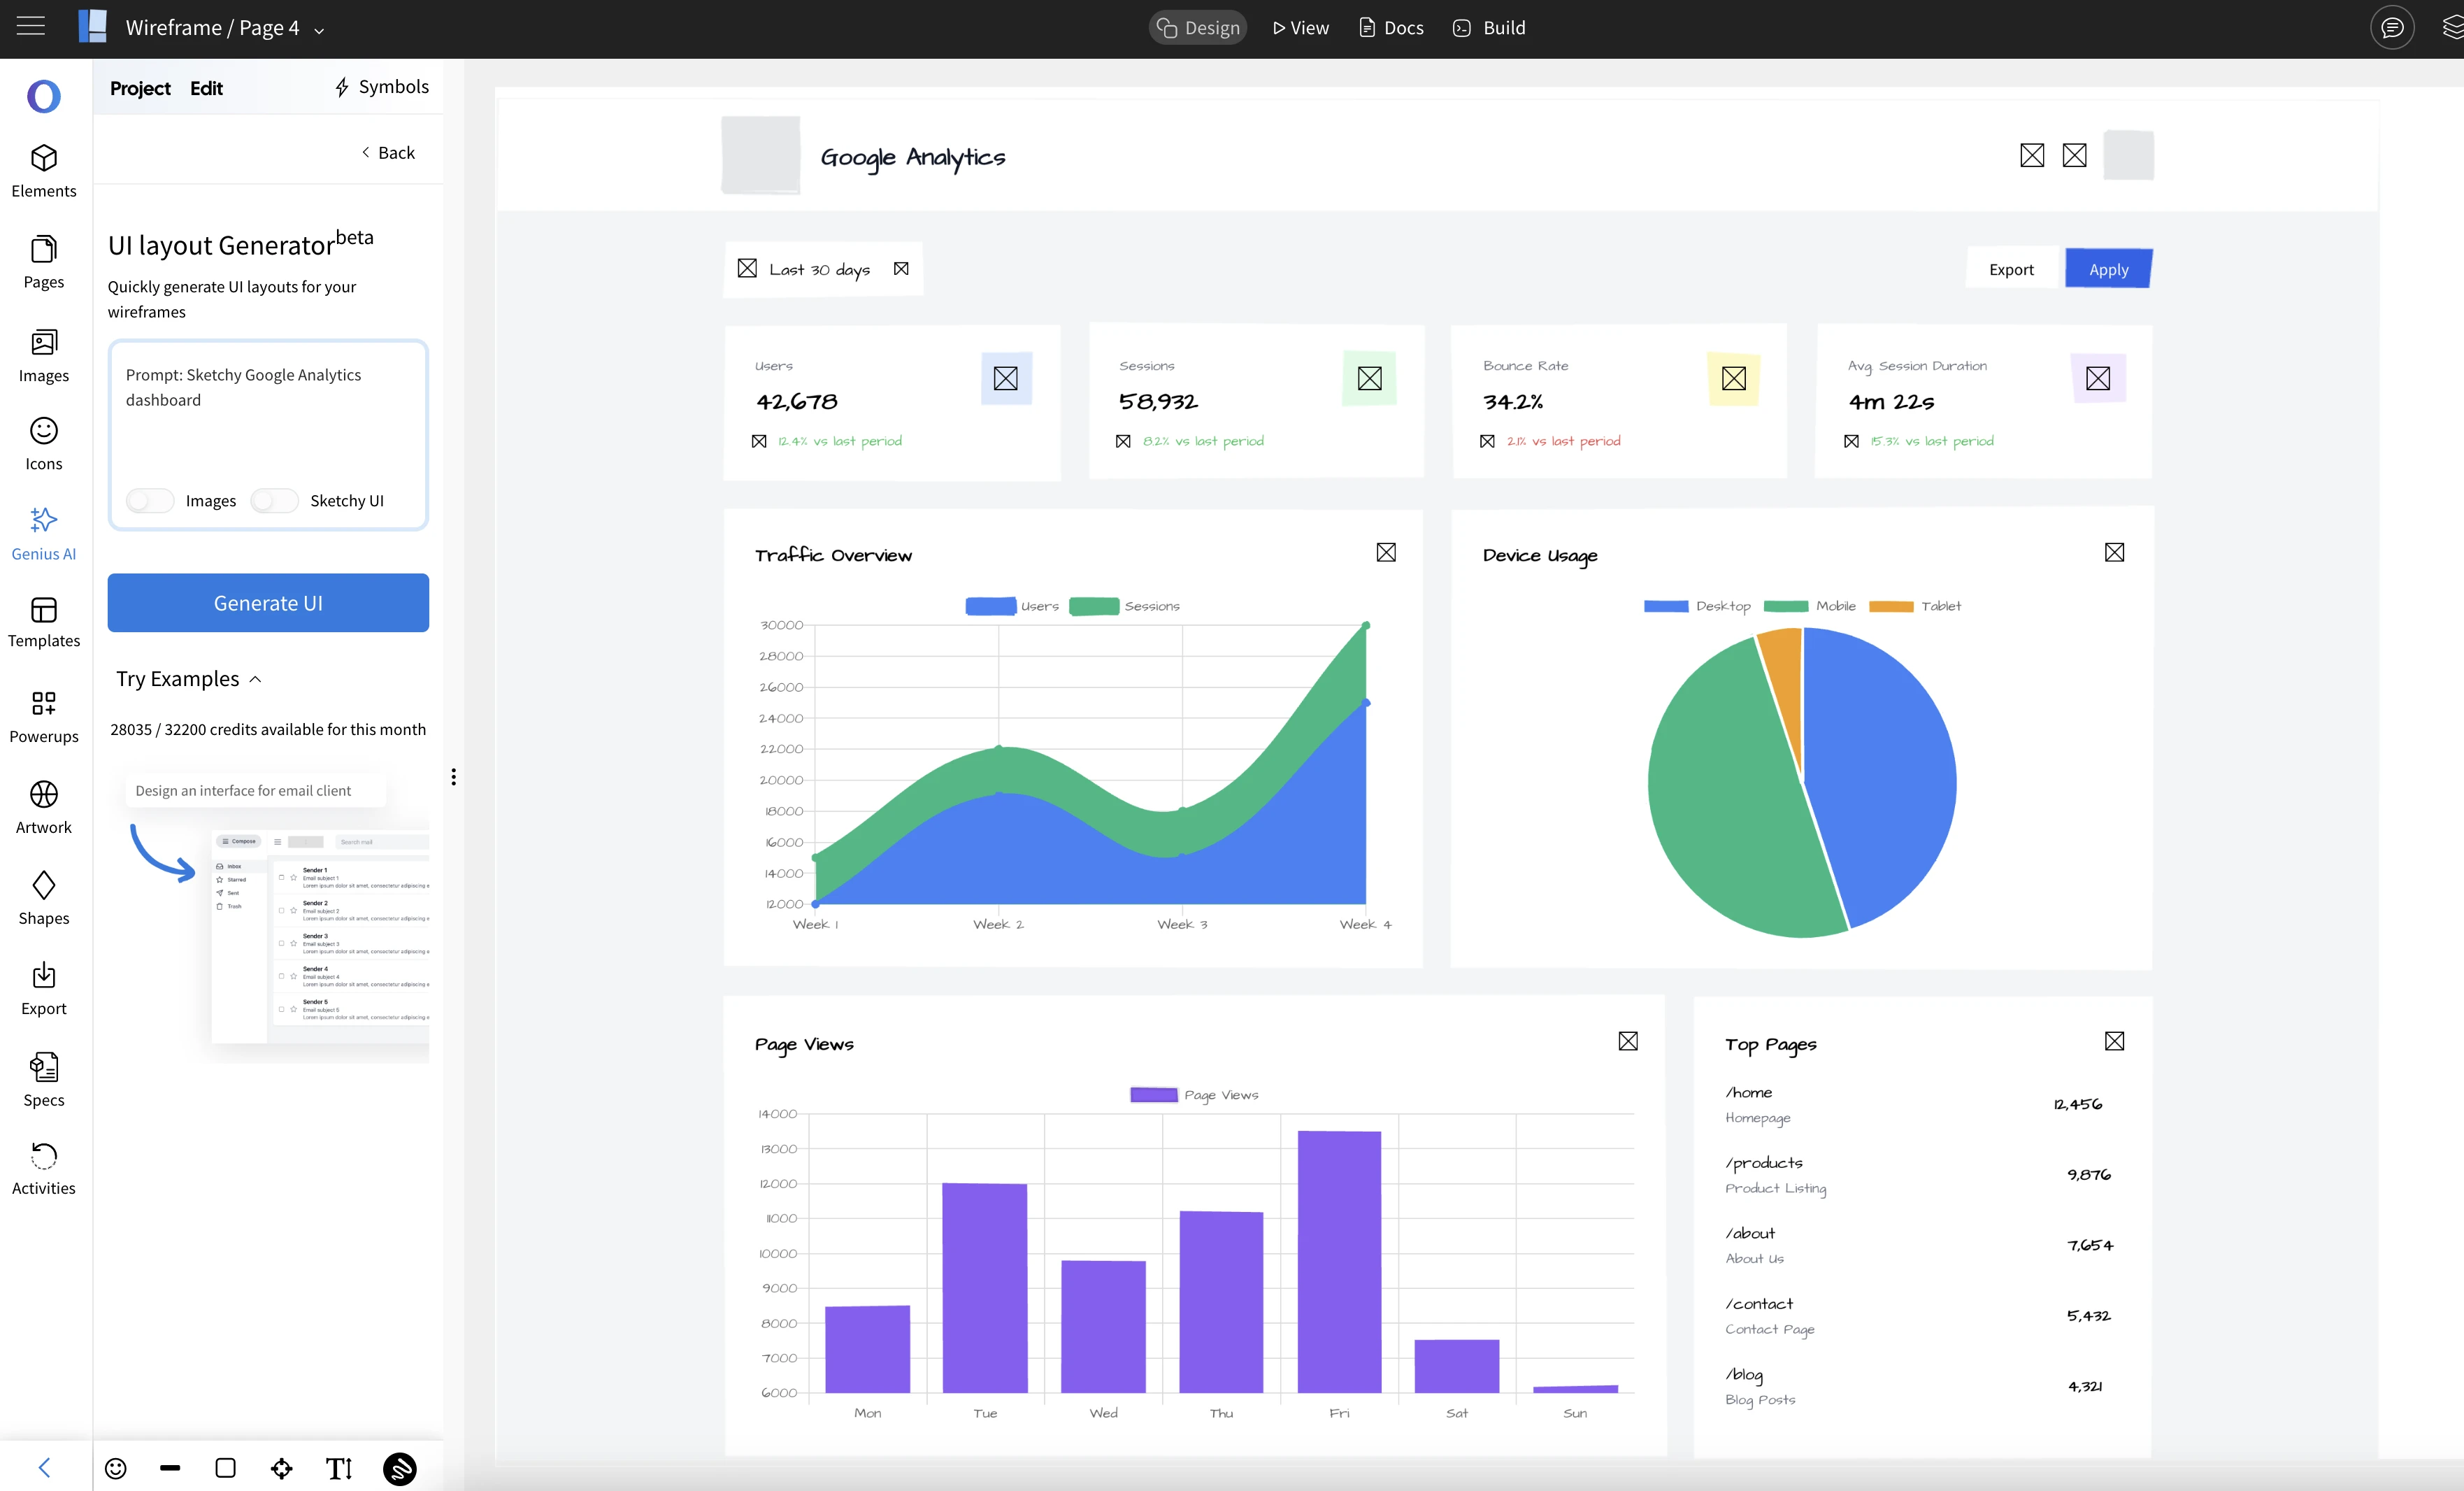
For added flexibility, MockFlow AI also supports sketchy chart generation. By simply adding the keyword ‘sketchy’ to your prompt, you can create hand-drawn style wireframes that are perfect for early-stage brainstorming.
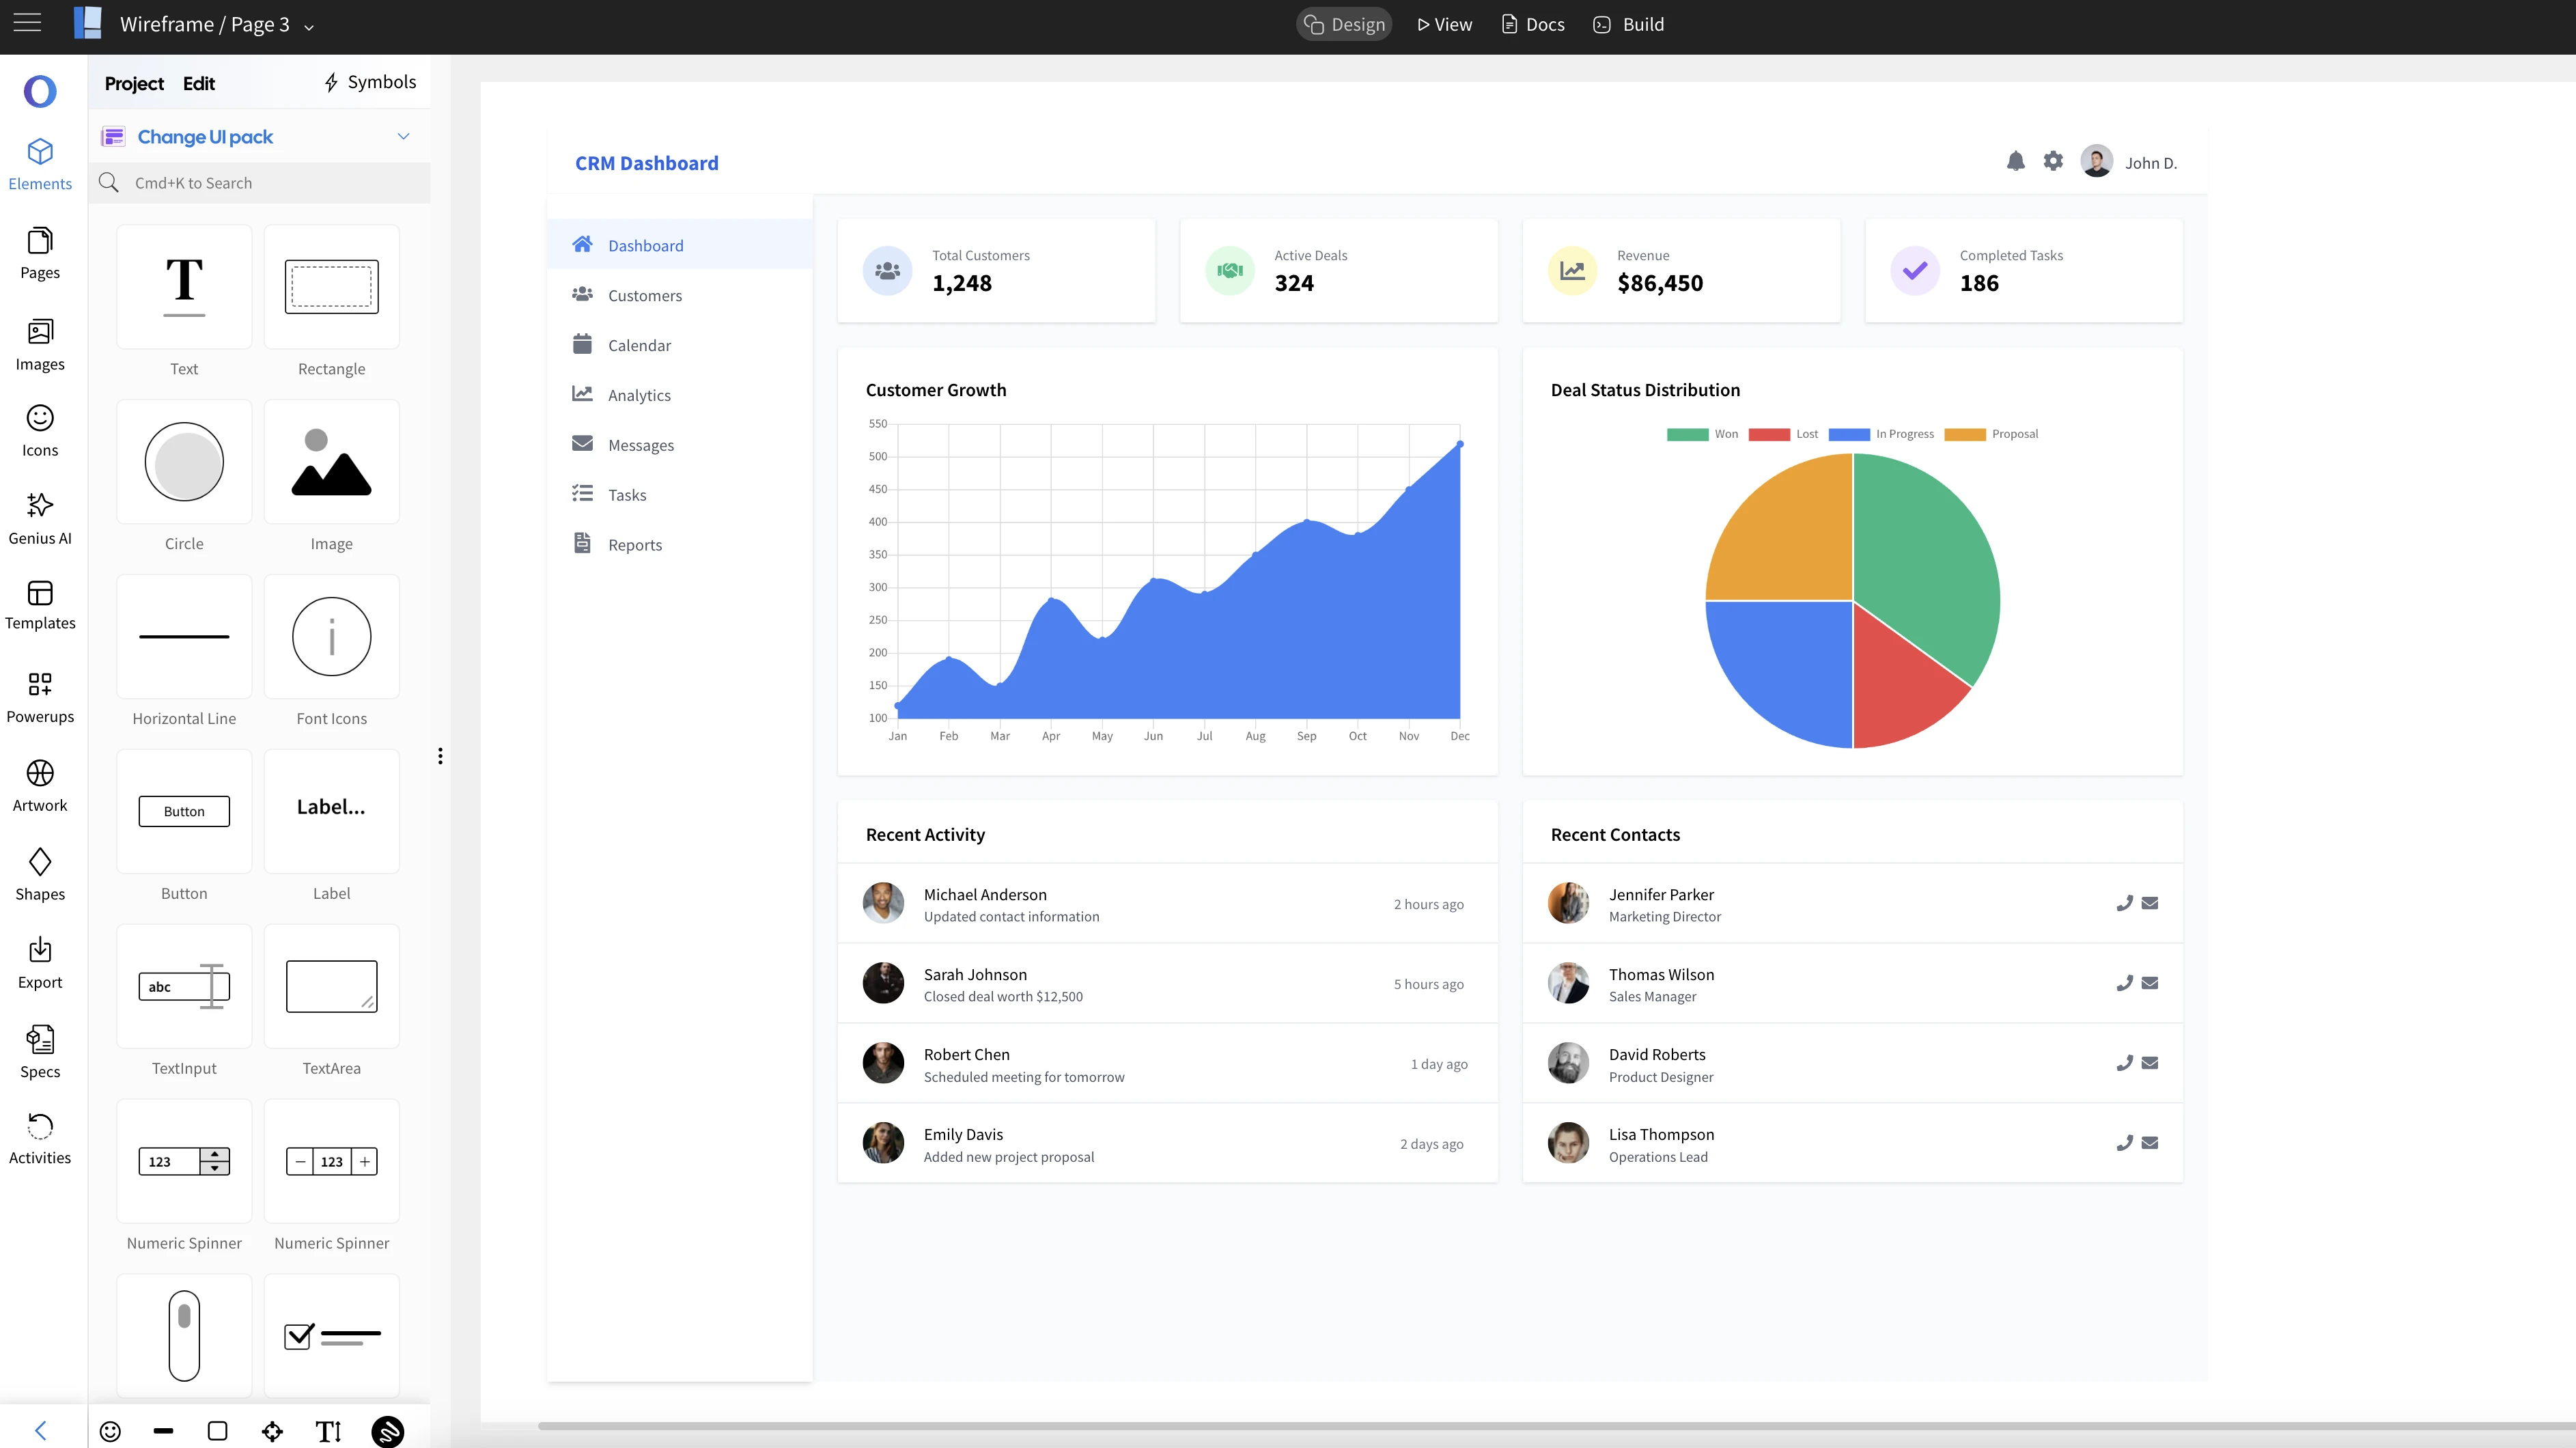
Prompt: CRM dashboard
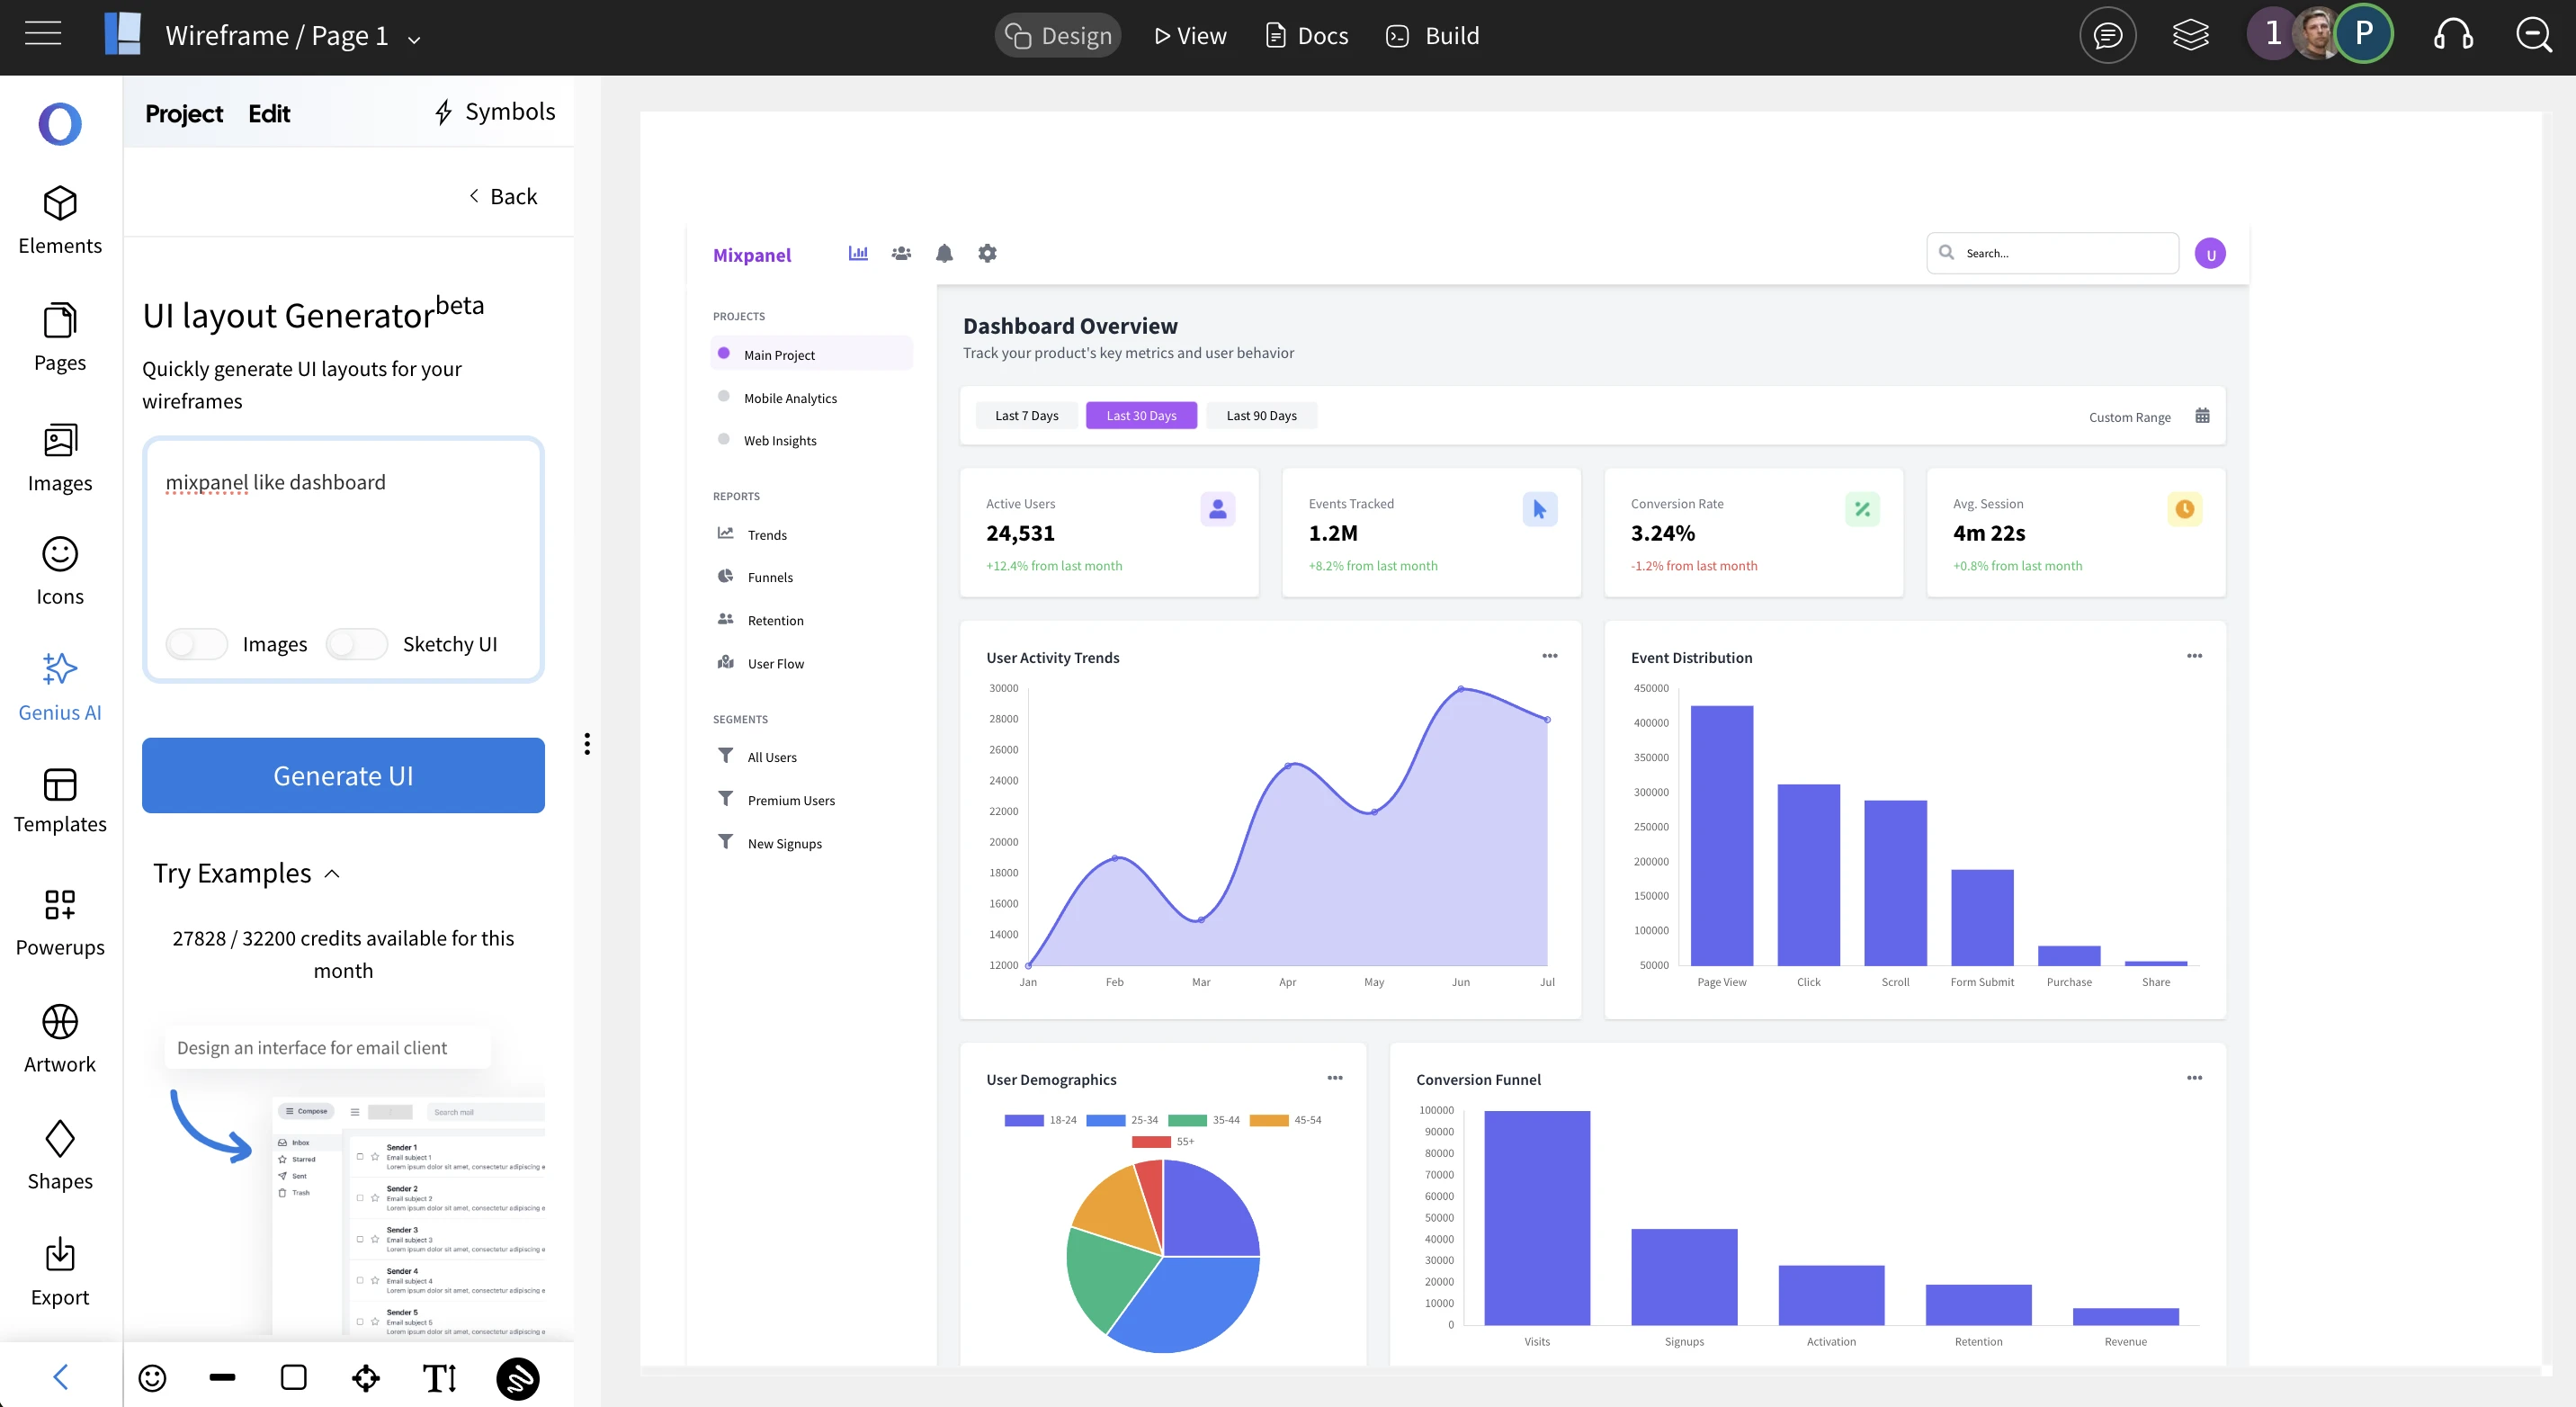
Prompt: Mixpanel like dashboard
Prompt: Sketchy Google Analytics dashboard
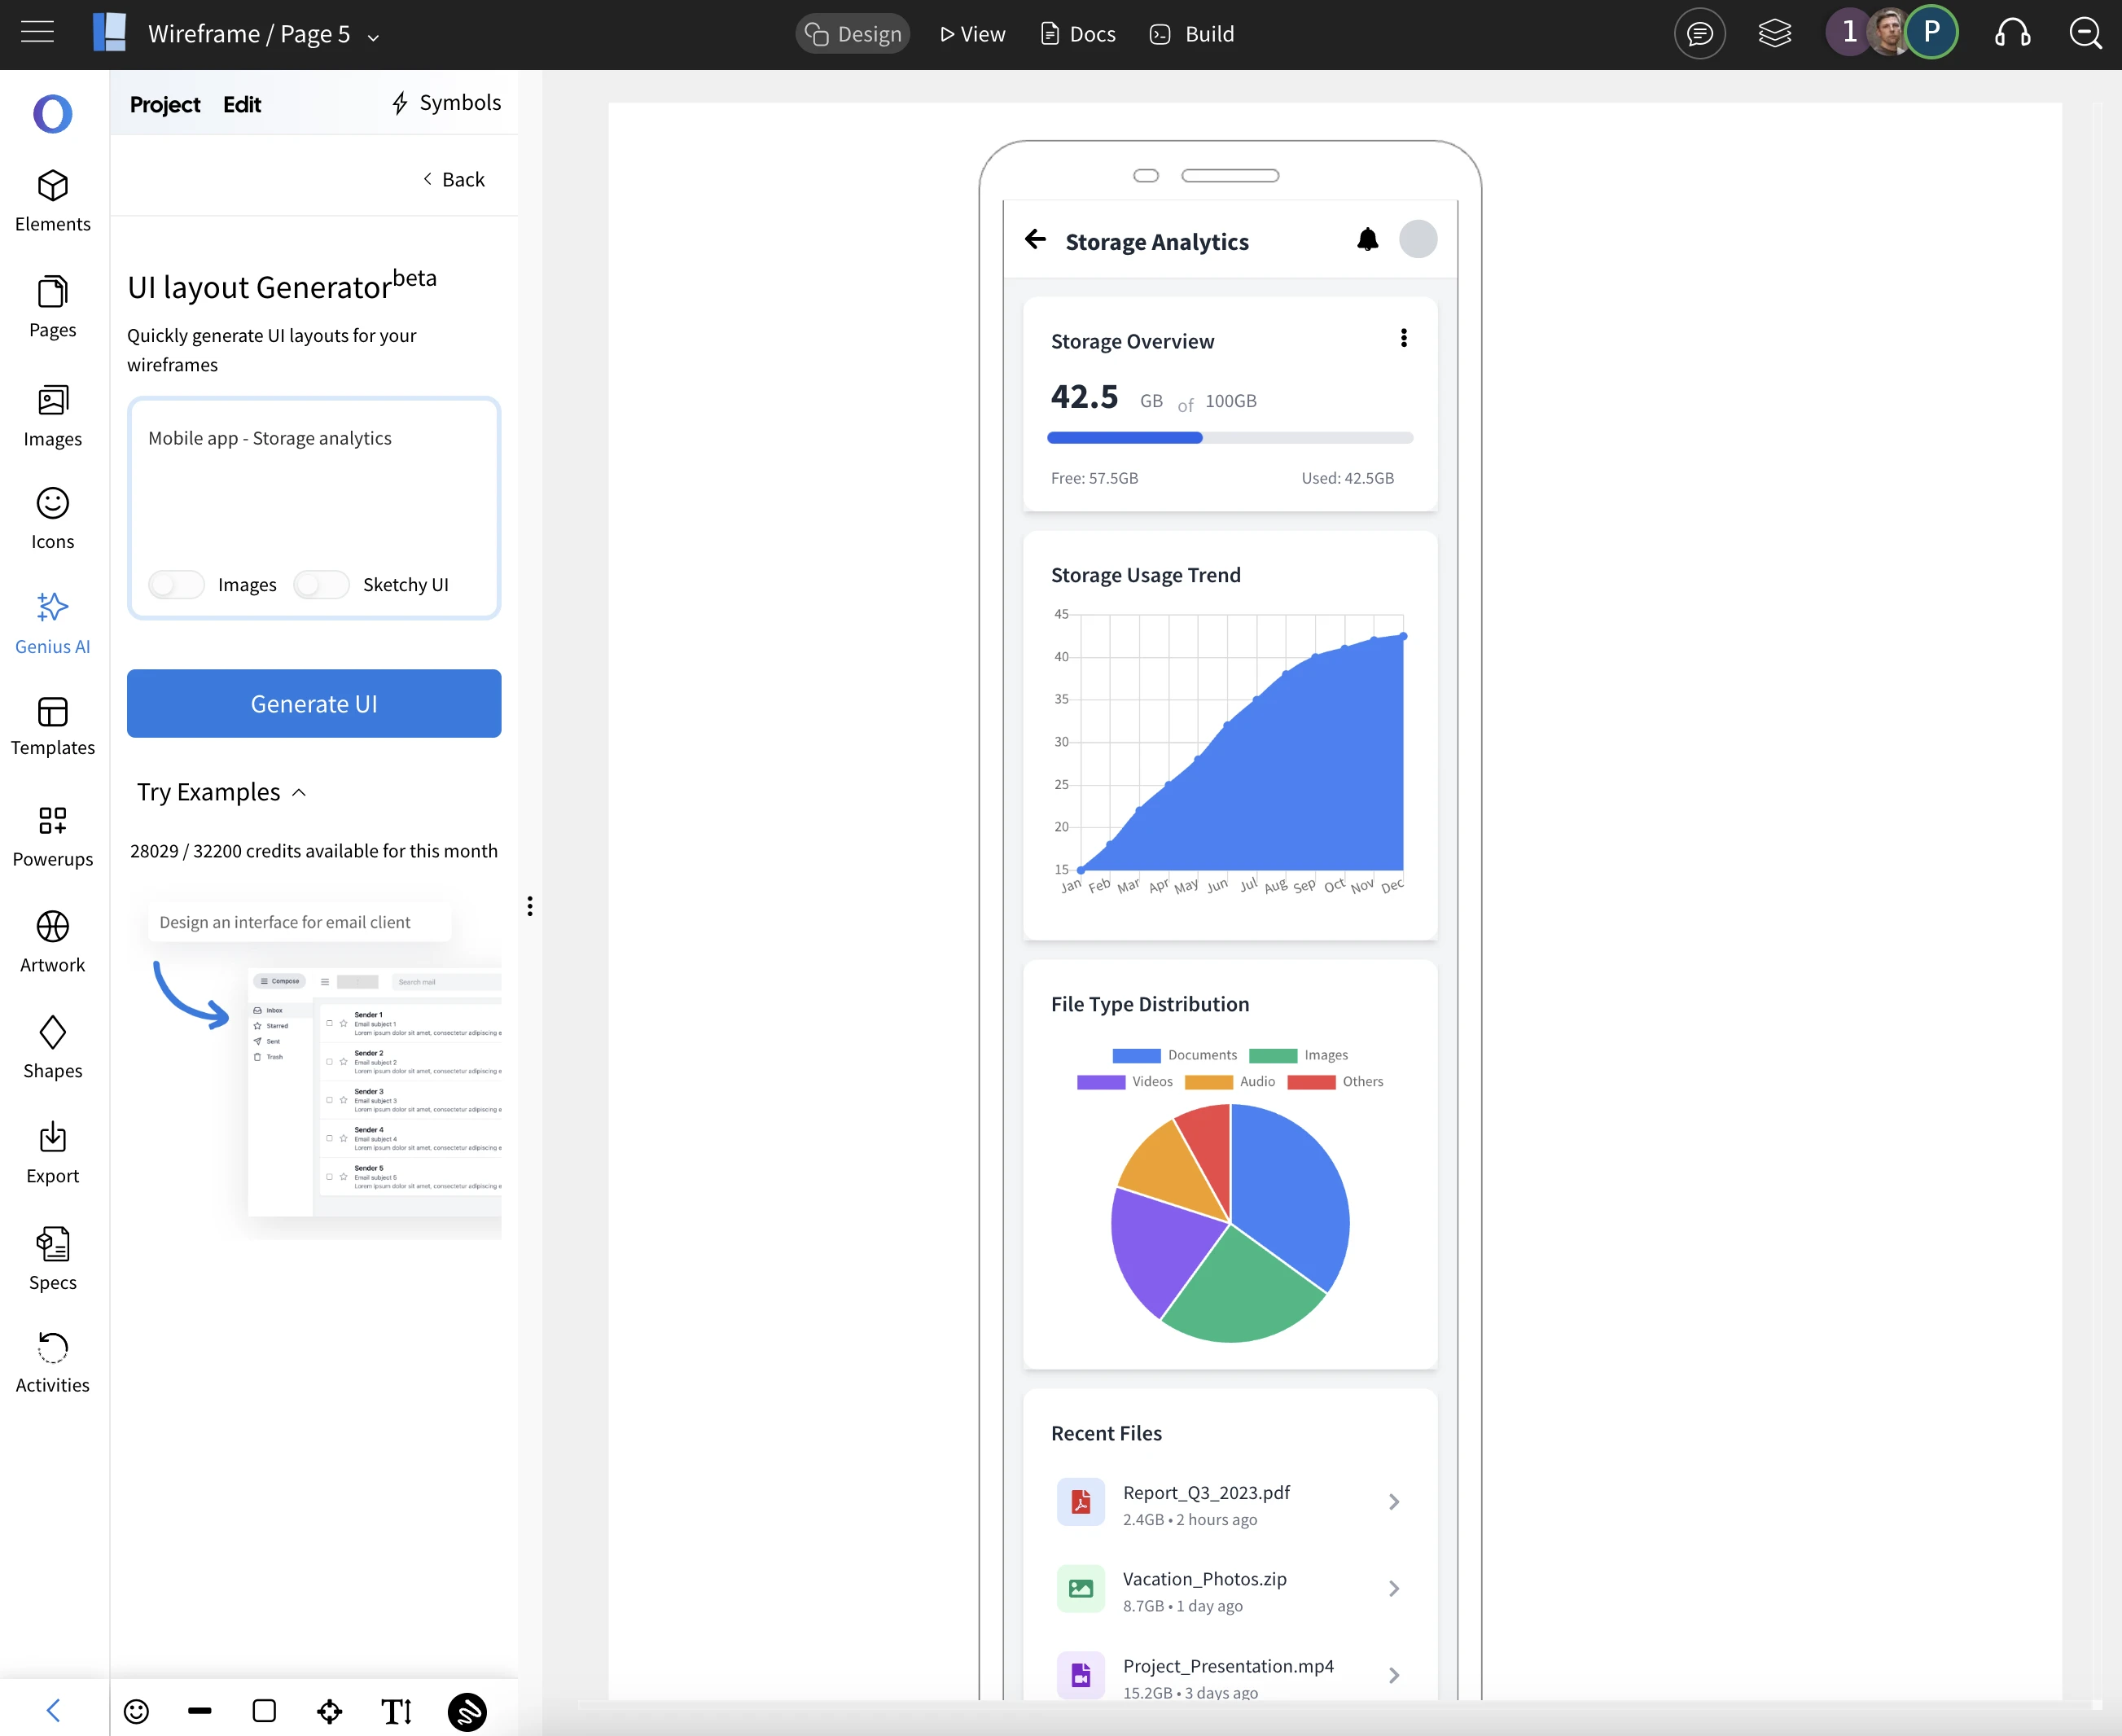
Prompt: Mobile app - Storage analytics
In this release, MockFlow AI now supports all built-in chart components—including Bar Chart, Line Chart, Area Chart, Pie Chart, Bubble, Scatter, and Radar. This means your AI-generated wireframes can instantly visualize a wide variety of data layouts. Coming soon, we’re also adding AI support for more native visualizations like Gauge and Treemap to make your dashboard wireframes even more powerful
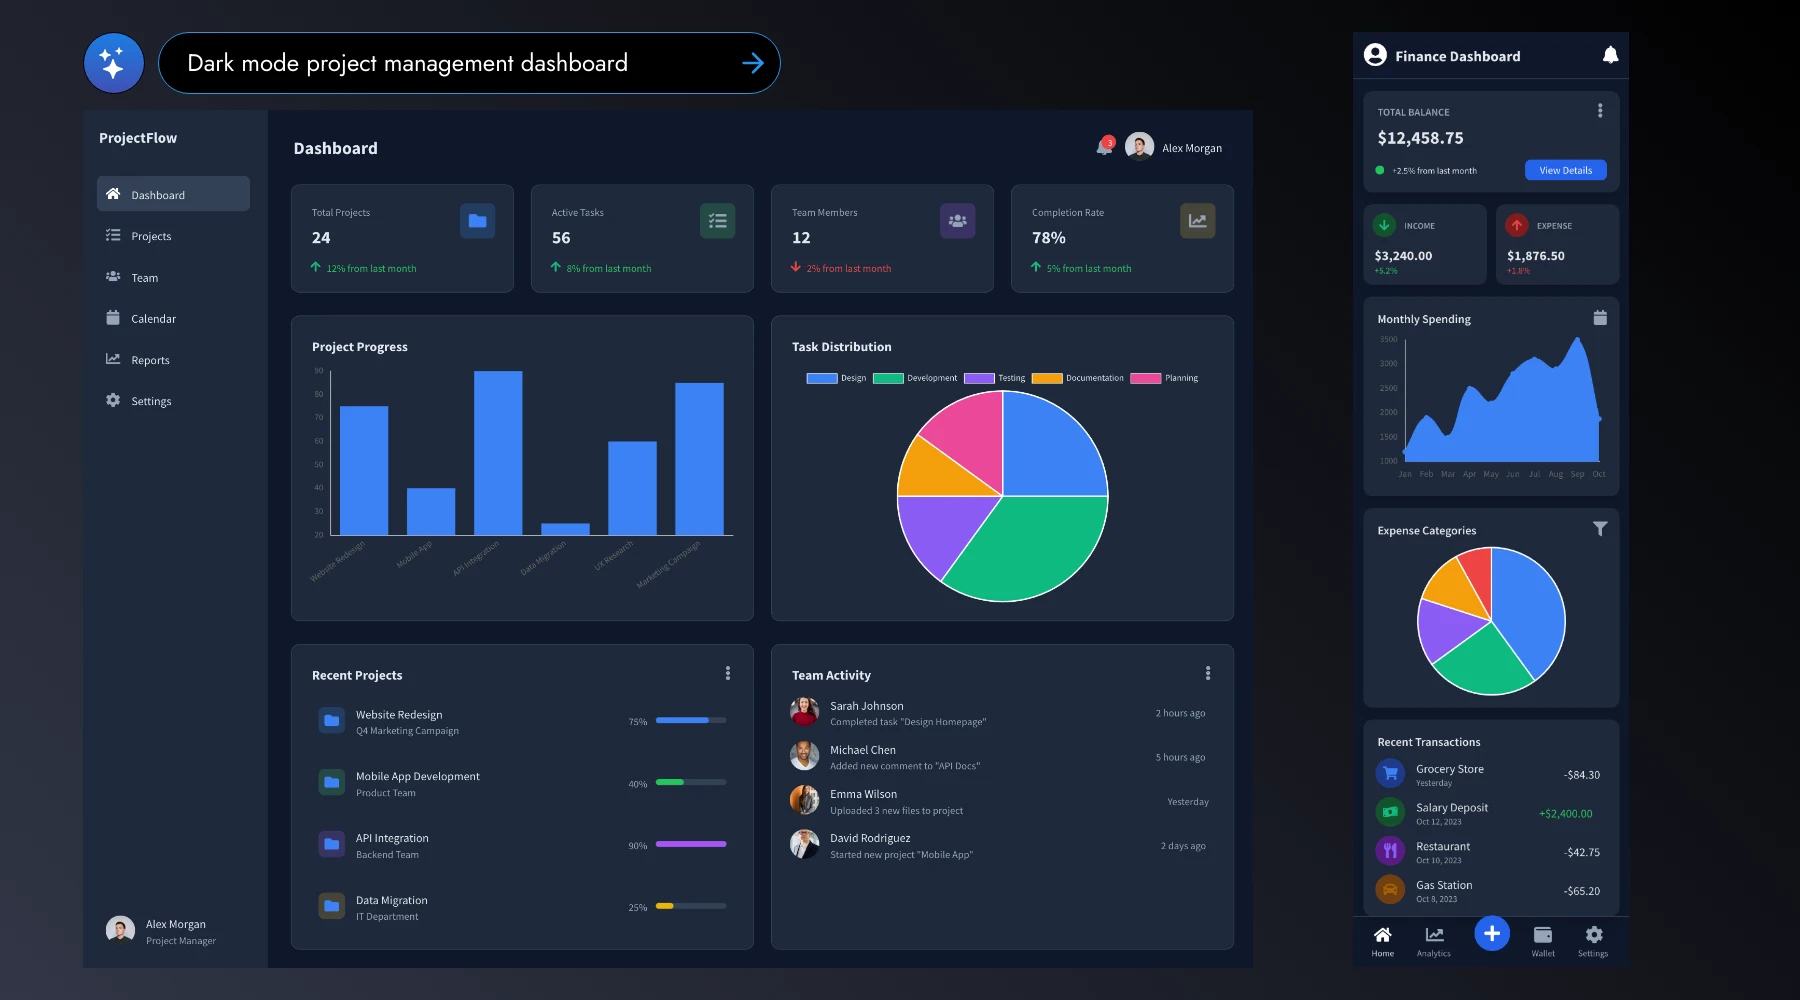
Since AI is included in all plans, you can start exploring this feature right away. Simply generate wireframes with prompts like ‘Finance dashboard’, ‘CRM analytics’, or ‘Football club metrics’. You can also experiment by adding themes, modes, or specific visualizations you’d like to see in your design. Just bring your idea as a prompt and WireframePro will instantly turn it into a wireframe now even if it involves charts.