2026 M+R Benchmarks Study

Come explore the 2026 M+R Benchmarks Study Zine — hands on, lovingly crafted, and crammed full of data and insights covering nonprofit fundraising, advocacy, and marketing.

Explore by chapter

Manifesto

Hi.

We are living through a time of disruption and dislocation. Institutions are wobbling, the pace of change is accelerating, the gyre is getting pretty dang wide, and people and organizations are left scrambling to keep up. 

For nonprofit fundraisers and organizers, sudden shifts in the tools we use to reach audiences add further chaos and uncertainty. A shrinking number of providers control our ability to reach supporters through email, SMS, and other channels. Social media platforms continue to proliferate, subject to the whims of billionaires. The rapid adoption of AI tools is transforming the most basic functions of web marketing, including advertising and search. 

It can be scary, so many changes coming so fast. But the truth is, very few nonprofits exist with the purpose of maintaining the status quo. Change is what we do.

In order to move their causes forward, nonprofits must adapt and respond with creativity, tenacity, and courage. It also helps if, amid the churning chaos, we can find some bits of solid ground to stand on. 

Here’s something solid, unshakeable: the commitment and passion of the people who work at nonprofits of every size, across every issue area, in the face of all adversity. Once again this year, we are honored to be joined by some of the smartest, bravest, most innovative nonprofit folks around. We are so grateful for the 180 M+R Benchmarks Study participants who contributed data and answered questions about how they are navigating this moment. 

As you’re about to see, there were some big swings in the data over the past year. And yes, those swings are in part a reflection of the unprecedented nature of this moment and the tireless work of nonprofit staff. They also represent something else, something extraordinary: the response of millions of individual activists, donors, and everyday people. 

The clicks, donations, actions, and other data points we track are profound acts of hope and empathy. They are demands for a healthier world, a kinder world, a gentler world. They are whispers of compassion, and they are shouts of defiance. 

This is solid ground, too. Friends, neighbors, and strangers holding together, contributing what they can, building a future worth believing in. 

We can’t help but feel inspired by these individual acts of engagement, from nonprofit staff and supporters alike. They are a reminder that for all the attention paid to those with the most power, true change in this world always comes down to people acting individually and collectively. 

In that spirit, we are proud to share the 2026 M+R Benchmarks Study Zine — hands on, lovingly crafted, and personally meaningful to every one of us who worked on this project. Thank you for reading, and thanks again to the nonprofit staff who contributed data, answers, and inspiration.

ImageThe M+R Benchmarks Team

Image

Faces behind the zine

ImageImageImage
Image
jonathan benton, data
Image
theresa bugeaud, data
Image
evan aczon, data
Image
kristen friedel, data
Image
michelle hertel, data
Image
alec macintyre, data
Image
lia mancuso, data
Image
anne paschkopić, data
Image
dan stevens, data
Image
porscha stiger, data
Image
taylor van aalderen, data
Image
will valverde, writing
Image
laura klavon, design & marketing
Image
lucy midelfort, outreach & marketing
Image
kait grable gonzalez, marketing
Image
madeline stanionis, sponsor & marketing
Image
bobby burch, website
Image
tom giordano, website
Image
bobby goldstein, website
Image
eddie geller, video
Image
ankur asthana, insights
Image
sarah coughlon, writing & insights
Image
beth dahlman, insights
Image
courtney humphries, insights
Image
marc ruben, insights
Image
diego ruiz, insights
Image
anne thompson, insights
Image
rachael wolber, insights
ImageImage

We believe that the rad nonprofits we work for are essential to advancing the cause of justice, alleviating suffering, and solving the greatest challenges we face. 

We bring experience, talent, and unshakeable dedication to our clients to help good causes win — through fundraising and supporter engagement, movement building and issue advocacy, and message and brand development.

We have more resources, advice, tools, stickers, buttons, and other fun stuff waiting for you at www.mrss.com.

Find out more about working at M+R and join our crew at www.mrss.com/careers.

Methodology

Image
Image

Wherever possible, we have broken out the findings by sector. Each of our participants self-identified the appropriate sector (or, in some cases, fell outside of our defined sectors and selected “Other”). If you are not sure which sector represents your peer group, review the full list of participants to find where you belong.

Image

We also sort our participants by size. For our study:
“Small” refers to nonprofits with annual online revenue in 2025 below $1,000,000;
“Medium” nonprofits reported 2025 online revenue between $1,000,000 and
$5,000,000;
“Large” nonprofits reported 2025 online revenue between $5,000,000 and
$10,000,000;
“Extra Large” nonprofits reported 2025 online revenue over $10,000,000

Image

The averages displayed in each chart and discussed throughout Benchmarks represent the median figure for a given metric for all participants who reported data. We do this to avoid having one or two outliers with extraordinary results from having too much influence, as might happen with a mean average.

Image

Not all participants were able to provide data for every metric. If a chart does not include data for a certain sector or size, it’s because we were not able to collect enough results to report a reliable average.

Image

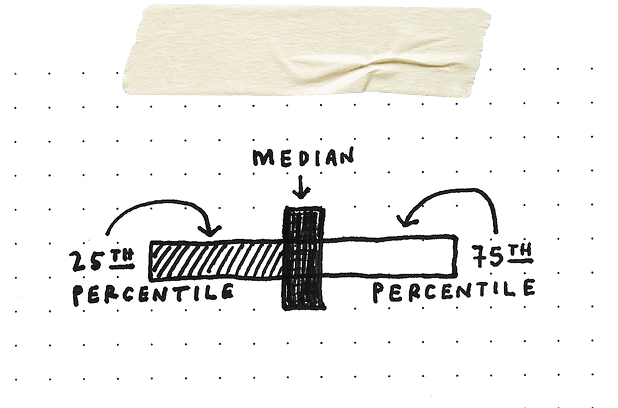
In addition to the median figure, box-and-whisker charts display a range showing the 25th percentile to the 75th percentile. Half of all reported values fell within this range, which can be considered “normal” results for participants in our study.

Image

Do not compare this year’s M+R Benchmarks findings to previous editions! Our participant pool changes each year, and a combination of inflation and some extremely successful programs have caused us to change how we break out nonprofits by size. We have also updated how we calculate some metrics. (See the sparkling discussion of home page and donation speed indices in our Website Performance section for one example.)

Image

A corollary to 6: Wherever we include year-over-year changes, we are including long-term data from this year’s participants. 

Image

If you have any more questions, please reach out to @mrcampaigns or email [email protected].

How to read the charts

Image

Download the 2026 report

Google reCaptcha: Invalid site key.