Log inSign up
Carbon Brief
80.1K posts
Image
user avatar
Carbon Brief
@CarbonBrief
Award-winning journalism focused on #climatechange, science, energy and policy. Subscribe to our free newsletters: bit.ly/CBnewsletters
UK
carbonbrief.org
Joined December 2010
6,524
Following
193.2K
Followers
  • Pinned
    user avatar
    Carbon Brief
    @CarbonBrief
    3h
    Project Cosmos is Carbon Brief’s universe of 1.8 million climate science papers. In this video, science correspondent @AyeshaTandon explains the database’s features. Explore the database here ➡️ bit.ly/4vkRgad
    Image
    00:00
    994
  • user avatar
    Carbon Brief
    @CarbonBrief
    Apr 23, 2019
    Animation: The countries with the largest cumulative CO2 emissions since 1750 Ranking as of the start of 2019: 1) US – 397GtCO2 2) CN – 214Gt 3) fmr USSR – 180 4) DE – 90 5) UK – 77 6) JP – 58 7) IN – 51 8) FR – 37 9) CA – 32 10) PL – 27
    Image
    00:00
  • user avatar
    Carbon Brief
    @CarbonBrief
    Dec 17, 2022
    Richest people in UK ‘use more energy flying’ than poorest do overall | @Josh_Gabbatiss w/ comment from @baltrusz @martiskainen Read: bit.ly/3FUULgi
    Chart title: The richest British people use more energy flying than the poorest use overall.
    5.1M
  • user avatar
    Carbon Brief
    @CarbonBrief
    Jan 4, 2020
    UNEP: 1.5C climate target ‘slipping out of reach’ | @hausfath @robbie_andrew j.mp/2pQPnXg
    Image
    00:00
  • user avatar
    Carbon Brief
    @CarbonBrief
    Oct 5, 2021
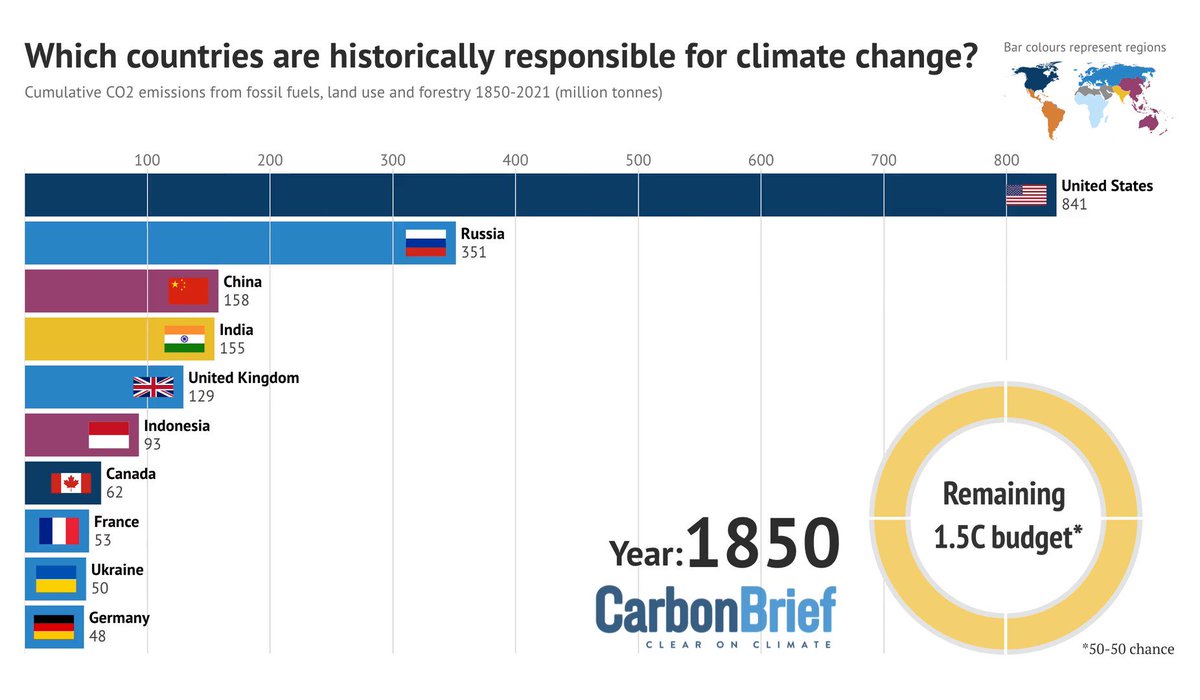
    NEW | Analysis: Which countries are historically responsible for climate change? | @DrSimEvans Cumulative fossil fuel & land emissions 1850-2021 🇺🇸 US 509GtCO2 🇨🇳 CN 284 🇷🇺 RU 172 🇧🇷 BR 113 🇮🇩 ID 103 🇩🇪 DE 88 🇮🇳 IN 86 🇬🇧 UK 74 🇯🇵 JP 68 🇨🇦 CA 65 bit.ly/3DbRrJr THREAD
    Image
    00:00
  • user avatar
    Carbon Brief
    @CarbonBrief
    Dec 23, 2019
    UNEP: 1.5C climate target ‘slipping out of reach’ | @hausfath @robbie_andrew j.mp/2pQPnXg
    Image
    00:00
  • user avatar
    Carbon Brief
    @CarbonBrief
    Sep 14, 2020
    NEW | Interactive: What is the climate impact of eating meat and dairy? @daisydunnesci @tomoprater @joegoodman94 This is the first article in Carbon Brief’s week-long series on food and climate change… j.mp/2Fx9vFu THREAD 1/7
    Image
    00:00
  • user avatar
    Carbon Brief
    @CarbonBrief
    Apr 24, 2021
    Recommended read: 'Big words, and little action': Greta Thunberg’s must-read letter to the world | @GretaThunberg @BritishVogue j.mp/3gtqgSm
  • user avatar
    Carbon Brief
    @CarbonBrief
    Nov 12, 2022
    Interactive: What is the climate impact of eating meat and dairy? | @daisydunnesci @tomoprater @joejgoodman #COP27 #archive Read here: bit.ly/3g1HBiS
    Image
    00:00
  • user avatar
    Carbon Brief
    @CarbonBrief
    Jan 6, 2022
    Analysis: Which countries are historically responsible for climate change? | @DrSimEvans @tomoprater #archive Read: j.mp/3mQPtHS
    Image
    00:00
  • user avatar
    Carbon Brief
    @CarbonBrief
    May 14, 2025
    NEW – Analysis: Clean energy just put China’s CO2 emissions into reverse for first time | @laurimyllyvirta Read here: buff.ly/6eAcjRU
    Line chart – China's CO2 emissions are now 1% below their March 2024 peak: China’s emissions from fossil fuels and cement, million tonnes of CO2, rolling 12-month totals. Source: Emissions are estimated from National Bureau of Statistics data on production of different fuels and cement, China Customs data on imports and exports and WIND Information data on changes in inventories, applying emissions factors from China’s latest national greenhouse gas emissions inventory and annual emissions factors per tonne of cement production until 2024. Sector breakdown of coal consumption is estimated using coal consumption data from WIND Information and electricity data from the National Energy Administration.
    717K
  • user avatar
    Carbon Brief
    @CarbonBrief
    May 10, 2020
    ++BREAKING++ Great Britain has been running for more than a month – and counting – without burning coal to generate electricity. With demand down nearly 20% due to #coronavirus, supply has been met by: 36% renewables 32% gas 22% nuclear 9% imports carbonbrief.org/analysis-great…
    Image
    00:00
  • user avatar
    Carbon Brief
    @CarbonBrief
    Jun 23, 2020
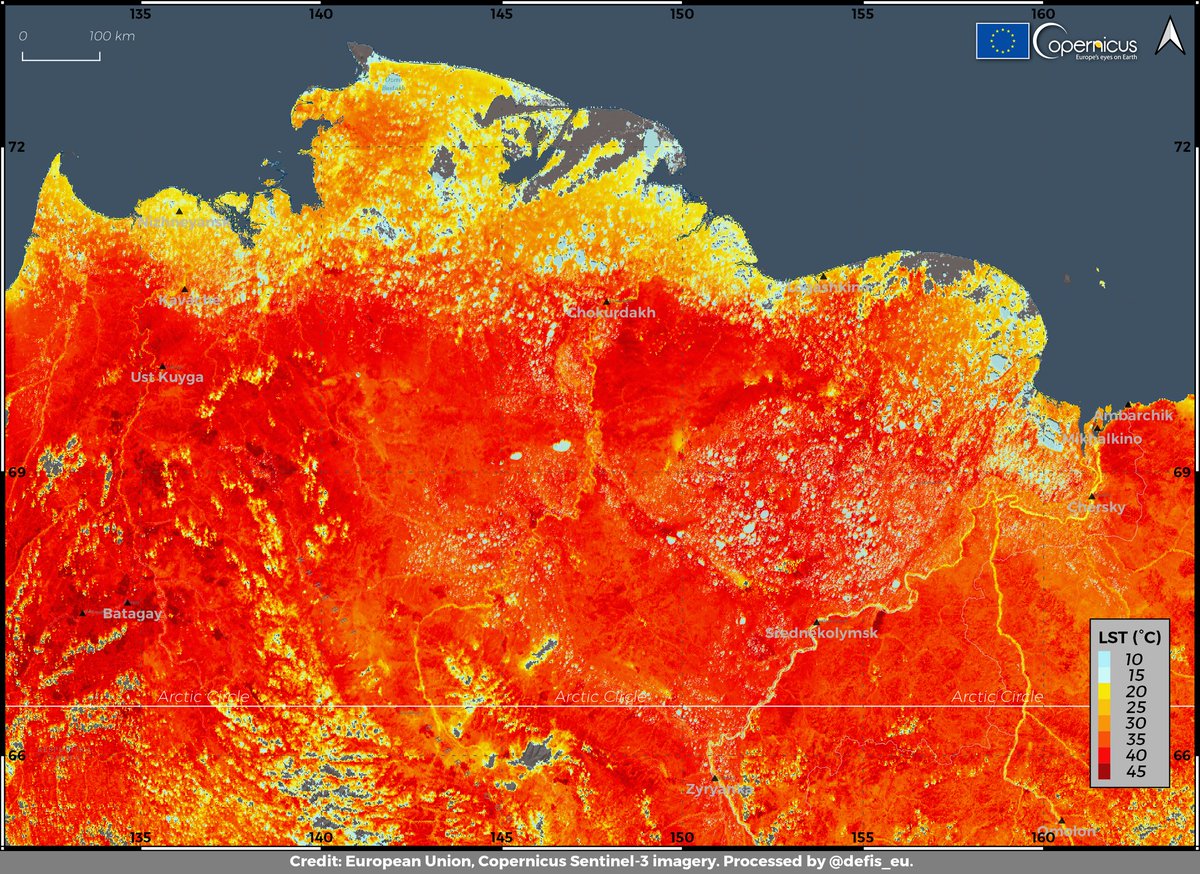
    Several #Arctic locations recorded land surface temperatures hitting 45C on 19 June, according to initial data from the @esa satellite Sentinel-3. Here is what you need to know... (THREAD 1/7)
    user avatar
    EU Defence and Space
    @defis_eu
    Jun 23, 2020
    #ImageOfTheDay #ArcticHeatWave #ClimateAction #EUSpace Many air 🌡️ records have recently been broken in #Siberia On 19 June Land Surface Temperature (LST) reached 45°C at several locations in the #Arctic Circle Data retrieved by #Sentinel3 🇪🇺🛰️ Check the 2019-2020 comparison ⬇️
    Image
  • user avatar
    Carbon Brief
    @CarbonBrief
    Jul 7, 2020
    ++BREAKING++ New data from @CopernicusECMWF shows that July 2019-June 2020 was tied as the warmest 12 months on record...
    Image
    00:00

New to X?

Sign up now to get your own personalized timeline!

Create account

By signing up, you agree to the Terms of Service and Privacy Policy, including Cookie Use.

Terms·Privacy·Cookies·Accessibility·Ads Info·© 2026 X Corp.
Don't miss what's happening
People on X are the first to know.
Log inSign up
Advertisement
Advertisement