Log inSign up
Data Visualization Society
4,337 posts
Image
user avatar
Data Visualization Society
@DataVizSociety
We are dedicated to fostering community for data visualization professionals. Follow us on Bluesky: datavizsociety.bsky.social
datavisualizationsociety.org
Joined January 2019
308
Following
78.4K
Followers
  • Pinned
    user avatar
    Data Visualization Society
    @DataVizSociety
    Apr 13
    🚨 Registration is OPEN for Outlier 2026! Join us June 24–26 for a fully virtual, global conference built around The Final Draft. 🎟 Register today: buff.ly/tVLTrmr #outlier2026 #datavis #dataviz
    Image
    1.3K
  • user avatar
    Data Visualization Society
    @DataVizSociety
    Apr 18, 2019
    Pie charts are evil. Decoration is bad. There are so many rules in #datavisualization & it takes a long time to learn them all. Once you do, @flerlagekr points out that you then need to learn something even more esoteric and difficult: when to break them.
    Image
    It’s Okay to Break the Rules…Sometimes
    From medium.com
  • user avatar
    Data Visualization Society
    @DataVizSociety
    Jul 10, 2019
    The rise of the #datavisualization style guide is a welcome phenomenon but what does it mean? Why have organizations started to make and publish these style guides? And how many are there exactly? @AmyCesal answers all that and more. #dataviz
    family tree of style guides, all which fit into the broader design system
    What Are Data Visualization Style Guidelines?
    From medium.com
  • user avatar
    Data Visualization Society
    @DataVizSociety
    Jun 8, 2021
    We are THRILLED to unveil the new, paywall-free Nightingale site 🥁🥁🥁! Featuring a new mark courtesy of @datacitron 👏👏👏 ... Please visit it at nightingaledvs.com and let us know your thoughts! #DataVisualization #dataviz #communitylove
    Image
    Nightingale: The Journal of the Data Visualization Society
    From nightingaledvs.com
  • user avatar
    Data Visualization Society
    @DataVizSociety
    Feb 20, 2019
    If you're interested in becoming a member of the Data Visualization Society you can join here! datavisualizationsociety.com/join
    Image
  • user avatar
    Data Visualization Society
    @DataVizSociety
    Feb 20, 2019
    Looking for a place to discuss & shape professional development in #datavisualization? Introducing the Data Visualization Society, an initiative by @AmyCesal, @MollzMP & @Elijah_Meeks to foster community for data visualization creators of all backgrounds.
    Image
    Introducing the Data Visualization Society
    From medium.com
  • user avatar
    Data Visualization Society
    @DataVizSociety
    Sep 5, 2019
    If you're early in your career and you feel overwhelmed and you're being asked to make fancy charts that someone saw on Twitter, you're not alone. Take a moment and read this story, it's the best summary of that overwhelmed feeling and how to deal with it.
    Image
    Draw The Rest Of The Chart
    From medium.com
  • user avatar
    Data Visualization Society
    @DataVizSociety
    Jul 18, 2019
    Whenever you see @NadiehBremer's work you always ask yourself, "How did she do that?!" and "Where do the ideas come from?!" Well, we asked her and it turns out the answers are just as good as you might expect!
    Image
    Intricate & Visually Exciting: An Interview with Nadieh Brehmer
    From medium.com
  • user avatar
    Data Visualization Society
    @DataVizSociety
    May 8, 2019
    "Making maps has become the modern equivalent of the shift from typewriter pools to word processing... But cartography isn't innate in our ability to communicate graphically. There's a language, a syntax, and a grammar." @kennethfield's exhaustive intro.
    Image
    So you want to make a map?
    From medium.com
  • user avatar
    Data Visualization Society
    @DataVizSociety
    Mar 4, 2019
    For the last week or so, our members have been discussing historical #datavisualization. Here's a distillation of some of those conversations written by @duswain, including beautiful examples of historical dataviz. medium.com/data-visualiza…
  • user avatar
    Data Visualization Society
    @DataVizSociety
    Nov 4, 2021
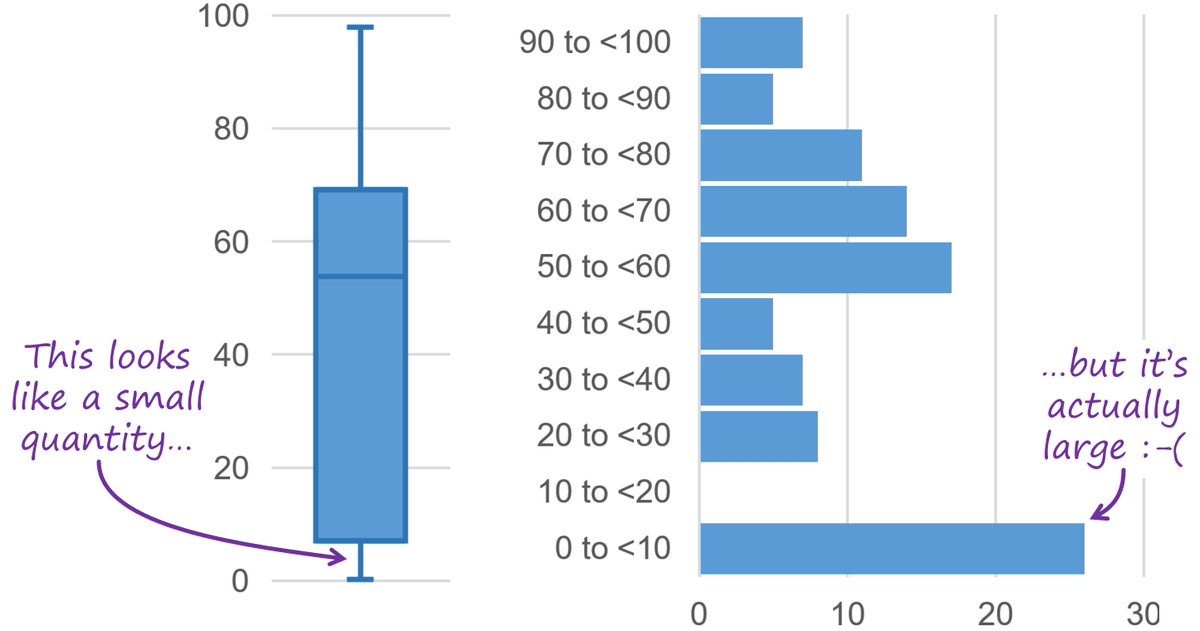
    After having explained how to read box plots to thousands of workshop participants @nickdesb has concluded that this classic chart type is unnecessarily unintuitive, hard to grasp & prone to misinterpretation. Explore some alternatives with him: nightingaledvs.com/ive-stopped-us… #dataviz
    Image
  • user avatar
    Data Visualization Society
    @DataVizSociety
    Jul 15, 2019
    We're excited to announce that we're partnering with Medium to develop our publication focused on #datavisualization for professionals and the general public. #dataviz is more important than ever, and this partnership will help us reach a larger audience.
    Image
    Welcome To Nightingale
    From medium.com
  • user avatar
    Data Visualization Society
    @DataVizSociety
    Apr 3, 2020
    Color is Hard. But it doesn’t have to be! Join us tomorrow at 10AM EST for our first Fireside Chat. The topic is using color theory for data visualization and our panel will be @tmrhyne, @alangwilson and @yuliakrolik hosted by @AmyCesal. excella.zoom.us/webinar/regist…
    Image
    Image
    Image
    Image
  • user avatar
    Data Visualization Society
    @DataVizSociety
    Feb 4, 2022
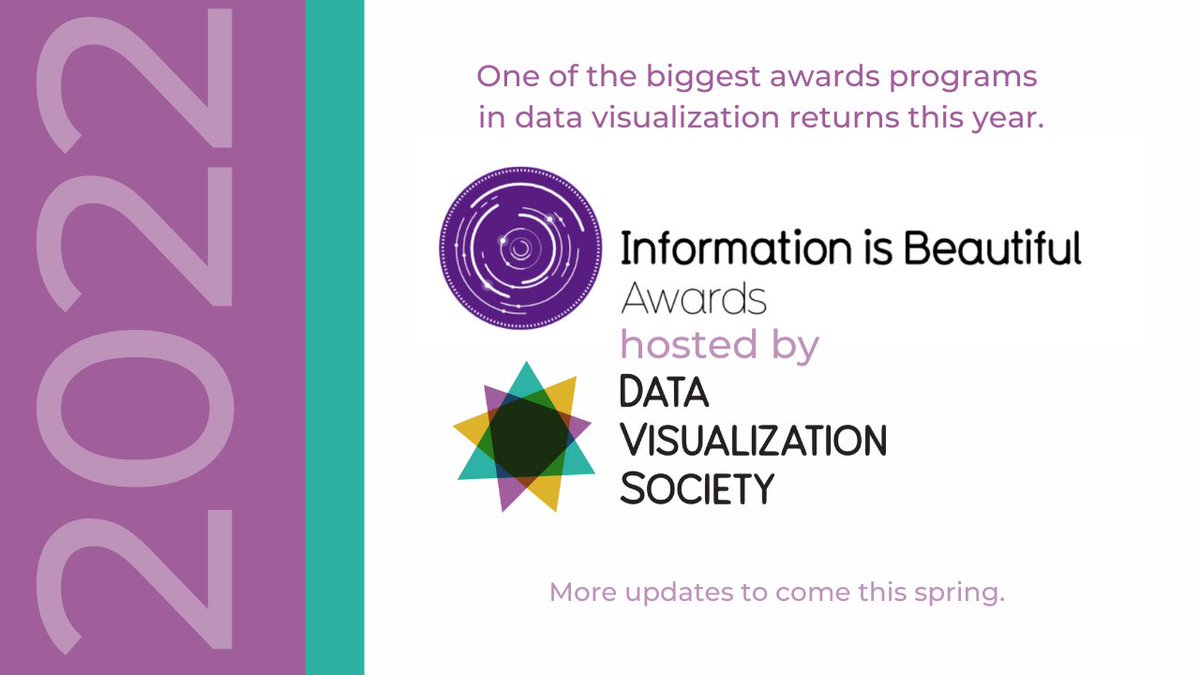
    ✨The Information is Beautiful Awards will return in 2022, hosted by DVS✨ We’re excited to collaborate with @infobeautiful as the new home for one of the biggest awards programs in #dataviz, with 8 years of celebrating excellence in our field. (1/4)
    One of the biggest awards programs in data visualization returns this year. Information is Beautiful Awards hosted by the Data Visualization Society.

New to X?

Sign up now to get your own personalized timeline!

Create account

By signing up, you agree to the Terms of Service and Privacy Policy, including Cookie Use.

Terms·Privacy·Cookies·Accessibility·Ads Info·© 2026 X Corp.
Don't miss what's happening
People on X are the first to know.
Log inSign up
Advertisement
Advertisement