
Being Slow Costs You More Than You Think
A one-second delay can cost you 10% of your visitors.
GTmetrix shows you exactly why your site is slow. Test with a real browser, global test locations, and real scenarios so you’re fixing what’s actually costing you, not guessing.
Get Started for FREE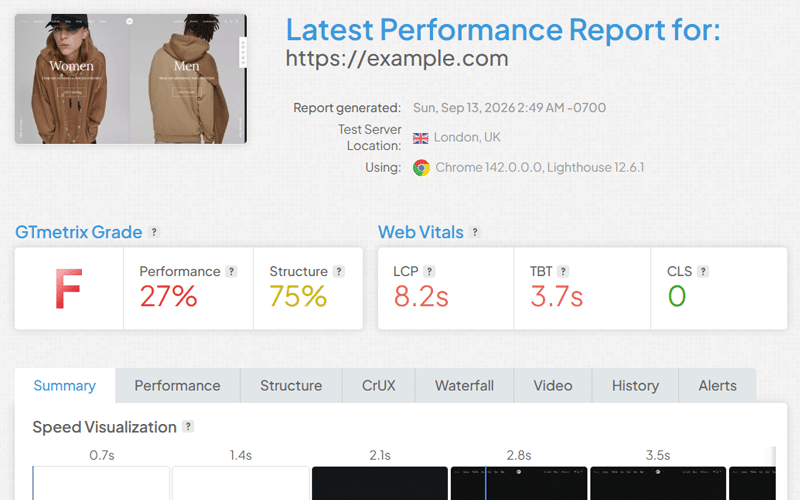
Here’s what slow actually costs
Performance quietly touches more of your metrics than you’d expect. Here’s the data.

Bounce Rate
After optimizing Core Web Vitals, The Economic Times reduced bounce rates by 43% overall.

Traffic
A 0.1 second improvement in mobile site speed increased page views by 7% for lead-generation sites.

Revenue
A 31% improvement in Largest Contentful Paint (LCP) increased Vodafone’s total sales by 8%.

Conversions
Rakuten’s conversion rate grew 33% after Core Web Vitals work.

Page View Duration
Faster pages keep sessions going instead of cutting them short.

…and more
Google’s ranked page speed since 2010. Slow pages also erode trust and brand perception.
How are your website’s Web Vitals?
See how your website performs, why it’s slow, and how to optimize it
Analysis Options:
Seattle, WA, USA
Chrome
Unthrottled Connection
Deep Insights to Understand and Optimize Performance
GTmetrix tells you exactly how fast your page loads, why it’s slow, and how to fix it.
-
Full Performance Reports
-
Locations & Devices
-
Monitoring & Alerts
-
AI / MCP
-
Advanced Options
One report, all the data that matters
GTmetrix loads your page in a real browser and combines lab testing with real user data, all in one report.
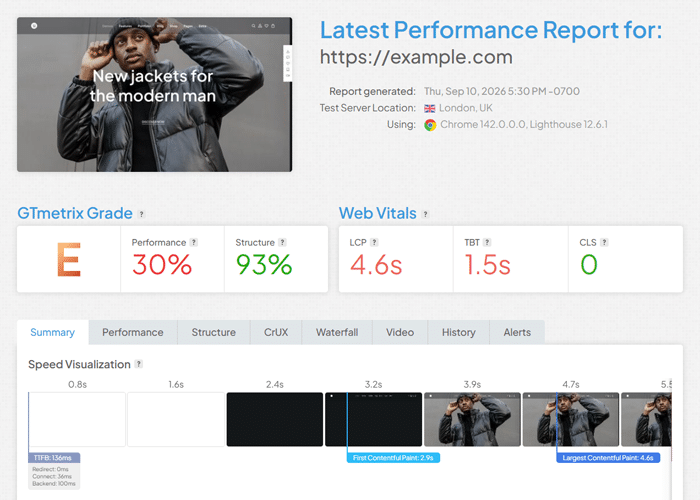
Performance Grade & Web Vitals
What’s slow, scored and explained
GTmetrix measures the Web Vitals that impact SEO and experience, then rolls Performance (powered by Lighthouse) and Structure into your GTmetrix Grade.
- LCP, CLS, and TBT: how fast, stable, and responsive your page is
- GTmetrix Grade built from a Performance Score and a Structure Score
- Every audit ranked by impact so you know what to fix first
Real Browser Testing
Your page loaded on a real browser
GTmetrix loads every test in a real Chrome browser and measures your page as it actually loads, not a simulated approximation.
- Real observed performance in an actual browser
- No headless browser, no emulation
- The same browser your visitors actually use

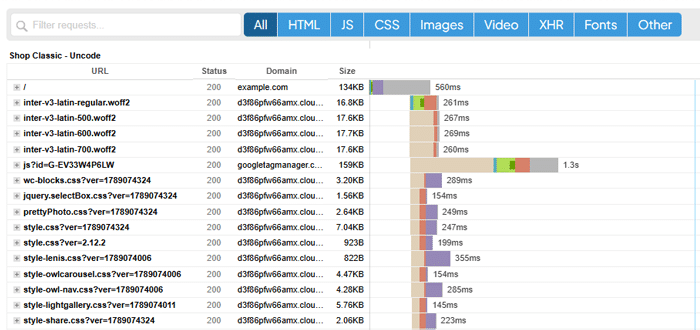
Waterfall Chart
See exactly what’s slow, request by request
GTmetrix breaks down your page load request by request, so you can see exactly where time is being spent.
- Every request, in order, with full timing detail
- Spot long or broken requests, and see status codes and response sizes at a glance
- Inspect full request and response headers for any resource
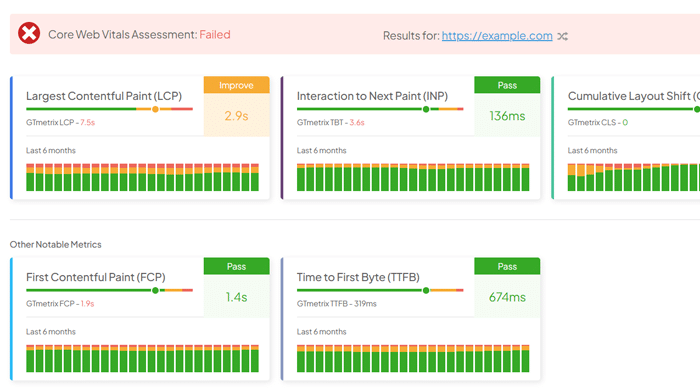
Real User Experience (CrUX)
See what real users experience
GTmetrix pulls in Chrome UX Report data so you can see how your site performs for actual visitors, not just in a lab test.
- Field data from actual Chrome visitors, not just a lab test
- Includes real INP data, the responsiveness metric only field-data can measure
- Trends tracked as far back as 6 months*
*CrUX data only available for websites with sufficient Chrome web traffic. Read more.
Speed Visualization & Video Playback
See your page load, frame by frame
GTmetrix captures a visual timeline of your page load via the Speed Visualization filmstrip and a full video replay of your page load, so you can see exactly what your visitors saw.
- Speed Visualization (filmstrip) view breaks the load down screenshot by screenshot
- Video playback replays the full page load the way a visitor experienced it
- Playback key metric milestones like when TTFB or LCP occurred
Test the exact conditions your visitors face
Choose your location, connection speed, and device, so your results reflect reality.

Global Test Locations
Test from where your visitors actually are
GTmetrix lets you test from over 25 locations worldwide, so you can see how your site performs for visitors wherever they are.
- 25 locations across North America, Europe, Asia-Pacific, and beyond
- Compare performance across regions side by side
- New locations added over time
Mobile Device Testing
Catch mobile-specific slowdowns
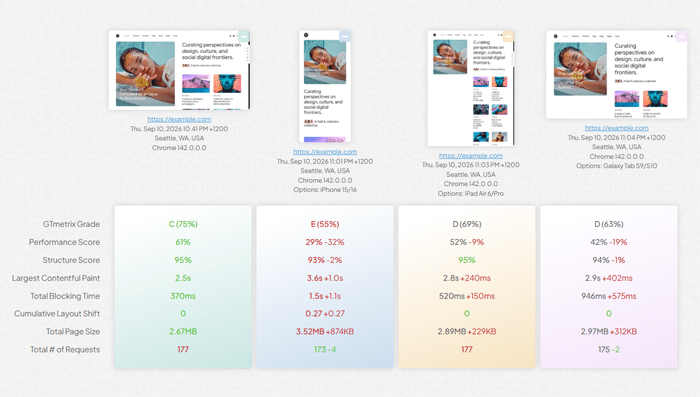
GTmetrix simulates over 55 real devices, so you can catch performance issues specific to phones and tablets.
- 55+ simulated devices, from iPhones to Android tablets
- Matches real screen size, user agent, and pixel ratio, not just a resized window
- Catch mobile-only issues before your visitors do
Custom Connection Speeds
Match real-world network conditions
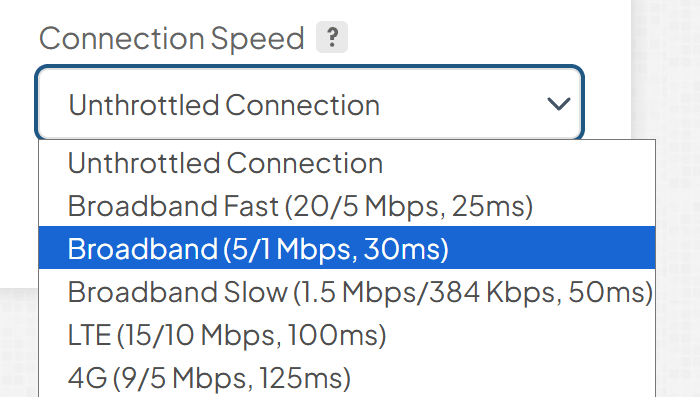
GTmetrix lets you simulate a range of connection speeds, from unthrottled to 3G, to match your actual audience.
- See exactly how a slow connection impacts your load time
- Pair with Mobile Device Testing to simulate real-world mobile conditions
- Set a fully custom speed if the presets don’t match your audience
Know the moment performance changes
Turn one-time reports into proactive monitoring, across every page you track.
Monitoring Frequency
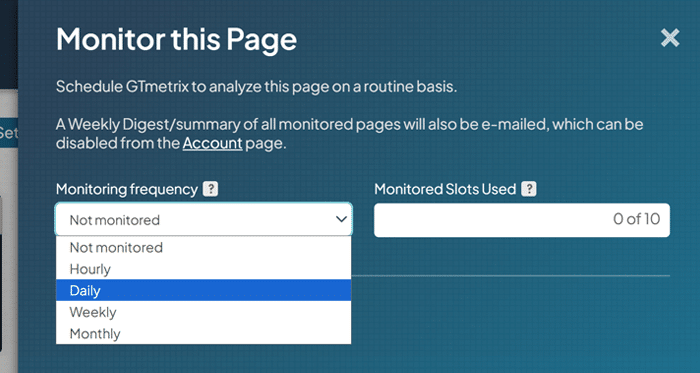
Run automatic tests hourly, daily, weekly, or monthly
GTmetrix tests your monitored pages automatically on a schedule, so regressions get caught without you checking manually.
- Give your most important pages the closest watch with hourly monitoring
- Dial back to daily, weekly, or monthly for pages that need less attention
- Change frequencies anytime as priorities shift
Historical Graphs
Visualize progress over time
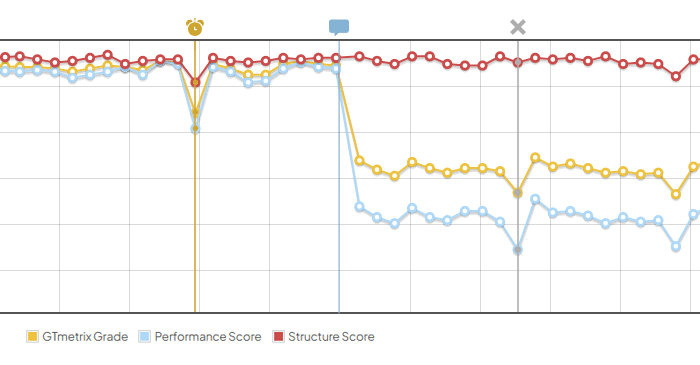
GTmetrix graphs every monitored test, so you can spot performance dips, observe trends, and confirm whether a fix actually worked.
- See trends on Web Vitals, GTmetrix Grade, Performance, and Structure Scores
- View historical data from 1 to 12 months back, depending on your plan
- Add notes to mark what changed, and when
Custom Alerts
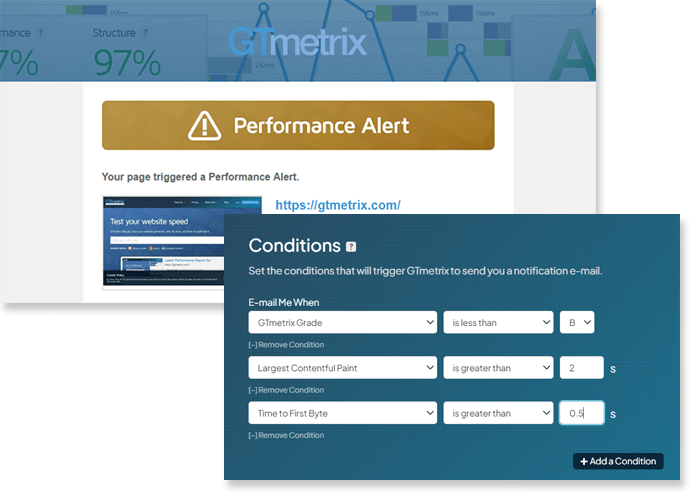
Stay informed when performance drops
GTmetrix emails you the moment a monitored page’s performance drops, based on conditions you set.
- Set your own conditions and thresholds for what counts as a regression
- Enable video to capture exactly what happened when an alert triggers
- Review every alert in one log, with automatic suppression so repeat issues don’t flood your inbox
Export & Share Reports
Bring your monitoring data into your own tools
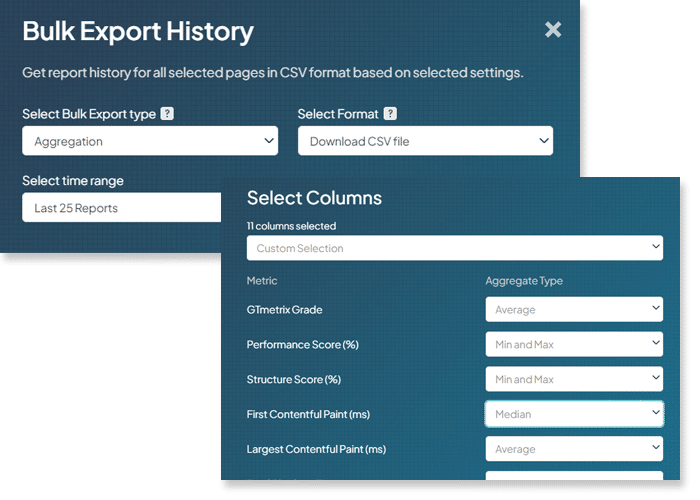
GTmetrix lets you export or link your monitoring history to CSV, so you can bring it into your own dashboards or reports.
- Single-page or bulk export across your whole portfolio
- Built for dashboards, BI tools, and client reporting
- Link to a live CSV that updates automatically, not just a one-time download
Weekly Digest
Stay in the loop straight from your inbox
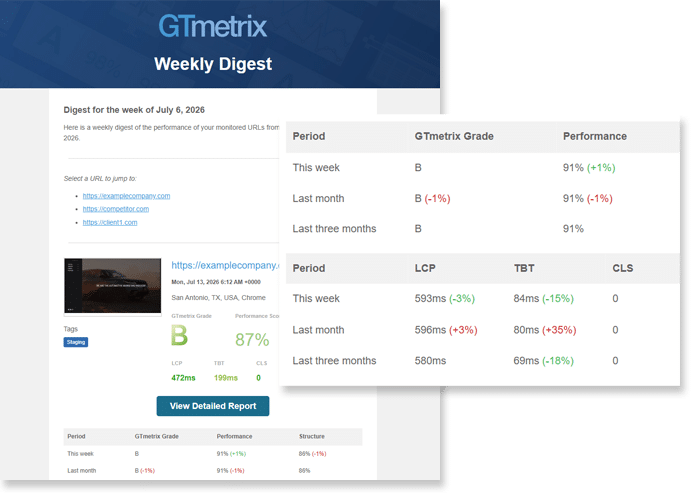
GTmetrix can email you a Weekly Digest summarizing performance trends across all your monitored pages.
- Every monitored page listed in one email
- Week, month, and 3-month trend comparisons for Grade, Performance, Structure, and Web Vitals
- Keeps stakeholders in the loop without needing dashboard access
Bring performance data into your AI coding tools
The GTmetrix MCP brings performance testing and metrics, right where you already code.
Test, Diagnose, and Fix, in One Chat
Fast to Build Isn’t the Same as Fast to Load
GTmetrix tests for everything AI left behind, so you can fix it before your visitors feel it.
- AI tools are good at shipping features quickly – but they’re not necessarily optimized for performance.
- Continuous iteration often brings more pages, widgets, and polish, increasing bloat and worsening performance.
- Connecting GTmetrix MCP to your AI tool brings real-world assessment from real page loads, in real locations around the globe.
From a plain-language prompt to real results
Ask your AI assistant to run a test, explain what’s slow, or confirm a fix, and it pulls real GTmetrix data to answer.
- Ask in plain language, like “Why is my LCP slow on the pricing page?”
- Pulls the same real GTmetrix data your team sees in a full report
- Close the loop in CI/CD: fix, rerun, and confirm automatically
Diagram showing GTmetrix MCP connecting to Claude, Codex, Cursor, and Lovable one at a time in turn, with a request pulse traveling to GTmetrix MCP and a result pulse traveling back to the tool, forming a feedback loop.
Connects to the AI Tools You Already Use
Claude, Cursor, GitHub Copilot, Lovable, and more
GTmetrix MCP works with the AI coding assistant you already have open, so there’s nothing new to install or learn.
- Works with Claude, Cursor, GitHub Copilot CLI, ChatGPT, Lovable, and more
- Connects to any MCP compatible client
- Connect in a few clicks with OAuth, or try it as a guest with no account
Test the exact conditions your setup requires
Cookies, network overrides, ad and URL filtering, and saved presets, all configurable before you run a test.
Ad Blocking
See how much ads are really costing you
GTmetrix can block ads during a test, so you can isolate exactly how much they’re slowing your page down.
- Block popular ad networks and trackers from your tests
- Compare performance with and without ads running

Define Screen Resolutions & Device Pixel Ratio
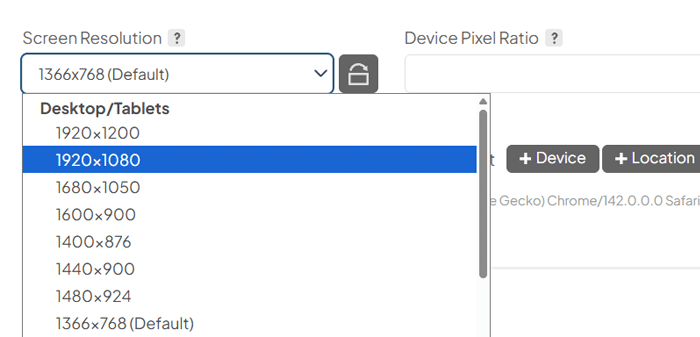
Set your own screen size and pixel ratio
GTmetrix lets you set a specific screen resolution and device pixel ratio, independent of any device preset.
- Match the exact resolution your analytics report as most common, not a generic preset
- Simulate a user’s page load experience by matching their exact screen setup
URL Filtering
Choose exactly which requests are allowed to load
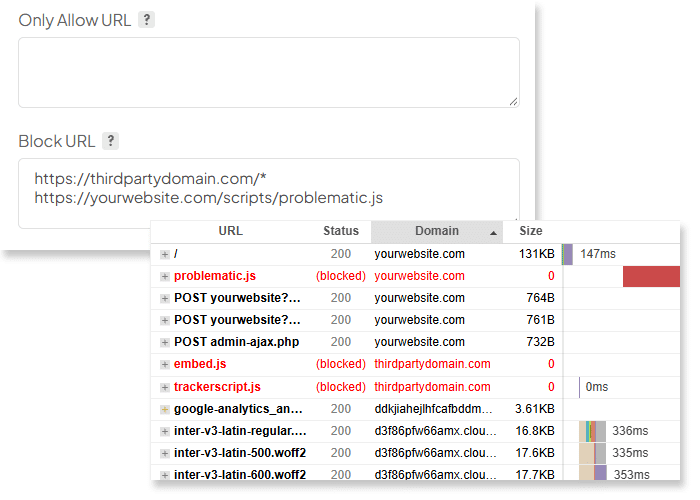
GTmetrix lets you explicitly allow or block specific URLs during a test, so you can isolate exactly what’s affecting performance.
- Block a problematic request or a specific third-party script to see its impact on your load time
- Allow-list only the resources you actually want to test
- Wildcard support for entire domains
Test with Cookie Data
Pass through your own cookie data per test
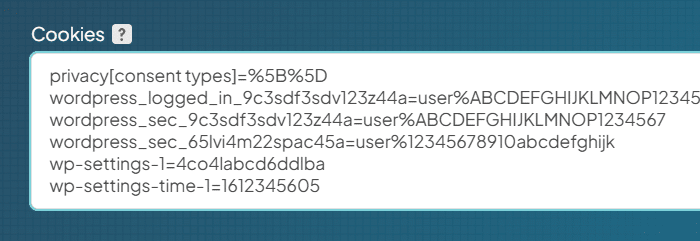
GTmetrix lets you pass cookie data into a test, so the page loads exactly as it would with that data already present.
- Test for any cookie-dependent behaviour
- Clear consent or cookie-notice banners before the page loads
- Simulate logged-in states with cookie session
Analysis Presets
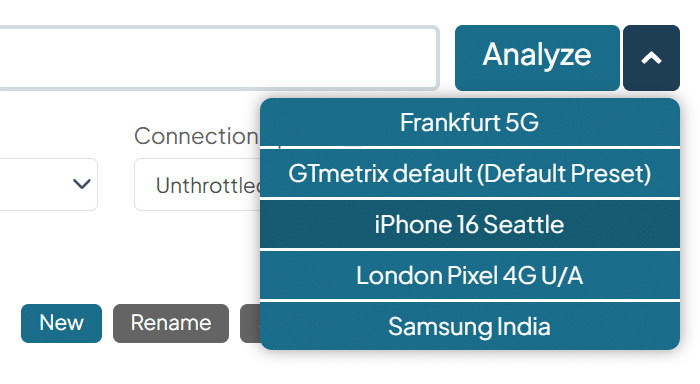
Save your Analysis Options as a one-click preset
GTmetrix lets you save a full set of Analysis Options, location, device, connection speed, and more, as a preset, to streamline common testing scenarios
- Save your specific Analysis Options as a single preset
- Apply a preset in one click on any future test
…and more
DNS Override
Point your test at a dev or staging server before it goes live
Share test results via public or private URLs, PDFs, or exports—no login required.
GTmetrix lets you override DNS, so you can test a staging environment using your real domain.
- Compare a new host or CDN against your current one before switching
- Confirm a migration performs well before you update your live DNS records
Bypass HTTP Authentication
Test pages protected by an HTTP username and password
GTmetrix lets you bypass HTTP Authentication, so you can test pages that would otherwise stop at a login prompt.
- Test a staging or pre-launch site that’s locked behind Basic Auth
User Agent Override
Simulate a specific browser or crawler
GTmetrix lets you customize your User Agent, so you can see how your page responds to a specific browser, bot, or crawler.
- Debug user-agent-based logic, like a mobile redirect or a bot block
- Check page loads for an older browser or specific device ID
- Add a custom identifier to track or segment your own test traffic
Frequently Asked Questions
GTmetrix uses the same Lighthouse engine under the hood, but goes much further – testing from real browsers in real locations around the world, tracking performance trends over time, and giving you deeper insights into what exactly is slowing your site down.
Not at all! GTmetrix reports are built to be readable at a glance – a simple letter grade, clear priorities, and plain-language recommendations.
If you want to go deeper, the waterfall chart and detailed metrics are there for developers too, but you don’t need technical experience to get value from a report.
Yes! You can test your page in 25 global test locations, simulate 55+ devices and variants, throttle various different connection speeds, and modify other parameters so you can see how real visitors in different regions actually experience your site, not just how it performs from one default setup.
Learn the basics of GTmetrix Analysis or View our Test Server Locations
Both are supported. You can run one-off tests any time or set up scheduled monitoring so GTmetrix automatically re-tests your site and alerts you if performance drops – helpful for catching unexpected issues, or regressions after a deployment or a plugin update.
We offer a free Trial so you can try out GTmetrix with no commitment or a credit card.
PRO plans unlock more frequent testing, more test locations, monitoring, and historical tracking, and much more.
Yes. GTmetrix offers an API as well as an MCP server so performance testing can be built into your deployment pipeline, alerting tools, reporting dashboards, or your AI environment, rather than being a manual workflow.
Learn more about the GTmetrix API or GTmetrix MCP.
