Summary: in this tutorial, you’ll learn how to display a graph from the Matplotlib library on a Tkinter application.
Display a bar chart from matplotlib in Tkinter applications #
Matplotlib is a third-party library for creating professional visualizations in Python. Since Matplotlib is a third-party library, you need to install it before use.
To install the matplotlib package, you can use the following pip command:
pip install matplotlibThe following program uses the matplotlib to create a bar chart that shows the top five programming languages by popularity.
import tkinter as tk
import matplotlib
matplotlib.use('TkAgg')
from matplotlib.figure import Figure
from matplotlib.backends.backend_tkagg import (
FigureCanvasTkAgg,
NavigationToolbar2Tk
)
class App(tk.Tk):
def __init__(self):
super().__init__()
self.title('Tkinter Matplotlib Demo')
# prepare data
data = {
'Python': 11.27,
'C': 11.16,
'Java': 10.46,
'C++': 7.5,
'C#': 5.26
}
languages = data.keys()
popularity = data.values()
# create a figure
figure = Figure(figsize=(6, 4), dpi=100)
# create FigureCanvasTkAgg object
figure_canvas = FigureCanvasTkAgg(figure, self)
# create the toolbar
NavigationToolbar2Tk(figure_canvas, self)
# create axes
axes = figure.add_subplot()
# create the barchart
axes.bar(languages, popularity)
axes.set_title('Top 5 Programming Languages')
axes.set_ylabel('Popularity')
figure_canvas.get_tk_widget().pack(side=tk.TOP, fill=tk.BOTH, expand=1)
if __name__ == '__main__':
app = App()
app.mainloop()Output:
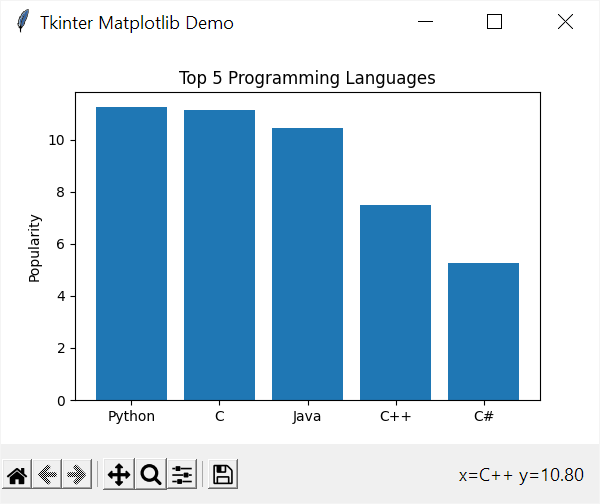
How it works.
First, import the matplotlib module
import matplotliband call the use() function to tell which backend the matplotlib will use:
matplotlib.use('TkAgg')In this case, we use TkAgg backend, which is made to integrate into Tkinter.
Second, import the following Figure, FigureCanvasTkAgg, and NavigationToolbar2Tk classes:
from matplotlib.figure import Figure
from matplotlib.backends.backend_tkagg import (
FigureCanvasTkAgg,
NavigationToolbar2Tk
)The Figure class represents the drawing area on which matplotlib charts will be drawn.
The FigureCanvasTkAgg class is an interface between the Figure and Tkinter Canvas.
The NavigationToolbar2Tk is a built-in toolbar for the figure on the graph.
Third, prepare the data for showing on the bar chart:
data = {
'Python': 11.27,
'C': 11.16,
'Java': 10.46,
'C++': 7.5,
'C#': 5.26
}
languages = data.keys()
popularity = data.values()The data is a dictionary with the keys are the programming languages and values are their popularity in percentage.
Fourth, create a Figure to hold the chart:
figure = Figure(figsize=(6, 4), dpi=100)The Figure object takes two arguments: size in inches and dots per inch (dpi). In this example, it creates a 600×400 pixel figure.
Fifth, create a FigureCanvasTkAgg object that connects the Figure object with a Tkinter’s Canvas object:
figure_canvas = FigureCanvasTkAgg(figure, self)Note that the FigureCanvasTkAgg object is not a Canvas object but contains a Canvas object.
Sixth, create a matplotlib‘s built-in toolbar:
NavigationToolbar2Tk(figure_canvas, self)Seventh, add a subplot to the figure and return the axes of the subplot:
axes = figure.add_subplot()Eighth, create a bar chart by calling the bar() method of the axes and passing the languages and popularity into it. Also, set the title and the label of the y-axis:
axes.bar(languages, popularity)
axes.set_title('Top 5 Programming Languages')
axes.set_ylabel('Popularity')Finally, place the chart on the Tkinter’s root window:
figure_canvas.get_tk_widget().pack(side=tk.TOP, fill=tk.BOTH, expand=1)Summary #
- Use
matplotliblibrary to create professional-quality visualization in the Tkinter application.
Thank you for your feedback!
