Making-of: draggable objects #
I noticed last year that some of my projects behave inconsistently on touch devices. I didn't do anything about it. But then I was working on a tutorial about how I make my interactive tutorials, I had to show how to handle touch events, and I was embarrassed by my code. I decided to take a week to learn about mouse, touch, and pointer events.
That week turned into two. And three. And eight.
I learned a lot. Not only about the event handling spec, but also differences in browser behavior and operating system behavior.

I was able to greatly simplify my code by using newer APIs and by removing unnecessary code.
Labels: making-of
Making-of: circle drawing page #
People sometimes ask me how I write my interactive tutorials. I started out using d3.js, and five years ago I wrote an interactive tutorial about how I made interactive pages with d3.js. I recreated a diagram from my line drawing tutorial, which was implemented in d3.js. I now use Vue.js v2, so I wrote a new tutorial about how I make interactive pages with Vue. I recreated several diagrams from my circle drawing tutorial.
Introduction to hexagons, part 3 #
In part one, I described how I was making a new diagram for my hexagon grid guide, but that I didn't know how to evaluate the design choices I had to make. In part two, I described how I looked at the introductory section of the page to decide the purpose of the new diagram and how it fit in with the others.
Introduction to hexagons, part 2 #
In part one, I described how I created lots of variants of a diagram to try to figure out which one to use on my hexagon guide.
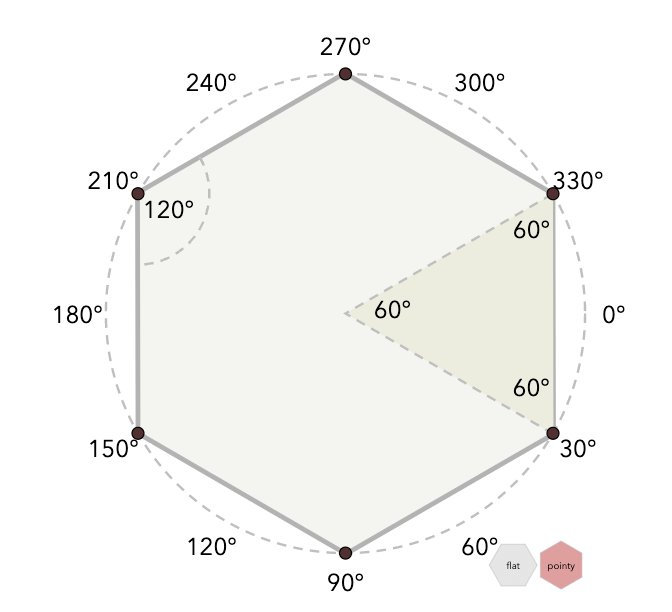
Introduction to hexagons, part 1 #
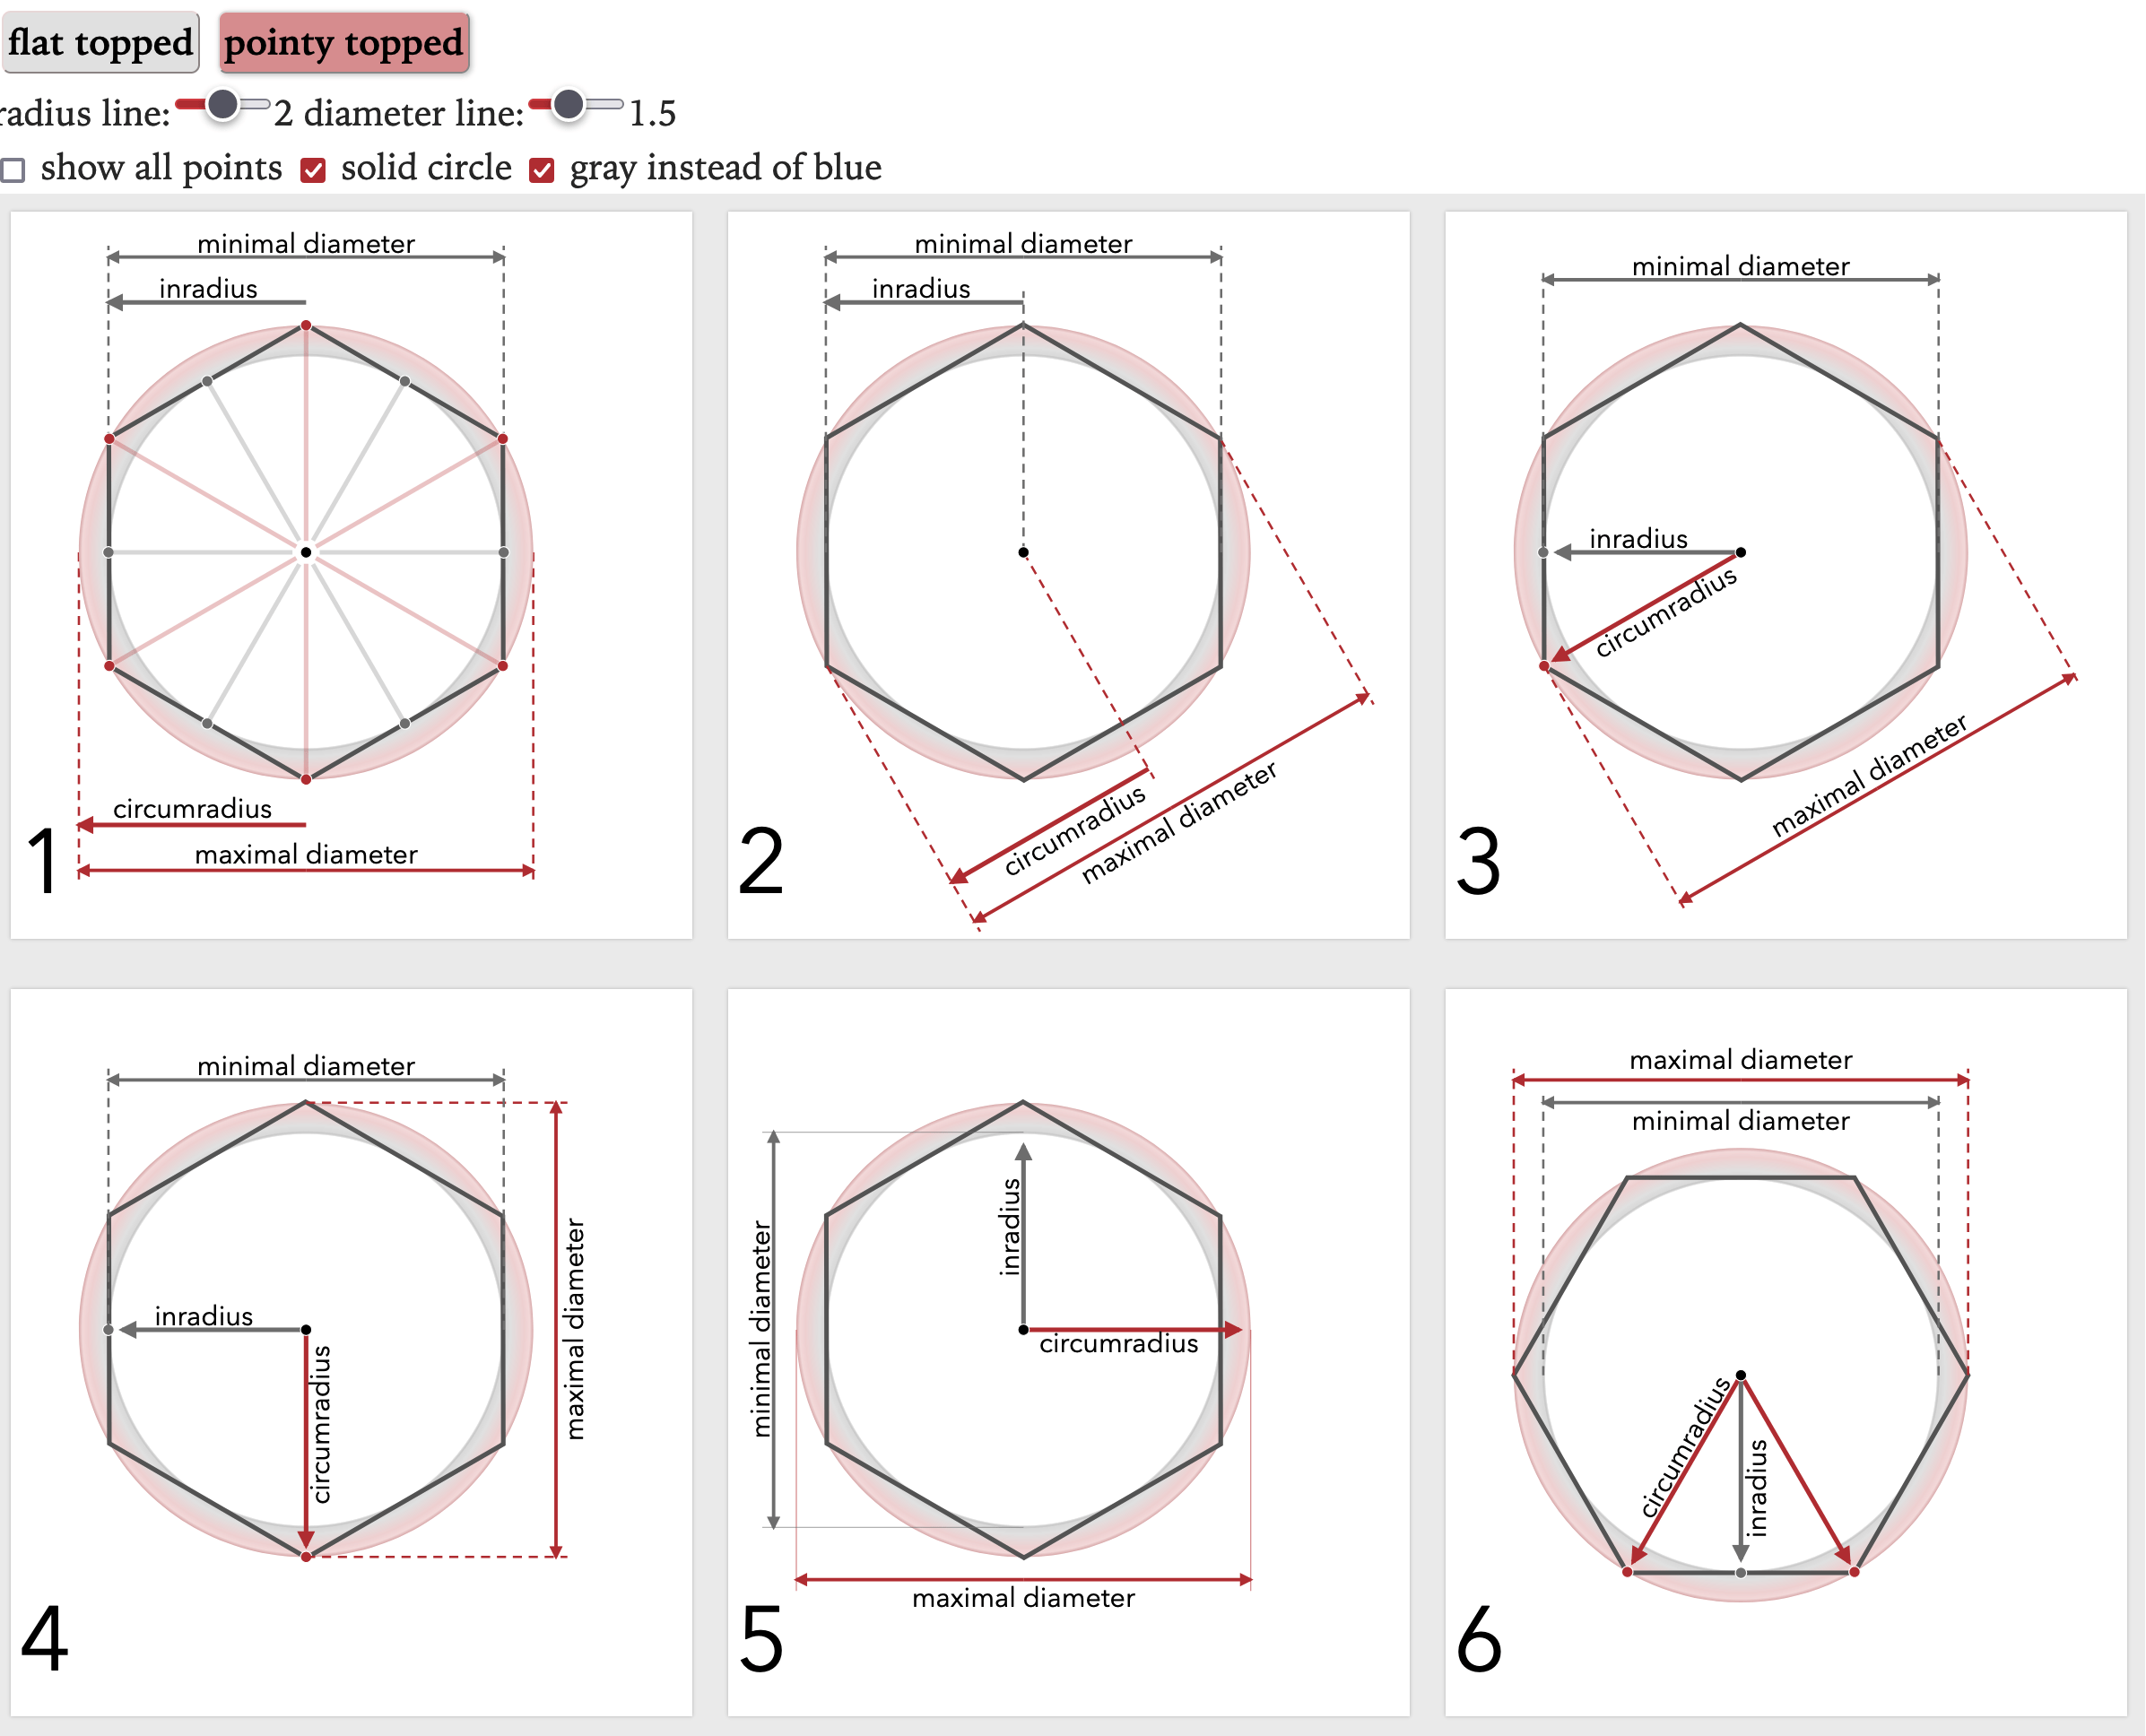
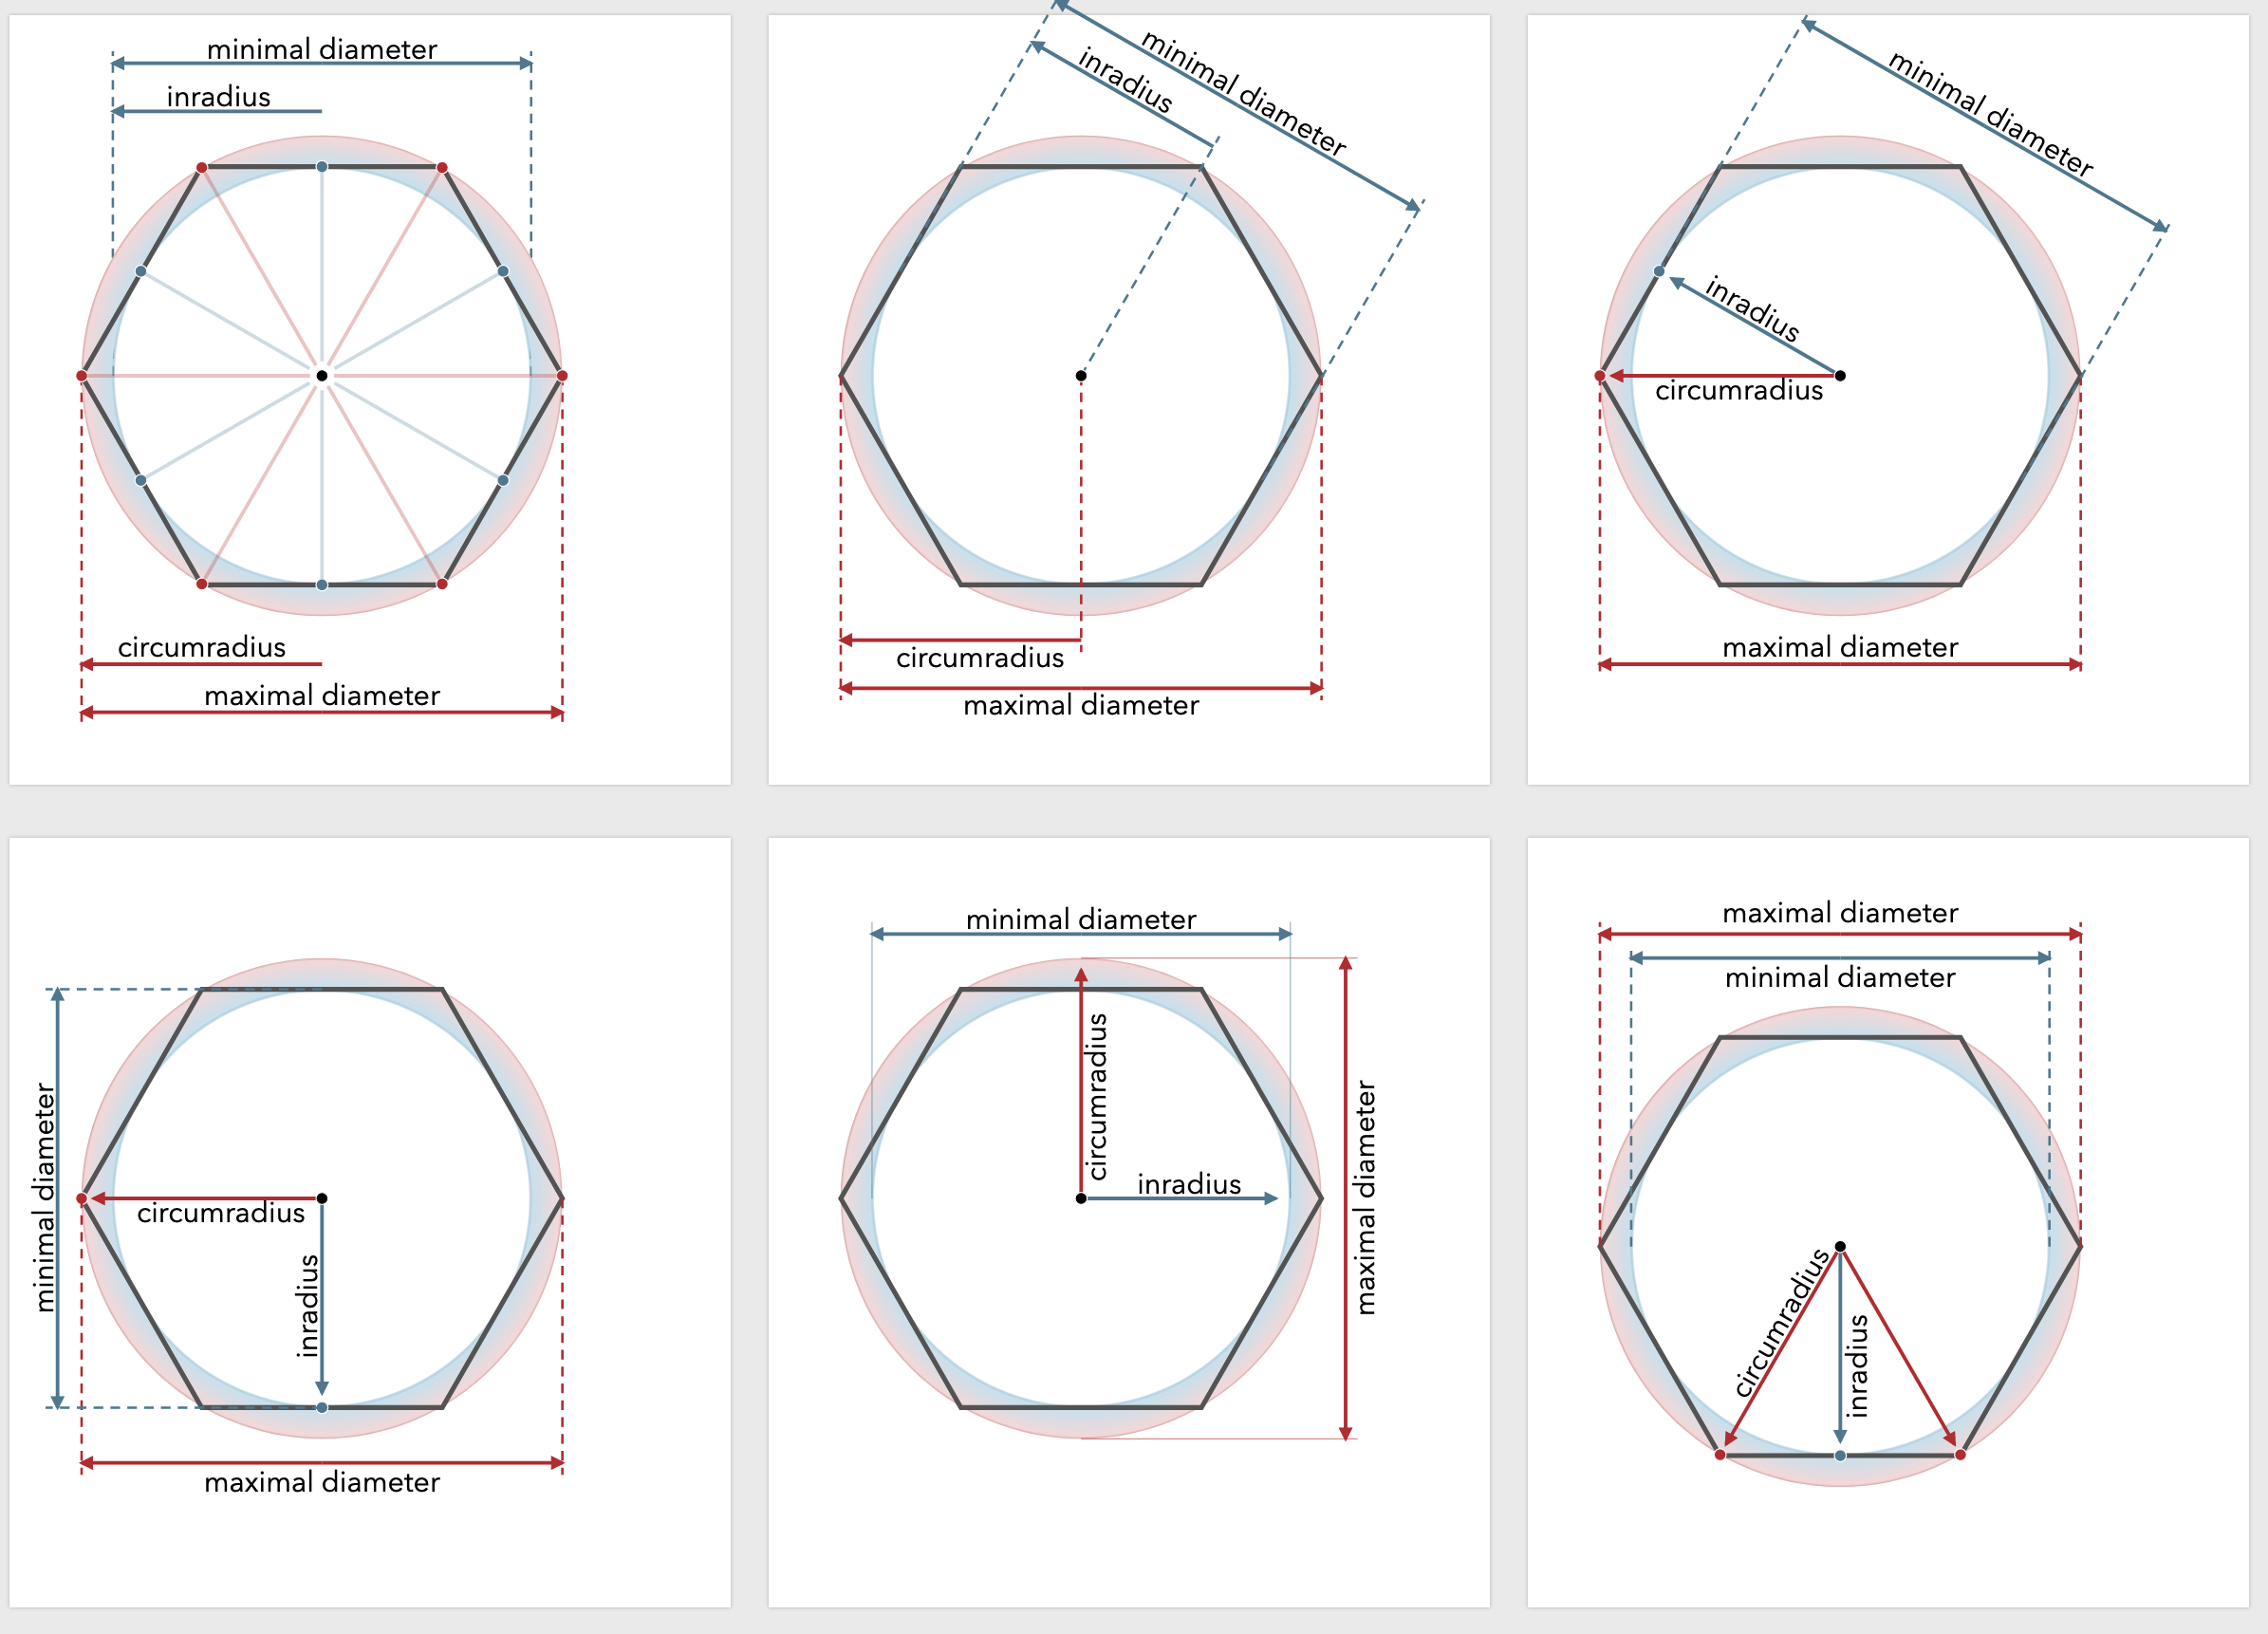
When I started making interactive diagrams the hard part was making them interactive part. But over the years I've gotten much better at that. Now the problem is designing the diagrams. A few weeks ago I was looking at the beginning of my hexagons guide to see what I could improve. I noticed this paragraph had no corresponding diagram:
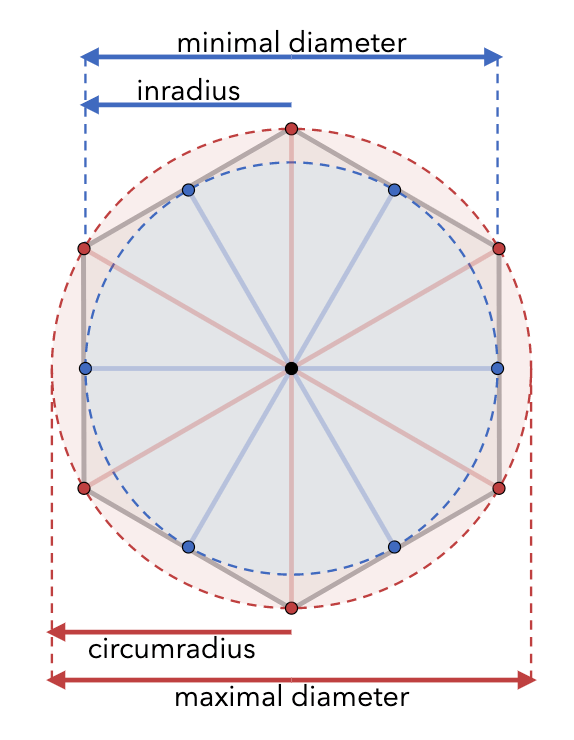
In math, the "circumradius" is the distance from the center to a corner (I call this size); the "inradius" is the distance from the center to the middle of an edge, sqrt(3/4)*size. The "maximal diameter" is twice the circumradius; the "minimal diameter" is twice the inradius. Wikipedia has more.
My first thought was to add a diagram for this. I already have a diagram about angles, so I could add a diagram showing the inradius and circumradius:
Little details #
Back in 2019 I started a page with a list of all the little things I do on my pages. One of the things I have a problem with is that I don't finish something, and then I don't share it, and then nobody benefits. I'm wanting to share more partial projects. So I shared that page, even though it wasn't finished.
Since then I've added sections about
- coloring controls to match the diagrams
- state machines
- linkable sections
- arrows in svg, canvas, and outside the container
- two column layout
- backwards compatibility
- removing build steps
- adding build steps
- markup languages
- topic-based vs time-based projects
- pre-rendering
- meta tags for social media
- support for printing
https://www.redblobgames.com/making-of/little-things/
The page is uneven, with some sections being detailed and others being simple links to other pages I've written, but I am hoping it's useful for people writing explanations on the web. More importantly, I'm building it as a reference for myself. I'm adding code snippets there too, so that the next time I need a draggable svg, I can go to that page and grab the code, and also read about the gotchas that I might've forgotten to check.
Labels: making-of
Offline access with File / Save As #
One of my low priority goals for my site is to make my pages work offline. I had looked into "web manifests" but they seem more suited for web apps and not for documents like mine. So I looked at what it would take to make File→Save As work, preserving interactivity. It turns out it does not work in general on my site. Why?
I tried to make the original HTML + JavaScript should work offline in the sense that they only access resources on the current server and not from any CDN, Google Fonts, etc. So if you save the HTML + JavaScript it should work on a local web server. However, File→Save As doesn't work this way!

Labels: making-of
Pathfinding diagram improvements, part 2 #
In the last post I described improving the diagrams on my Tower Defense page. Once I finished that, I moved on to my other pathfinding pages, starting with the A* page.
Labels: design , making-of , pathfinding
Pathfinding diagram improvements, part 1 #
Back in April I wrote about some pathfinding diagrams I was unhappy with. Last month I wrote about reimplementing the diagramming code.
I started with the Tower Defense page. It's smaller than the A* page and I wanted to try out some ideas there before adopting them on the more popular page.
Labels: design , making-of , pathfinding
Reimplementing my pathfinding pages #
Back in 2018 I wrote about rewriting my hexagonal grid page. I had said “I'm generally not a fan of rewrites that have no end-user benefits”. I had started that rewrite because the code was making it hard to make diagram improvements that I wanted to make. As a side effect of the rewrite, I also made some performance improvements.
I've been wanting to make some diagram improvements to my A* page. While looking through the code I realized I was in the same situation as with the hex page. It was hard to make the changes I wanted to make because of the abstractions I had chosen. I decided to rewrite the most problematic abstraction, the Diagram class.
As a side effect of rewriting the Diagram class, I've improved page speed:
Labels: canvas , making-of , pathfinding
Graph search diagrams and reusable code #
Every once in a while I revisit my pages to see how I could improve them. This is one of the reasons I prefer text to video: I can keep improving it instead of treating it as "published" and then never changing it. I have been updating some of my pages for over twenty years. I started thinking about the Introduction to A* page again when I read a page about online interactive learning and a page about the expertise reversal effect. I made a list of some things I could improve in my diagrams, but also why I had done them the way I did.
Little details #
On each of my pages you'll notice the main element: interactive diagrams that visually explain a concept. But there are lots of other techniques I use too. Unfortunately, I don't remember all of these when I'm writing a new page. I decided to make a catalog of things I've used so that I can remember to use them on the new pages I write.
I've been working on this for a few months and it's still incomplete but I decided I should share it: https://www.redblobgames.com/making-of/little-things/
Are there other little details on my pages that I've forgotten about? Probably! I will update the document as I think of them.
Labels: making-of
Hex grid guide load time, part 2 #
Last year I reimplemented my hexagon grid guide with the goals of making it easier for me to add content and also making it possible to load faster. I was able to speed up load time significantly by pre-rendering the SVG on the server. This is called "SSR with Rehydration" on Google's rendering tech page.
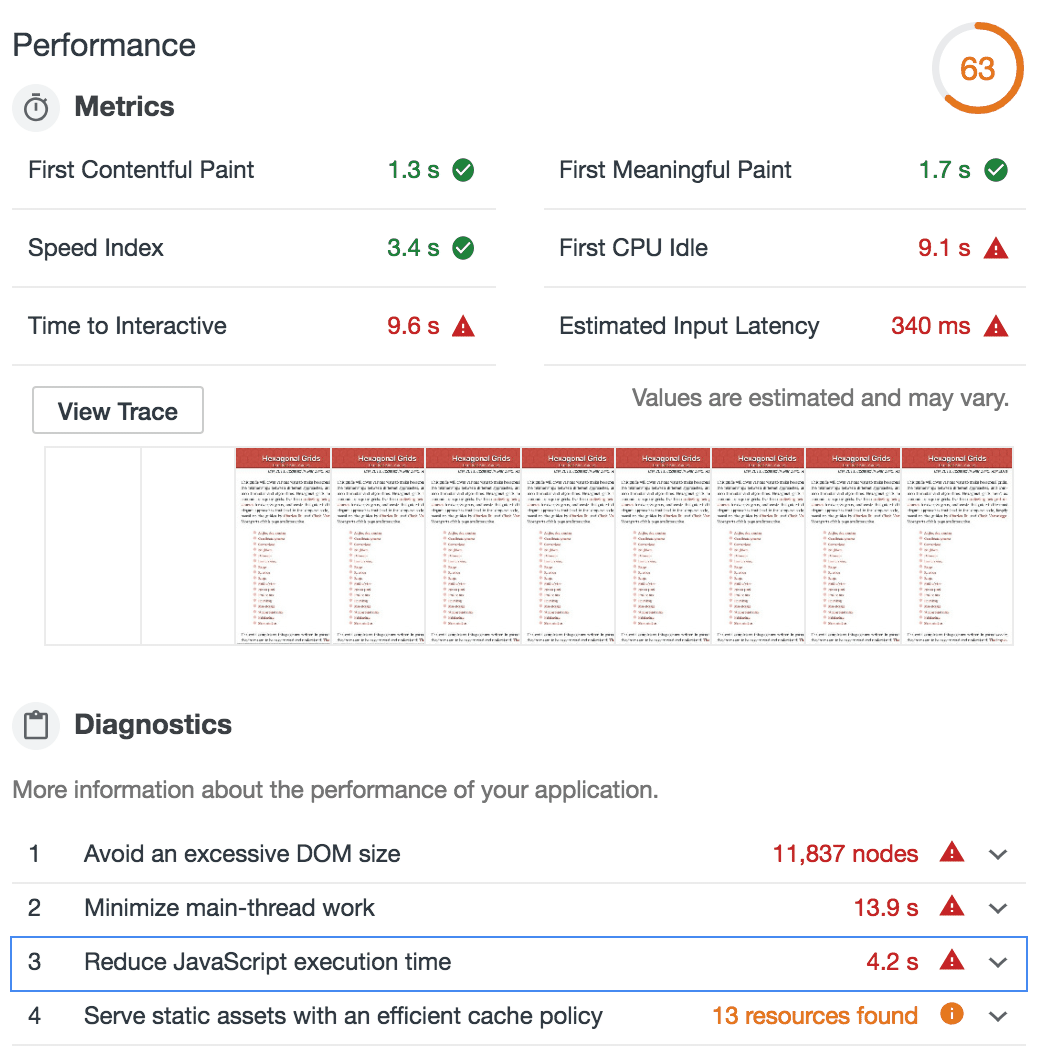
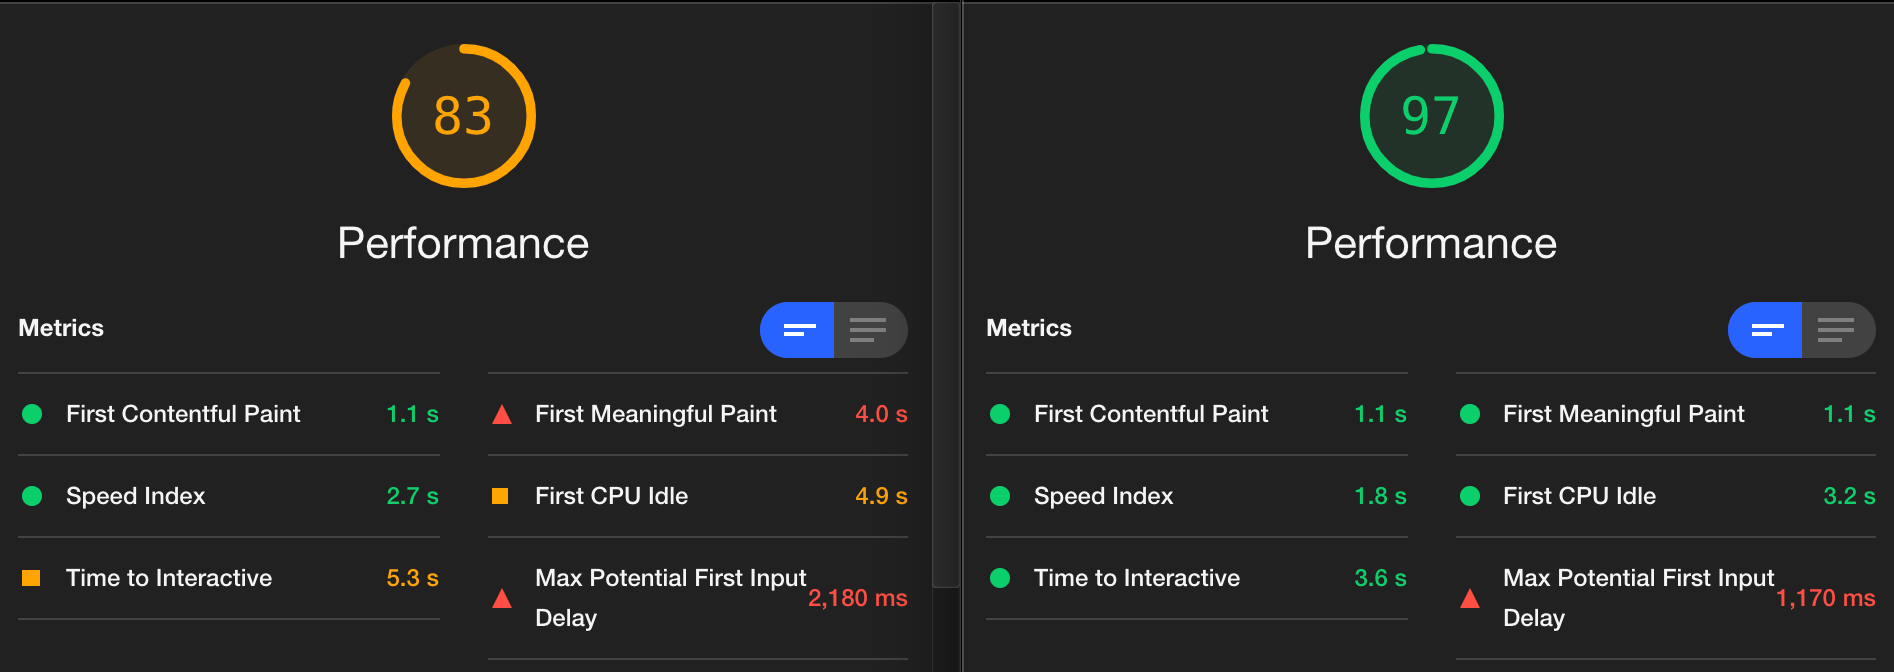
Last week I experimented with this a bit more. At load time, I was replacing the static SVGs with interactive SVGs. However, there's no need to do this immediately. I changed it to wait until the diagram was visible on screen (using IntersectionObserver). This helps quite a bit! The "time to interactive" score goes from 9.6sec to 4.9sec and the overall page speed score goes from 63 to 89:
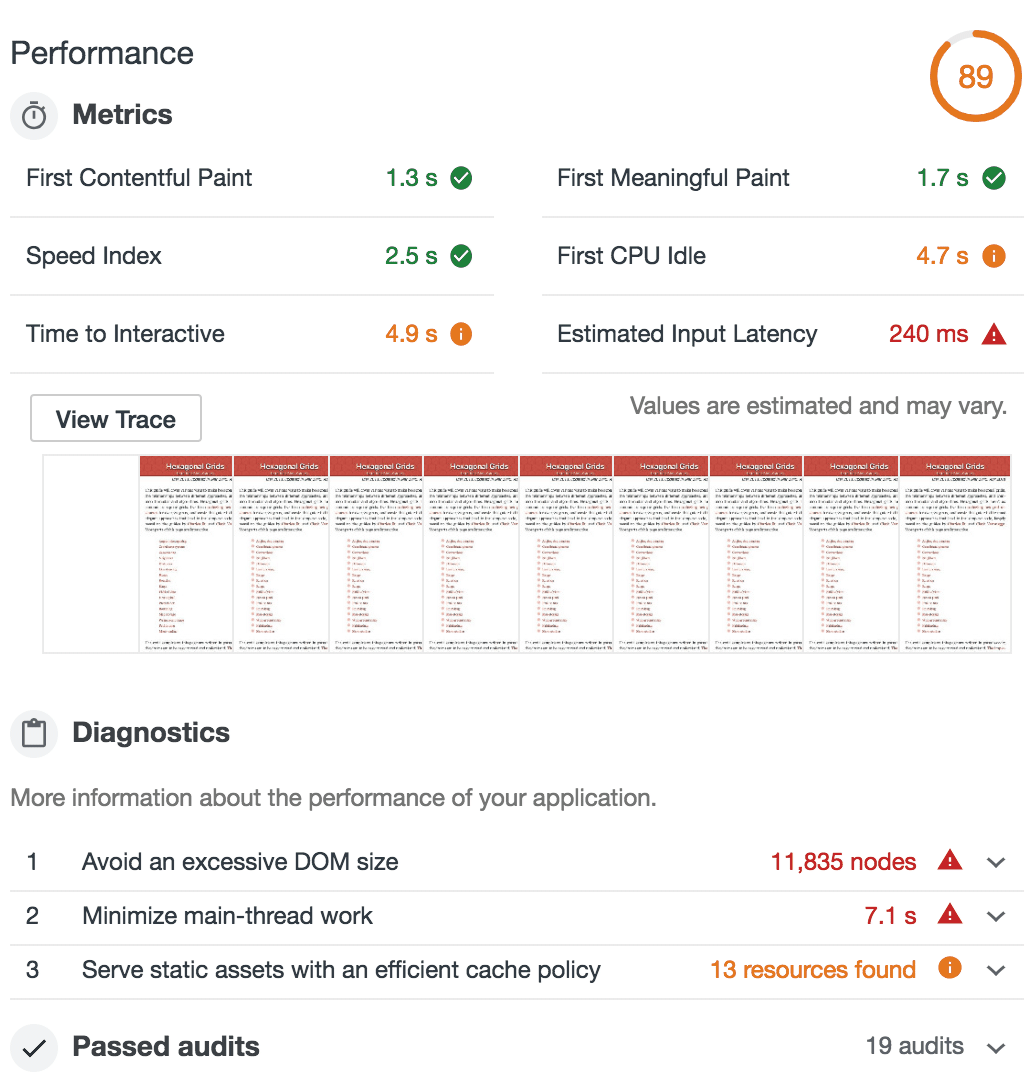
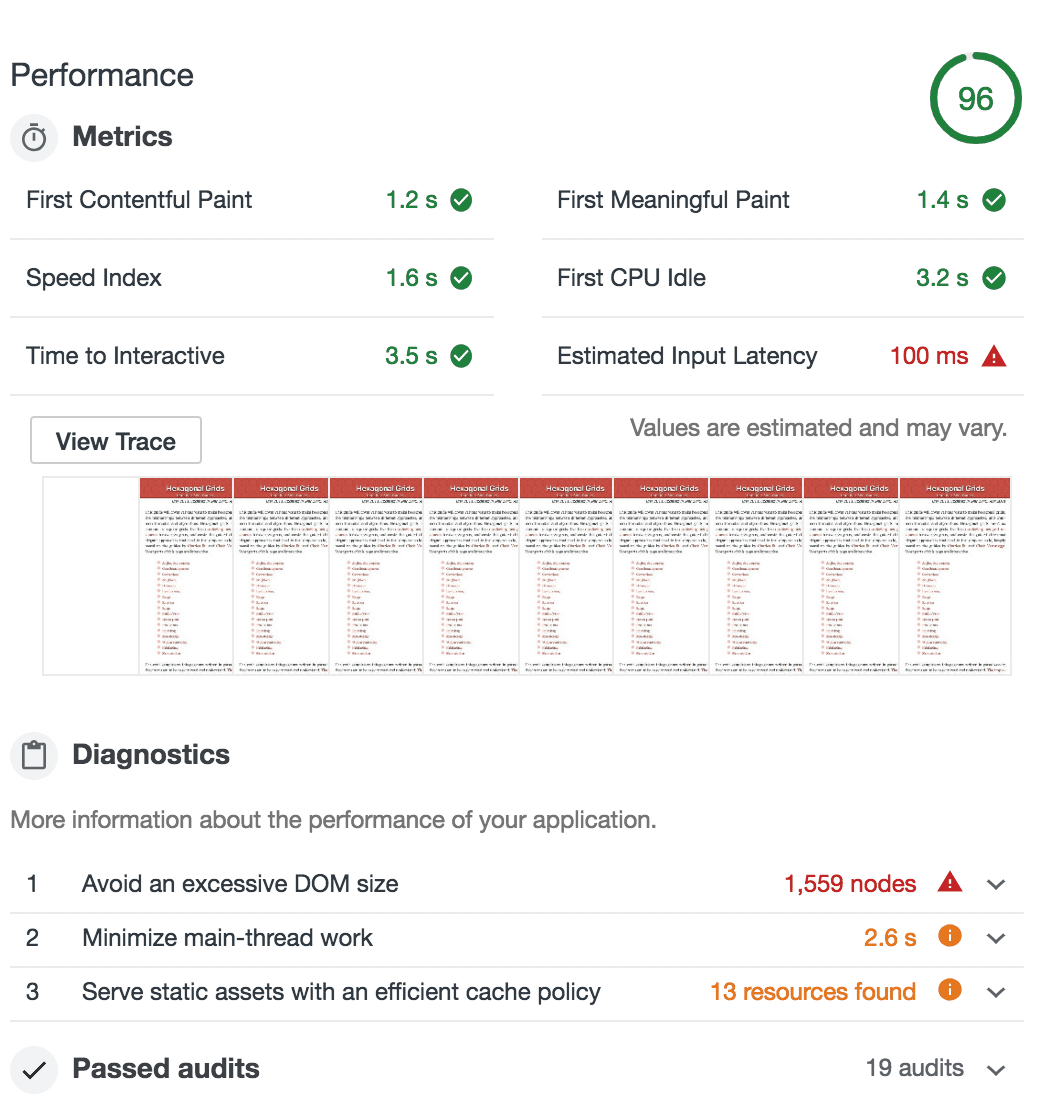
I was wondering if I could make it even faster by prerendering only some things on the server ("CSR with Prerendering" on Google's rendering tech page). The page shrinks from 633k to 179k! And the page score goes from 89 to 96. Time to interactive goes from 4.9s to 3.5s:
Great! However, it started to bring back the problems that I had solved last year. This version doesn't allow printing the page, loading it without Javascript, using "Reader modes" (including Pocket, Instapaper, RSS, etc.), or Ctrl+F to find diagram text on the page. The more I used the page, the more little glitches I found. None of these are super important, but they're not going to get better. In contrast, the load time will continue to get better as cpu and network speeds increase, HTTP/2 is adopted, and compression protocols improve (Brotli, HPACK, etc.). Another consideration is accessibility. I've been told that most screen readers support Javascript, but deferring the creation of SVG using IntersectionObserver means the SVG may never get created, so it would have the same problem as printing and Ctrl+F.
I decided to keep the pre-rendered static SVG for now, with deferred interactive SVG. It's simpler for me and I have fewer corner cases to deal with. I'll revisit this in the future when I update my A* pages to load faster.
Update [2022-11-01] Pre-rendering on the server was complicating my website management, so I took it out. The Lighthouse score continues to be good though.
Labels: making-of
Printing my pages #
Occasionally someone will want to print one of my web pages, even though it means losing access to all the interactive parts. There are a few things I do to make this work better:
- I try to start all my interactive diagrams in a state where it's informative without interaction. This is not only helpful for printing, but also for people skimming the page. I haven't always done this in the past so I've been trying to go back through my older pages and change them to work this way.
- I have a "print stylesheet" using @media print { … } that changes the page style when printing. It changes the font, removes background colors, removes text shadows, and instructs the browser to avoid breaking the page inside a diagram.
- (Added today) When printing, I display the URLs for the links on the page. Since you can't click the links, it's useful to display the URLs.
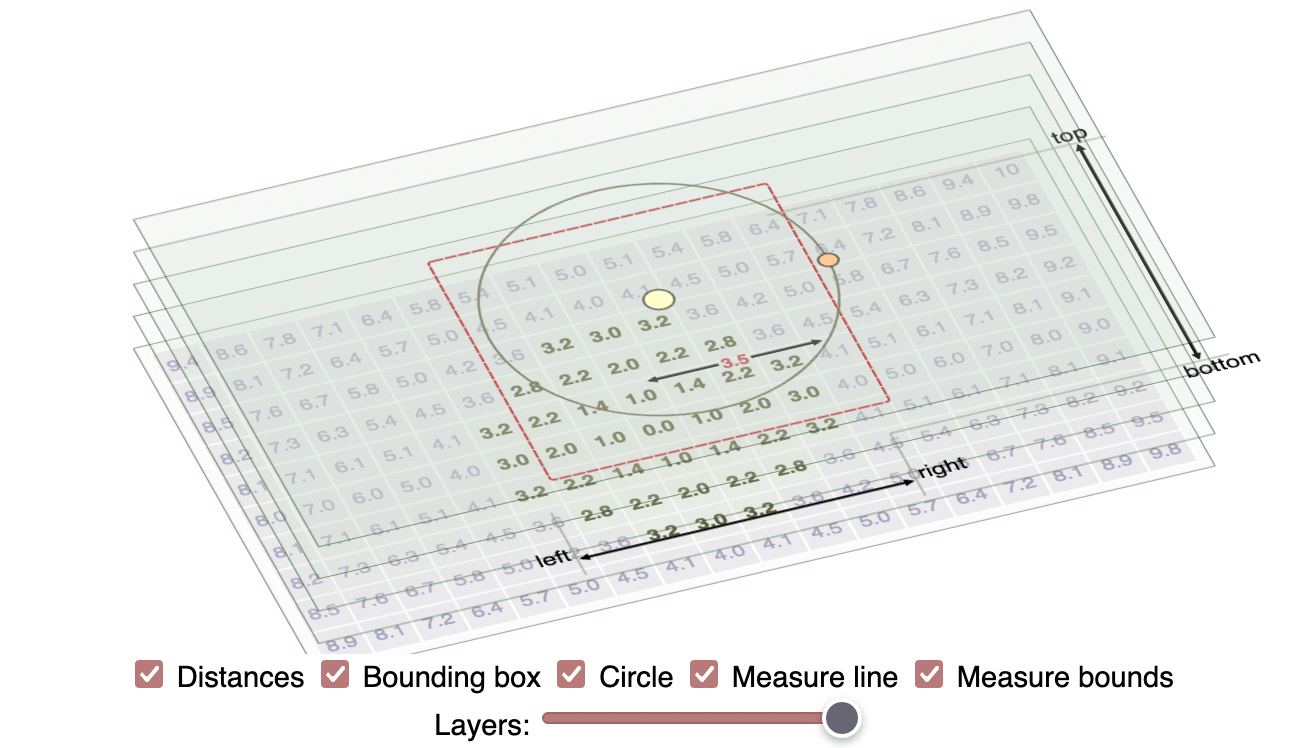
Tower Defense page: distance fields #
One reason I prefer having web pages instead of videos or academic papers is that they're easy to update over time. I'm still updating pages I wrote over 20 years ago.
Yesterday I was reviewing the Tower Defense page (2014) and decided the gap between the diagram at the top:

Labels: making-of , pathfinding
Touch events on the pathfinding pages, part 2 #
I've been avoiding mapgen4 for a few weeks now. I ran into a really annoying bug that frustrated me enough that I wanted to give up. I still need to get back to it, but I'm “productively procrastinating”. Instead of sitting around being frustrated, I'm getting other things done: map generation on a sphere, a procedural face generator, and adding touch event support to my pathfinding pages.
When I wrote the A* tutorial, I didn't consider touch events at all. The traffic I got from mobile/tablet was small. I soon added some touch event handling, but it was incomplete. I figured I'd fix it later. Well, it's been four years now. It's time to fix it finally! (Update: I think my touch event handlers used to work, but I think they stopped working when Chrome 56 and Safari 11.1 changed event handlers to default to passive sometime in late 2017 / early 2018; see this and this)
Labels: making-of
Thoughts on explorable explanations #
Conversations with several people over the past few months have led me to wonder about the purpose of the interactive diagrams in my articles. I see lots of interactive diagrams but most are not integrated into text. The interactive diagrams are cool. They make me feel like a pioneer exploring a new medium. They're exciting! I like making them! But … that doesn't mean I should be making them.
April updates: hex grid guide, load time #
The past 7 weeks I've been working on my guide to hexagonal grids. Over the years I accumulated a long list of TO DO items on my Trello page, and I finally went through that list and implemented lots of them. Two blog posts ago I described rewriting it from an imperative style to a declarative style, and switching from manual to automatic dependency tracking. In the last blog post I described many of the improvements I made to the diagrams, including several new ones.
As I've added to the page over the years, it's become slower and slower. The main problem is the page loading time. The HTML loads, then the Javascript loads, then the Javascript runs to create the diagrams, sample code, and some of the text of the page. If you follow a link to a specific section, the browser jumps to that section, but then the layout changes as more content is added to the page by the Javascript. This is an unpleasant experience.
Labels: making-of
April updates: hex grid guide, iteration #
One of my goals this year is to iterate more. I have a tendency to "launch" a page and then move on to the next topic. Instead, for the first few months of the year I decided I would go through my existing pages to:
- figure out how the content could be better (explanations, diagrams, user interface, little details)
- figure out how the tech could be better (load time, animation code, diagramming code, code structure)
Over the past 6 weeks I've been working on my guide to hexagonal grids. I first worked on the tech, switching from an imperative style to a declarative style, and also switching to a library with automatic dependency tracking. Then I worked on content updates, some of which I described in my previous blog post. In the past week I've been going through my list on trello and implementing more content updates:
April updates: hex grid guide #
“We can rebuild it—we have the technology.”
Over the past few weeks I've been reimplementing my guide to hexagonal grids. I'm generally not a fan of rewrites that have no end-user benefits but there are lots of improvements I want to make to the page, and the convoluted code was making it harder to make the changes I wanted. I ended up spending 60 hours on this, reduced the number of lines of code from 2400 to 1400, and reduced the total Javascript sent to the browser (gzipped) from 85k to 54k. A large part of this was rewriting the diagrams to use Vue.js instead of D3.js. As much as I love D3, there's not much on the hexagon guide that benefits from it, and I ended up using it as a nicer JQuery. In a previous blog post I described wanting dependency tracking. That's why Vue.js worked well for this page. I think React would've been a reasonable choice as well, but on this page Vue fit my needs better.