The science of science is to robustly challenge the science, and not to just blindly accept it. Climate and energy news from Germany - by Pierre L. Gosselin
Currently there’s much hysteria across the German media surrounding this summer’s hot weather and drought. Without surprise, it’s allegedly unprecedented.
Cloud cover changes are a “top-down dynamical driver” of Earth’s climate.
A July 2026 Environmental Research Letters paper authored by Bellocchi et al. attributes ~80% of the rise in Earth’s absorbed solar radiation since 2000 to declining high-reflectivity cloud cover, primarily from circulation-driven contraction of storm-cloud zones.
The study highlights the climate’s “albedo governance,” suggesting a 1% shift in Earth’s albedo corresponds to a 1°C surface temperature change.
With more cloud cover, more solar radiation is reflected and the surface cools. With declining cloud albedo, which has been observed since 1980, less solar radiation is reflected and the surface warms.
Cloud cover changes are driven by natural atmospheric circulation modes and internal variability. This is supported by reconstruction data showing cloud cover decline has for centuries occurred independently from “greenhouse-gas forcing.”
In new research (Liu et al., 2026), scientists acknowledge clouds “markedly impact near-surface air temperatures” by altering the radiation budget and driving heating rates across the Arctic. For example, a cloudy day in winter may deliver 20-30 W/m² of cloud radiative forcing (CRF), warming the Arctic surface by 6-9°C.
However, due to massive uncertainties in estimating cloud fraction (CF) and their radiative effects, “substantial inconsistencies across datasets in trend magnitude” persist, and thus “there is still no consensus on the long-term trend of Arctic total CF over recent decades.”
Systematic errors (biases) in estimating downwelling shortwave (SW) can deviate by 90-160 W/m² from one dataset to the next. Overall, datasets disagree by 20-70 W/m² when estimating downwelling SW across the Arctic, and thus our measurements are “insufficient to meet the needs of radiation energy budget estimation.”
The increase in atmospheric CO2 is alleged to be the driver of modern Arctic warming. This attribution can be no more than speculation, however. The 20-70 W/m² uncertainty in estimating the Arctic’s surface solar radiation is 100 to 350 times larger than 10 years of accumulated clear-sky-only CO2 impacts (0.2 W/m² per Feldman et al., 2015).
A weather site’s amazingly sloppy measuremnt goes viral across Germany…
Much of Europe has been enduring a heat wave and below normal precipitation. Not surprisingly, the media are busy using the hot weather to further promote climate alarm and get more clicks however they can.
One way to accomplish this is to use sompletely bogus measurements to get viewers to believe the end of the world is near. The latest example is brought to you by Germany’s donnerwetter.de – a weather site no less!
Likely with the aim of magnifying the drama of Germany’s drought situation and the recent hot weather, donnerwetter here at Facebook posted a video showing the Rhine River’s alleged dire situation:
“28°C water temperature”, proclaims the gentleman from donnerwetter.de, after dipping his thermometer in the Rhine yesterday. Germany is cooking!
That footage of the Rhine’s temperature measurement has since gone viral across Germany, but not because of the Rhine’s 28°C temperature. The video has made a splash across the German Internet because of the obviously totally shoddy manner the measurement was performed!
2 cm depth
Firstly, the measuremnet was made in ridiculously shallow water — so shallow in fact that the man was able to walk to the spot with his running shoes on. Perhaps he didn’t want to bother taking them off. Maybe he forgot to bring boots along. No need! 2 cm depth is close enough!
The 1 sec. dip
Next, he dips the end of the thermometer in the water, but holds it there for just a second, second and a half, never allowing the instrument a real chance to react. The 28°C reading was probably the air temperature- This would make sense judging from the shadow the man casts–indicating the measurement was performed on the East side of the Rhine and the time being around 10 – 11 a.m. The video itself was posted on Facebook at 12:32 pm.
Time to heat up
The extremely shallow and still water had ample to time to heat up for hours under the bright morning sun.
Shoddy quality on display
According to its website, donnerwetter is located in Bonn, so the measurement was probably taken at the Rhine there.
Donnerwetter.de is run by meteorologist Dr. Karsten Brandt, a man we could expect to have good knowledge on how to properly take accurate measurements. It’s a real mystery how such shoddy quality got passed him. Brandt’s partner at donnerwetter.de is Michael Hoffmüller-Klein.
As of 3 pm today, donnerwetter.de still has yet to take down this embarassing video at Facebook.
#Rhine: The low water levels are at 26–29 degrees Celsius—Impact on the Economy
Our forecast: The prolonged low water levels on the #Danube and especially the #Rhine will have a massive economic impact on the German economy, as they are expected to persist for weeks.
Unless the weather changes, it may not be until September that water levels reach their lowest point, well below current levels.
www.donnerwetter.de
Welcome to the new “normal” in #Europe”
There is a publication by the RKI [Robert Koch Institute] on “Heat and Excess Mortality in Germany.”
The methodology is also explained in it: calendar weeks with a mean temperature above 20°C are filtered out, and then the excess mortality figures provided by the Federal Statistical Office for these periods are declared to be “heat deaths.”
The “model” is simple and delivers the desired results: this year, up to calendar week 29, we have already seen nearly 10,000 heat deaths. A distinction between “from heat” or “with heat” is not even attempted (just as with the Covid-19 deaths), even though it could be very important for assessing the actual cause of a death. The headline is set and eagerly quoted.
The 3rd figure from the RKI shows deaths per year starting from 2016. They occur in the summer months. What could be more obvious than building an (equally) simple model that directly links annual death figures with average summer temperatures? This “model” also doesn’t care about real physiology and the actual impact of heat on human beings.
When is heat actually life-threatening?
For this, there is the “wet-bulb temperature.” You can determine it yourself: wrap a moist cloth around a thermometer. Evaporation follows, which cools. How much it cools depends on the humidity of the ambient air. This metric measures both, and starting at around 30 °C on a thermometer prepared this way, it becomes critical for humans because thermoregulation (sweating) can no longer function sufficiently.
What are realistic values? On July 30, 2026, at 4:00 PM, 37 °C was measured in Berlin with a dew point of 12 °C. The wet-bulb temperature came out to 21°C. That was about 9°C short of the critical threshold. The heat was NOT life-threatening because the air was too dry, allowing thermoregulation to work effectively. The RKI does not take any of this into account; it solely uses the “mean air temperature.”
Well then, the RKI “model” for annual figures can be recreated in just a few minutes.
The data for the deaths assumed by the RKI can be downloaded here. Only the numbers for Germany are interesting. Now, one just needs the “average summer temperatures” from the DWD [German Weather Service] from here.
A scatter plot is created in no time using the 2016–2025 data:
Figure 1: Heat deaths vs summer mean temperature.
Indeed, the number of deaths depends 81% on mean temperatures (the R-squared). From the line equation in the diagram, a tool emerges to replicate the RKI figures:
Robert Koch Institute Figures and Model
Figure 2: Heat deaths vs year.
The correlation is sufficient; the mean error is only 21%.
Now one can apply this “model” starting from 1950. According to it, no one dies “from” heat at a mean summer temperature below 17.4 °C. Above that, they do! However, mean temperatures say almost nothing about actual “heat” on individual days.
Figure 3: Heat Deaths Since 1950 (RKI)
Up to 2025, the year 2003 takes the cake with almost 8,700 heat deaths—except the RKI hasn’t noticed this yet. According to this logic, a total of around 72,000 people became “heat victims” since 1950.
So much for the “model” using simple linear regression. It simply links mean temperatures with “heat deaths” and aligns very well with the RKI’s model along with its stated uncertainties.
Pure statistical artefact
What both have in common is that they have nothing—absolutely nothing—to do with physiology or real health risks from heat. The “heat deaths” are a pure statistical artifact. It is simply “assumed” that excess mortality during a warm week is caused by the heat. The final image achieves the desired effect: “Look how many fatalities climate change is costing us!”
All of this from a “model” by an institute whose actual job is to provide valid risk analyses for human health. Its “heat death model” is a joke without any physiological background! Is the institute serving purely political interests once again? That would be truly tragic!
Now a new study shows increasing the greenhouse gases CO2 and CH4 radiatively cools the Arctic too.
Rising concentrations of greenhouse gases – presumed to be derived from anthropogenic emissions – induce Arctic cooling “primarily due to the near-saturation of infrared absorption [CO2 and CH4] in the lower atmosphere”.
“In the lower atmosphere (>700 hPa), the magnitude of the CO2 kernel decreases significantly, indicating a weaker suppression of outgoing longwave radiation by increased CO2 concentrations.”
“In the lower atmosphere, from the surface to approximately 400 hPa, the heating rate [derived from increasing CO2] exhibits relatively large negative values, indicating strong radiative cooling.”
“…the heating rate remains negative at all levels, indicating the longwave radiation leads to net atmospheric radiative cooling.”
“…the observed vertical structure enhances outgoing longwave radiation compared with the uniform distribution, thereby strengthening radiative cooling in the Arctic atmosphere.”
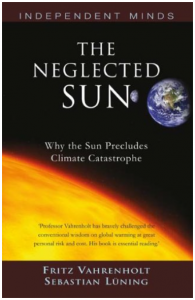
A recent investigative interview by Apollo News featuring former Hamburg Environmental Senator and energy expert Fritz Vahrenholt has sparked intense debate over the stability of Germany’s power grid and the future of its industrial economy.
As Germany aggressively transitions away from traditional baseload power and over to erratic renewable energies like wind and sun, government agencies are secretly preparing for worst-case energy shortages.
Forced shutdowns, no financial compensation!
According to documents obtained by Apollo News, the Federal Network Agency (Bundesnetzagentur) has been quietly developing emergency protocols over the past two years. Under these plans, the agency could order industrial plants consuming over 10 GWh per year to limit or completely shut off electricity usage with just 24 hours’ notice—and crucially, without any financial compensation.
“This is how far the energy transition has pushed us. We are at the level of South Africa, where they also do rolling blackouts […] because they cannot generate enough electricity,” said Vahrenholt. “”It is not about the climate at all. In the end, this is about anti-industrial policies, policies designed to destroy Germany. That is what ultimately comes out of this.”
Vahrenholt warns that the simultaneous exit from nuclear power and ongoing coal phase-outs have severely depleted Germany’s controllable, dispatchable energy supply. While wind and solar capacity have expanded significantly, they remain weather-dependent and cannot supply power during extended periods of low wind and sunlight (Dunkelflaute).
Although the German government plans to construct new gas-fired power plants as a backup, Vahrenholt highlights that these facilities will not be operational until 2031 or 2032 at the earliest. This leaves a dangerous multi-year window where grid instability and forced rationing threaten industrial stability.
Profound economic and industrial consequences
The threat of sudden, uncompensated power shutdowns creates immense operational uncertainty. This environment deters foreign investors and pressures domestic industrial companies to shift investment and production abroad. Forced curtailments would primary hit energy-intensive key industries, including aluminum, copper, steel, chemical, glass, and paper manufacturing.
Relying heavily on imported natural gas carries geopolitical risks and volatile prices. Furthermore, the political push to eventually transition these plants to green hydrogen threatens to drive future electricity prices to uncompetitive levels.
Solutions proposed by Fritz Vahrenholt
To restore energy reliability and protect the industrial base, Vahrenholt outlines three critical steps: 1) Stop the shutdown of remaining coal-fired power plants to preserve crucial back-up generation, 2) bring 3 to 6 recently closed nuclear reactors back online. According to Vahrenholt, this is technically feasible and would provide decades of zero-emission baseload power at a fraction of the cost of yearly renewable subsidies. 3) tap domestic gas reserves in states like Lower Saxony and Saxony-Anhalt to lower energy costs and reduce dependence on expensive foreign Liquefied Natural Gas (LNG) imports.
Recent Germany forecasts of “never seen before heat” coming next week are already fizzling out. OI course there’s going to be some hot weather next week, but probably nothing like the click-baiting media have been warning.
Snowfan at “wobleibtdieerderwaermung” reports today that none of the ECMWF models is predicting a heat wave and that they continue to show heavy summer rainfall across large parts of Germany.
The SWISS model (above-left) is forecasting heavy summer rain from July 25, 2026, through early August across large parts of Germany, except for the southeastern half. The AISF (above-right) is forecasting heavy rainfall of 40 to 50 mm across all parts of Germany through August 9, 2026. Source: Kachelmannwetter model forecasts for precipitation amounts in Germany, with additions. (It’s important to note that model forecasts can vary widely from model to model beyond 5 days out).
The AI version (below) of the ECMWF (top) also doesn’t forecast a heat wave, just two days with temperatures over 30°C:
ECMWF July 25 forecast. No real heat wave.
Ironically. amid all the media hype over drought and heat, Germany, Austria and the Czech Republic have been quite chilly over the past week, with reports of ground frost or near ground frost yesterday morning:
Ground surface low temps yesterday over Germany. Image: Wetteronline
Next week we’ll find out if the forecast models mentioned above were right.
Since then, a long-term cooling trend with superimposed fluctuations has prevailed.
Mayer criticizes popular publications (such as the 2013 paper by Marcott et al.), alleging that statistical artifacts or improper blending of proxy data with modern measurements are misused to depict an extreme temperature rise.
Mayer finds a pattern that runs throughout the paleoclimatological literature: “The closer one gets to the present, the more blurred the line becomes between proxy data and instrumental measurements, between reconstruction and model assumptions.”
Historical solar activity and the solar cycle (Schwabe cycle) can be reconstructed using isotope analysis (such as and in tree rings). In addition to changes in total solar irradiance, the article points to the shielding of cosmic rays by the solar magnetic field. Weak solar activity allows more cosmic radiation to reach Earth, which can promote cloud formation and contribute to cooling.
Mayer presents historical climate periods that are directly linked to reconstructions of solar activity:
Roman Warm Period (~250 BCE – 400 CE): High solar activity and mild temperatures (1–2 °C above pre-industrial levels).
Migration Period & Early Middle Ages (~400–750 CE): Drops in solar activity (Grand Solar Minima), cold spells, crop failures, and plagues.
Medieval Warm Period (~900–1300 CE): Stable, high solar activity resulting in warming, thriving agriculture, and ice-free Alpine passes.
Little Ice Age (~1300–1850 CE): Troughs in solar activity (Spörer, Maunder, and Dalton Minima) led to global cold snaps and advancing glaciers.
Modern Warming (from 1850 onwards): The warming over the last 170 years is interpreted primarily as a natural recovery from the cold peak of the Little Ice Age.
Mayer concludes that the sun is the dominant external driver of Earth’s climate. He criticizes mainstream climate science (such as the IPCC) for focusing primarily on as the main cause, arguing that natural solar cycles must be given greater weight in the climate debate.
Wind energy means a large-scal technological regression
Image: EIKE
In his presentation at the Climate and Energy Conference held by the Germany-based European Institute for Climate and Energy (EIKE) in Halle, Prof. Horst-Joachim Lüdecke explored the energy efficiency of wind turbines and finds that it is a terribly inefficient way to produce electricity.
Prof. Horst-Joachim Lüdecke concludes that wind energy is leading us “back to the Middle Ages.”
Lüdecke argues that human progress has always depended on continuously increasing the available power and energy density. This historical progression began in agriculture with draft animals, moved to medieval windmills and waterwheels, advanced to the steam engine and combustion engines, and culminated in modern coal and nuclear power plants.
According to Lüdecke, never before in human history has a society shifted on a large scale to a method that is backward-looking and yields a lower power density than already established technologies. Because wind turbines have an extremely low power density (averaging only about 3.6 watts per square meter annually and locally, compared to approximately 7,000 watts for coal plants), he views their large-scale expansion as a technological regression.
Lüdecke emphasizes that wind turbines suffer from fundamental flaws based on the laws of nature that cannot be fixed. In addition to their extreme dependence on the weather (“volatile power”), this includes the physical law stating that a wind turbine’s power output is proportional to the cube of the wind speed, If the wind speed drops by half, the power output plummets to just one-eighth (12.5%).
In summary, he views the attempt to power Germany primarily with wind and solar energy as a politically forced effort to return to an unreliable, medieval method of energy generation, thereby ignoring the historical principle of energetic progress,
“…a distinct pattern of water vapor suppressing the [sea surface temperature] diurnal amplitudes at low latitudes” – Harris et al., 2025
Observations show morning-to-evening sea surface warming amplitudes can exceed 5°C.
Water vapor (WV), the greenhouse gas (GHG) mostly responsible for Earth’s greenhouse effect, adds ~0.1°C warming to this 5°C diurnal change in the high latitude oceans, where WV concentrations are only 100-1000 ppm.
In the tropics, where its concentrations reach 40,000 ppm, the WV contribution to this >5°C diurnal warming is flat (~0.0°C) to negative (a -0.2 to -0.3°C cooling effect).
A 40-fold increase in GHGs/WV can thus can be shown to contribute to cooling the ocean surface instead of enhancing warming.
This is the opposite of what would expected to occur if increasing GHGs were indeed responsible for warming the global oceans.
By continuing to use the site, you agree to the use of cookies. more information
The cookie settings on this website are set to "allow cookies" to give you the best browsing experience possible. If you continue to use this website without changing your cookie settings or you click "Accept" below then you are consenting to this. More information at our Data Privacy Policy










Recent Comments