Most divergence signals are inconsistent.
Price → highs/lows
Indicators → closes
That mismatch matters, especially on large candles.
I built an indicator to align both:
Source-Aligned Oscillators
Check divergence the right way.
Soybean oil quietly breaking out.
4Y highs + one of the steepest backwardation curves we’ve seen in a while.
After the Iran shock lit up energy, ags look like the next leg.
Tight nearby supply, curve steepening = market pulling demand forward.
Watch this space.
TradingView just dropped an AI Copilot… so I had to test it 👀
Can it actually analyze charts and help traders — or is it just hype?
I ran it on real setups, indicators, and trends.
Some results surprised me…
🎥 Full review:
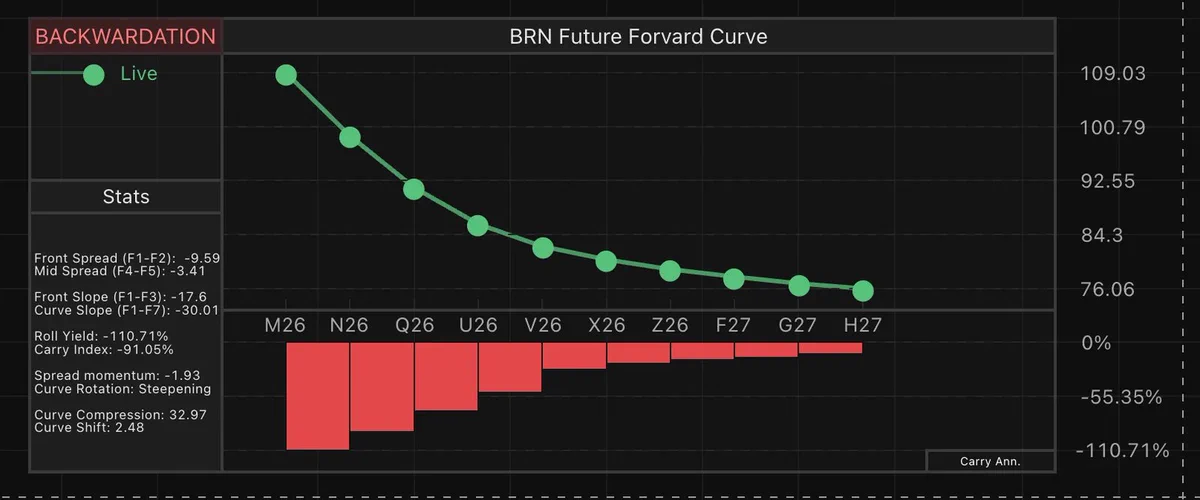
Brent is flashing a rare signal.
F1–F2 ≈ -$9.6
Roll yield ≈ -110% (record low)
This is not normal backwardation.
This is market stress.
Driven by Iran escalation + Hormuz risk →
The market is scrambling for barrels now
Longs get crushed by carry.
Physical wins.