Draftsman reads the Eloquent models of a Laravel application and lays them out as an interactive entity-relationship diagram — tables as cards, relationships as edges — that you can explore, rearrange, save, and export.
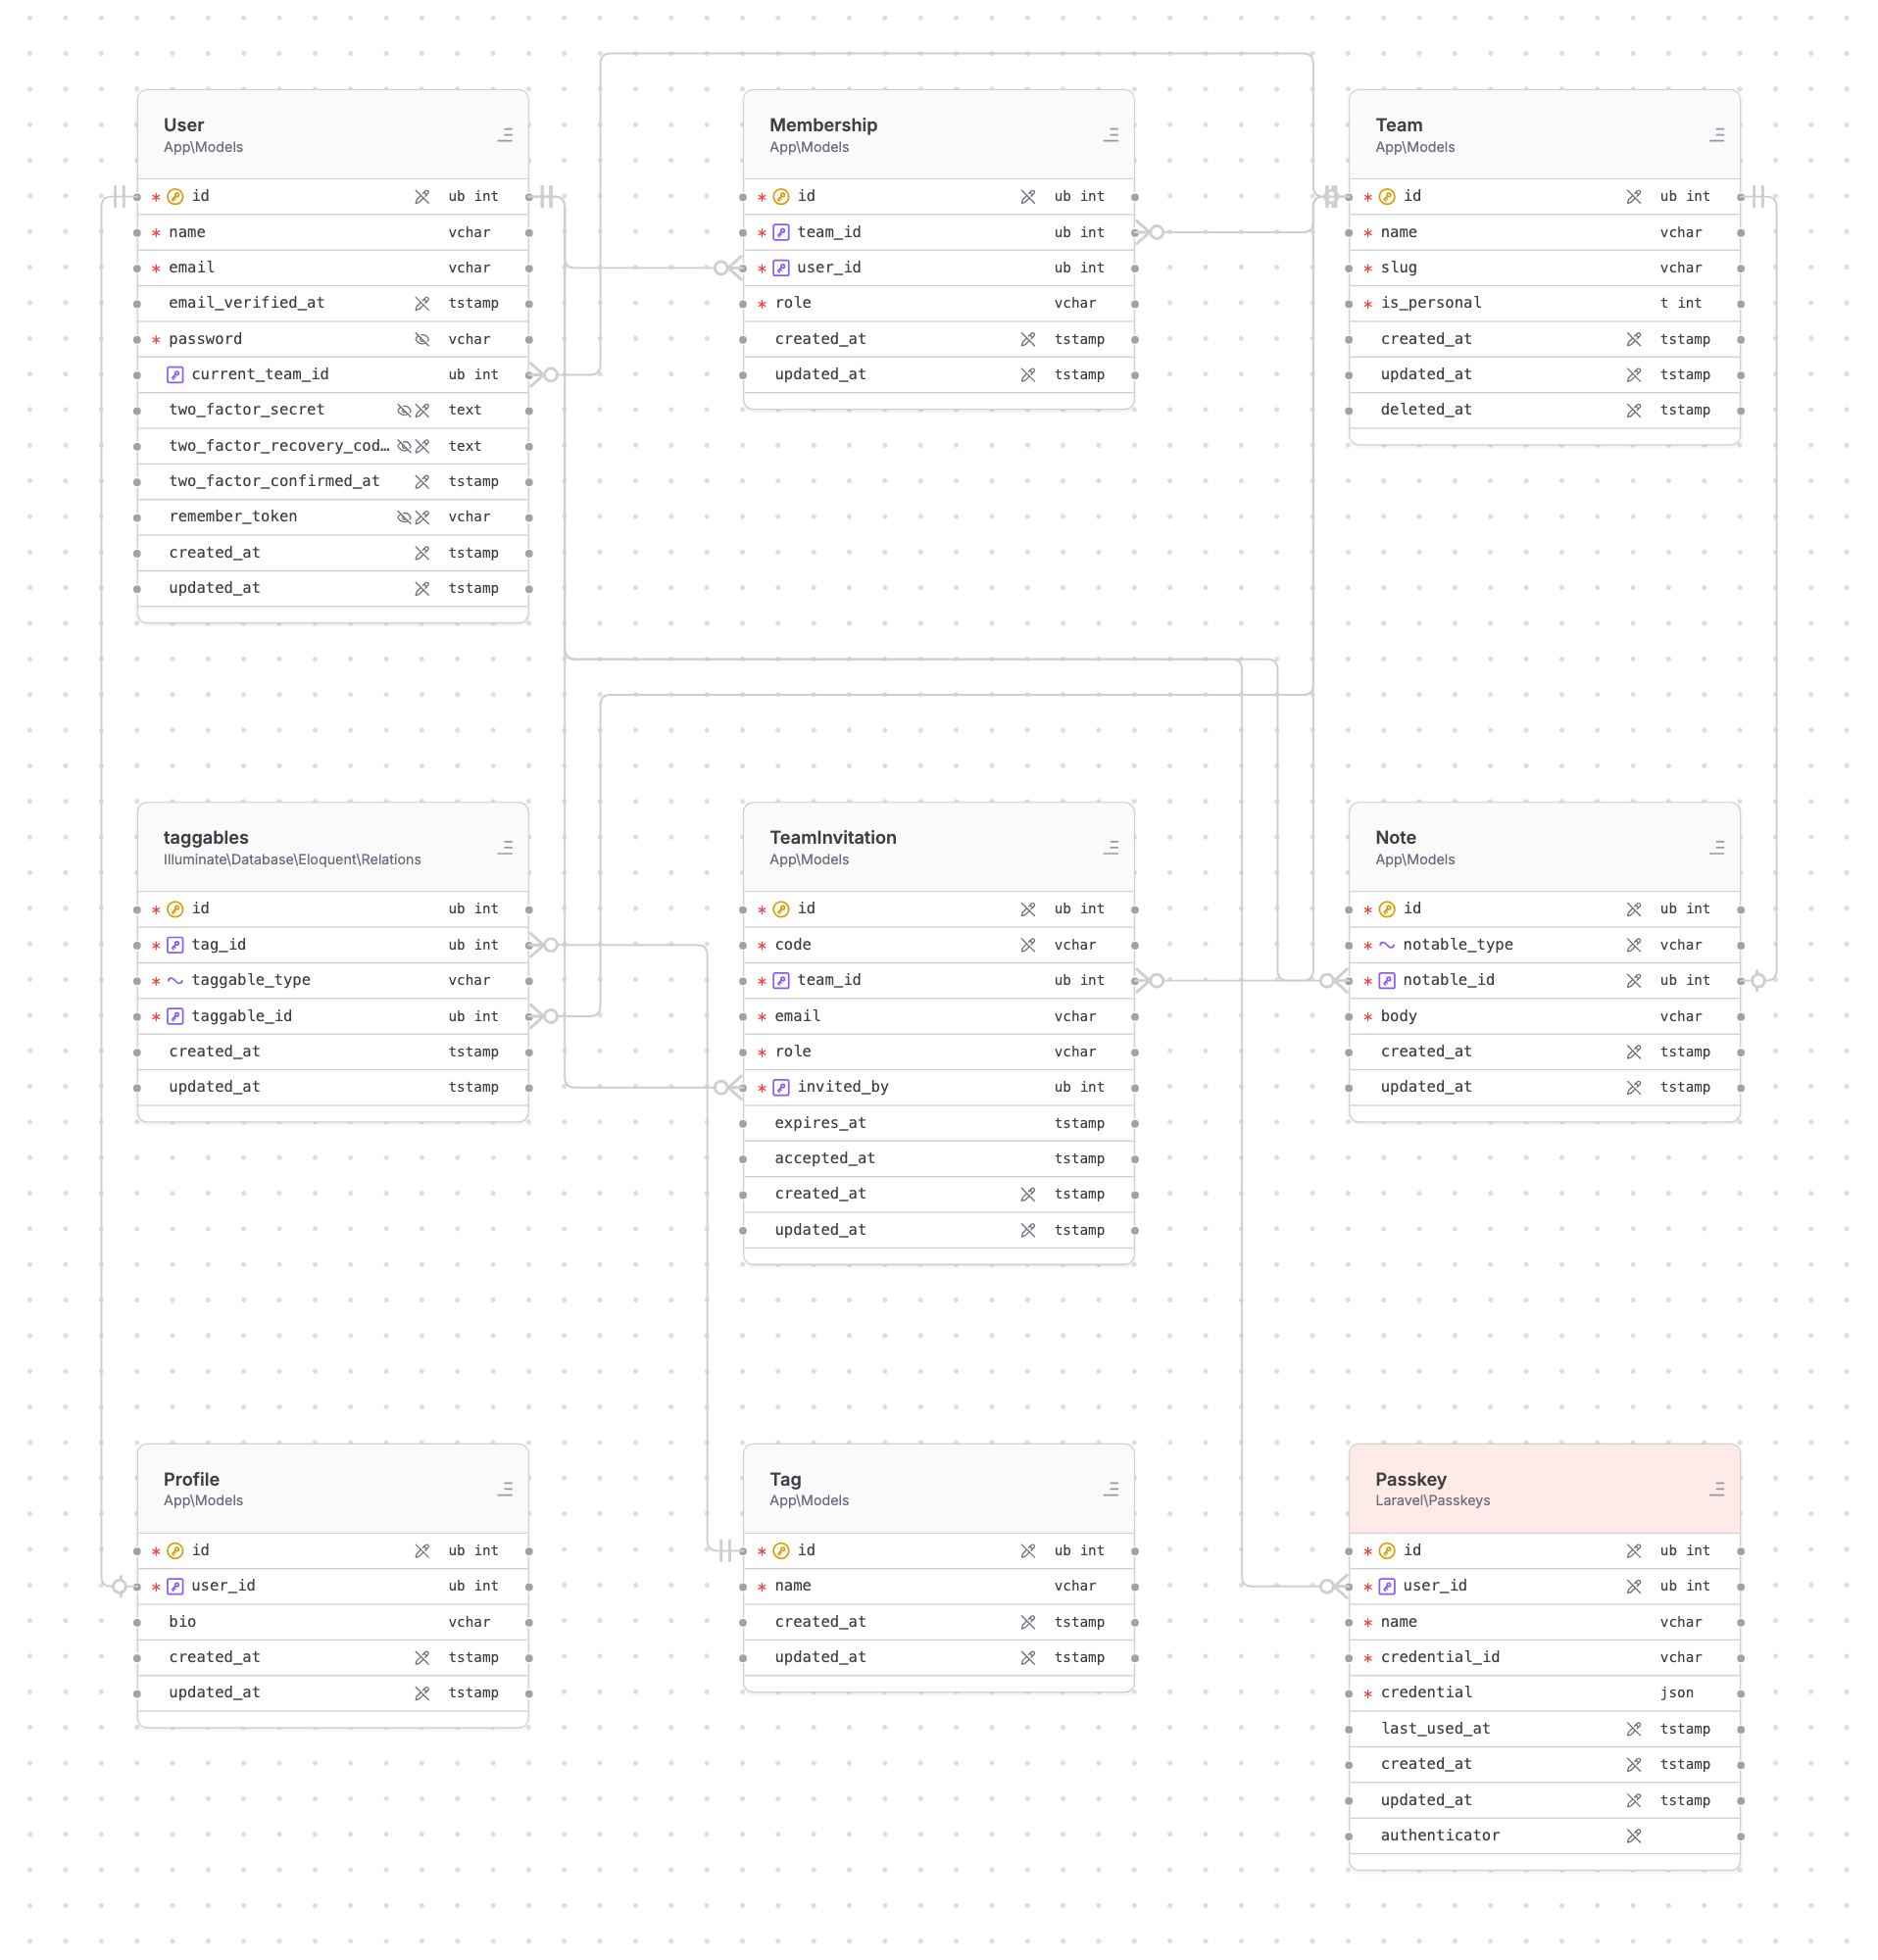
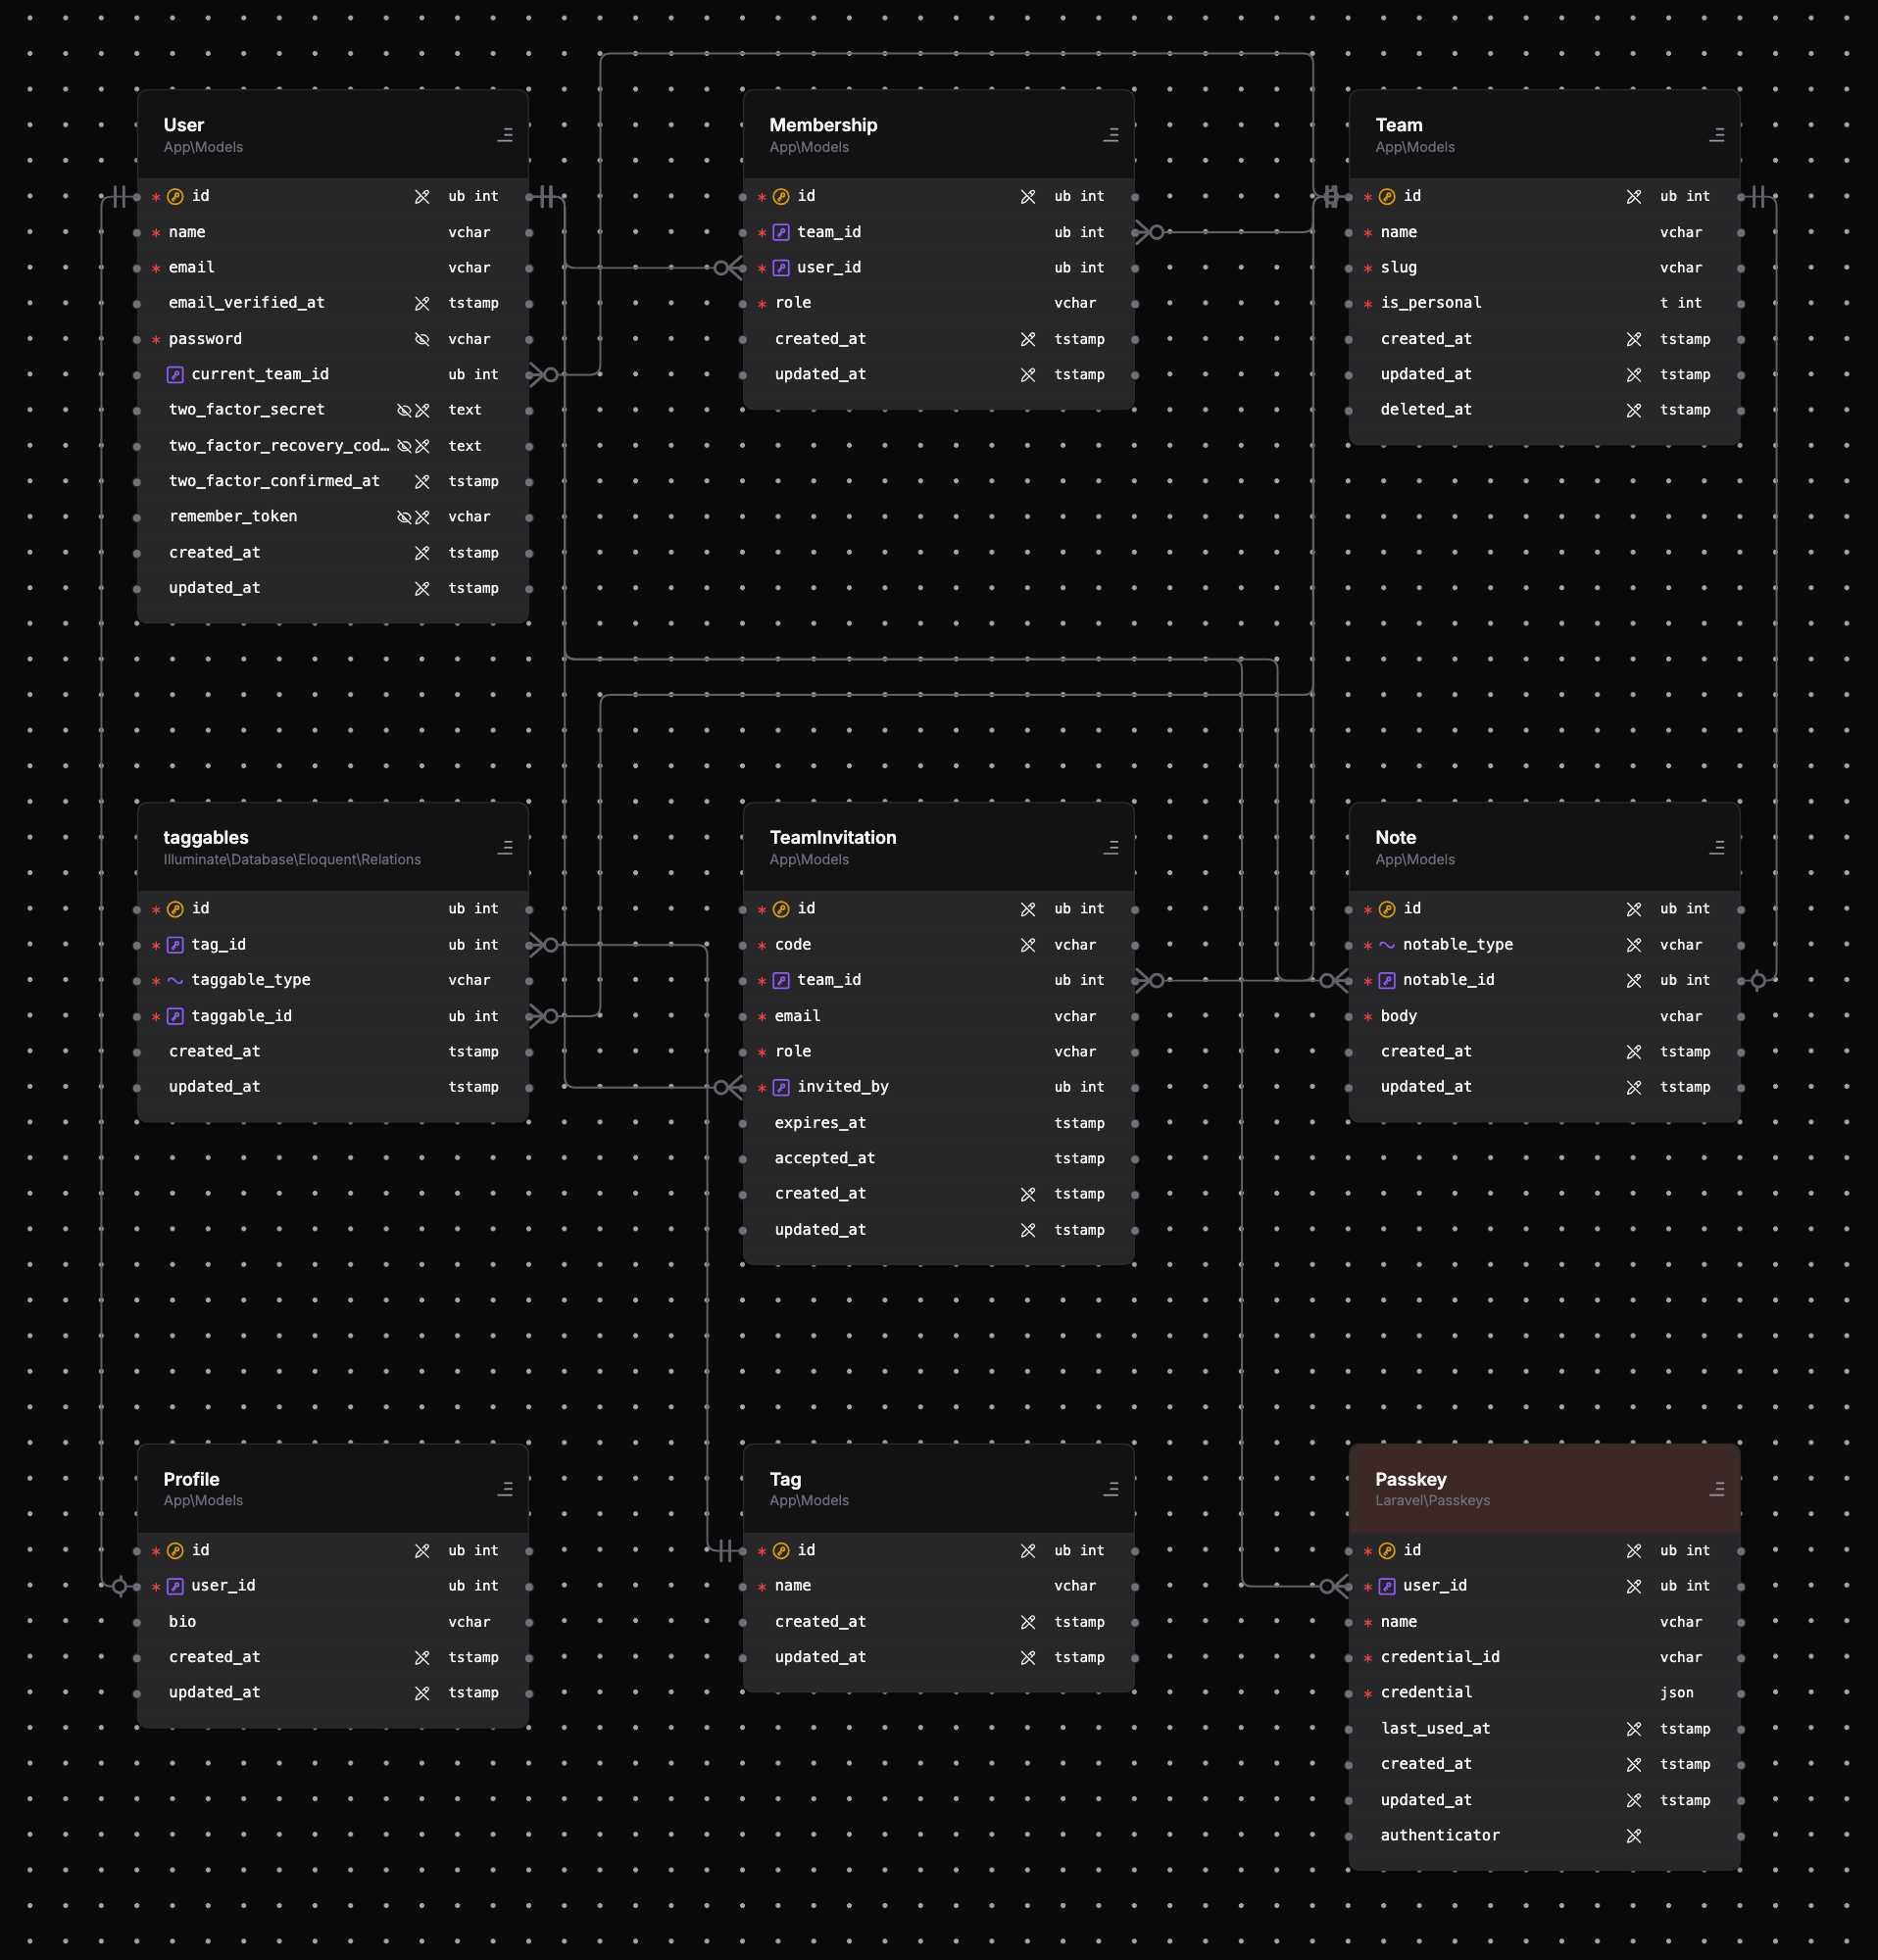
Every model Draftsman can see becomes a card on the canvas — including vendor models and
pivot tables your relations reach, so the diagram shows what your schema actually looks
like, not just what lives in app/Models. Pan and zoom freely, drag cards to
rearrange them, and use the mini-map or the control bar to get around larger graphs.
A lock toggle makes the canvas read-only when you just want to look without nudging
anything out of place.
Edges connect the actual key columns involved in each relationship — a foreign key row connects to the primary key row it references, not just one box to another. Pivot and intermediate tables are drawn as first-class cards, and Draftsman suppresses shortcut edges that would duplicate a path already visible through them. The optional crow's-foot notation marks the one and many ends of every edge — see the Relationships page for how each Eloquent relationship type is drawn.
Each card is the model's table: the header shows the model class and its namespace, and each row is a column with its short type. The row markers tell you at a glance how the model treats that column:
$fillable).$hidden).Selecting a card, a row, or an edge opens an inspector panel with the full details — the model's attributes and metadata, a column's exact definition, or the relationship an edge represents.
The sidebar's project switcher picks which connected Laravel application you are
diagramming, and each project can hold several graphs — different views of the same
models. Saved graphs are written through the package's API as JSON documents into the
host repository (draftsman/ by default), so your diagrams are
version-controlled right alongside the code they describe and survive across machines
and teammates. Save, Restore, and
Rebuild do what they say: persist the current layout, return to the
last saved state, or re-read the models and lay the graph out fresh.
A search field (⌘K) jumps to any model or attribute by name — handy once a
project grows past a screenful of tables.
The export menu renders the current graph to a file: self-contained HTML that works
anywhere, or PNG / JPEG images at your chosen scale, covering the whole graph or just
the current view. The same renders are available headlessly through the package's
draftsman:render command — see
Package for the CLI and CI side.
The settings panel groups its options into three tabs: