
Clear reporting, built around your program
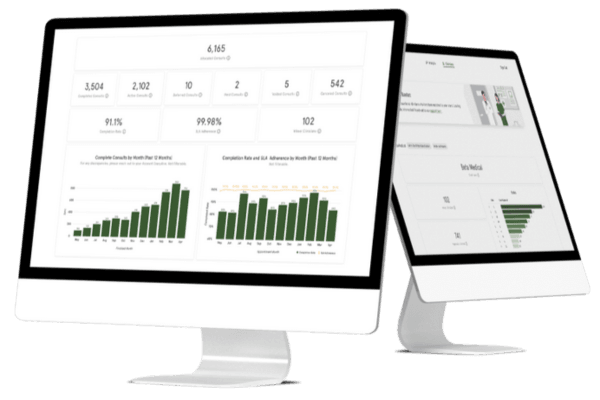
Wheel Horizon™ offers real-time data on your virtual care program. From patient demographics to visit conversion and completed visits by state or modality, you can track progress, measure impact, and demonstrate results for the program you're running.
Virtual care built for real-time decisions and lasting results
Wheel Horizon™ offers centralized access to the performance metrics that matter most for your program. From real-time dashboards to quarterly business reviews, you can track progress, measure impact, and continuously improve how you deliver virtual care.

Ready for a wider view?
Program reporting shows you how your own virtual care program is performing. But if you're looking to benchmark against broader market trends, or explore where demand is shifting before deciding where to expand, Wheel's market data offers a wider lens.
That data reflects emerging demand, evolving patient behavior, and regional shifts across virtual care, giving you a clearer read on where the market is headed.

