🗳 I was curious to see whether there might be a correlation between town ratings in France and the political affiliation of their mayor. I wrote a couple of scripts to help explore the data!
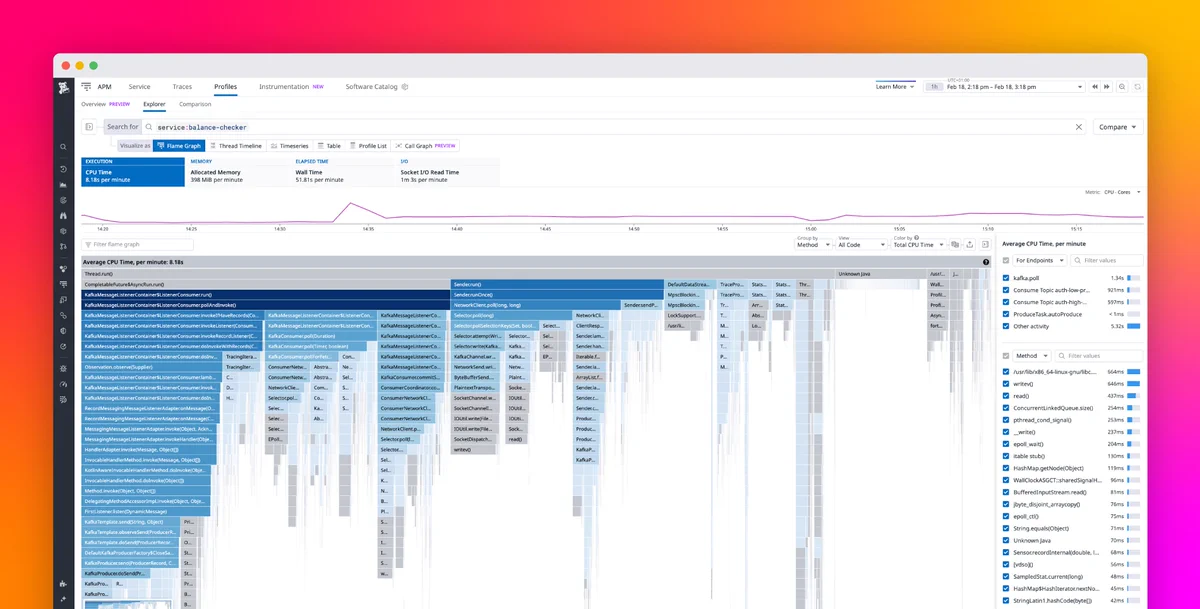
How can you make complex profiling data easier to understand? By using intuitive visualisations! Discover the work my colleague Greg Hurrell and I have done on this topic in our latest blog.
Profiling data, while invaluable, can be hard for novices to interpret. To address this problem and make it easy to gain insights into application performance, we’ve made some exciting changes to our Continuous Profiler visualizations. Learn more: dtdg.co/profiling-visu…
My colleague @_Pyves just published a blog post about the source code preview features of our continuous profiler 🎉.
One cool UX detail is how we show source code in the default view where we group by function rather than by line.
Some exciting new Shields.io badges are available to get the state of check runs on GitHub branches, commits, and tags! Thanks to @marcfbe for his contribution! 🙏
Example: img.shields.io/github/check-r…