
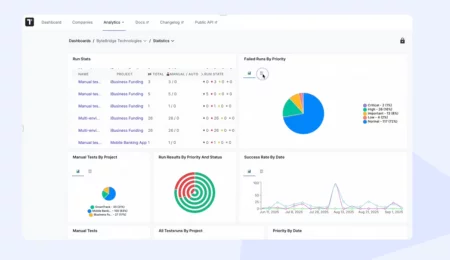
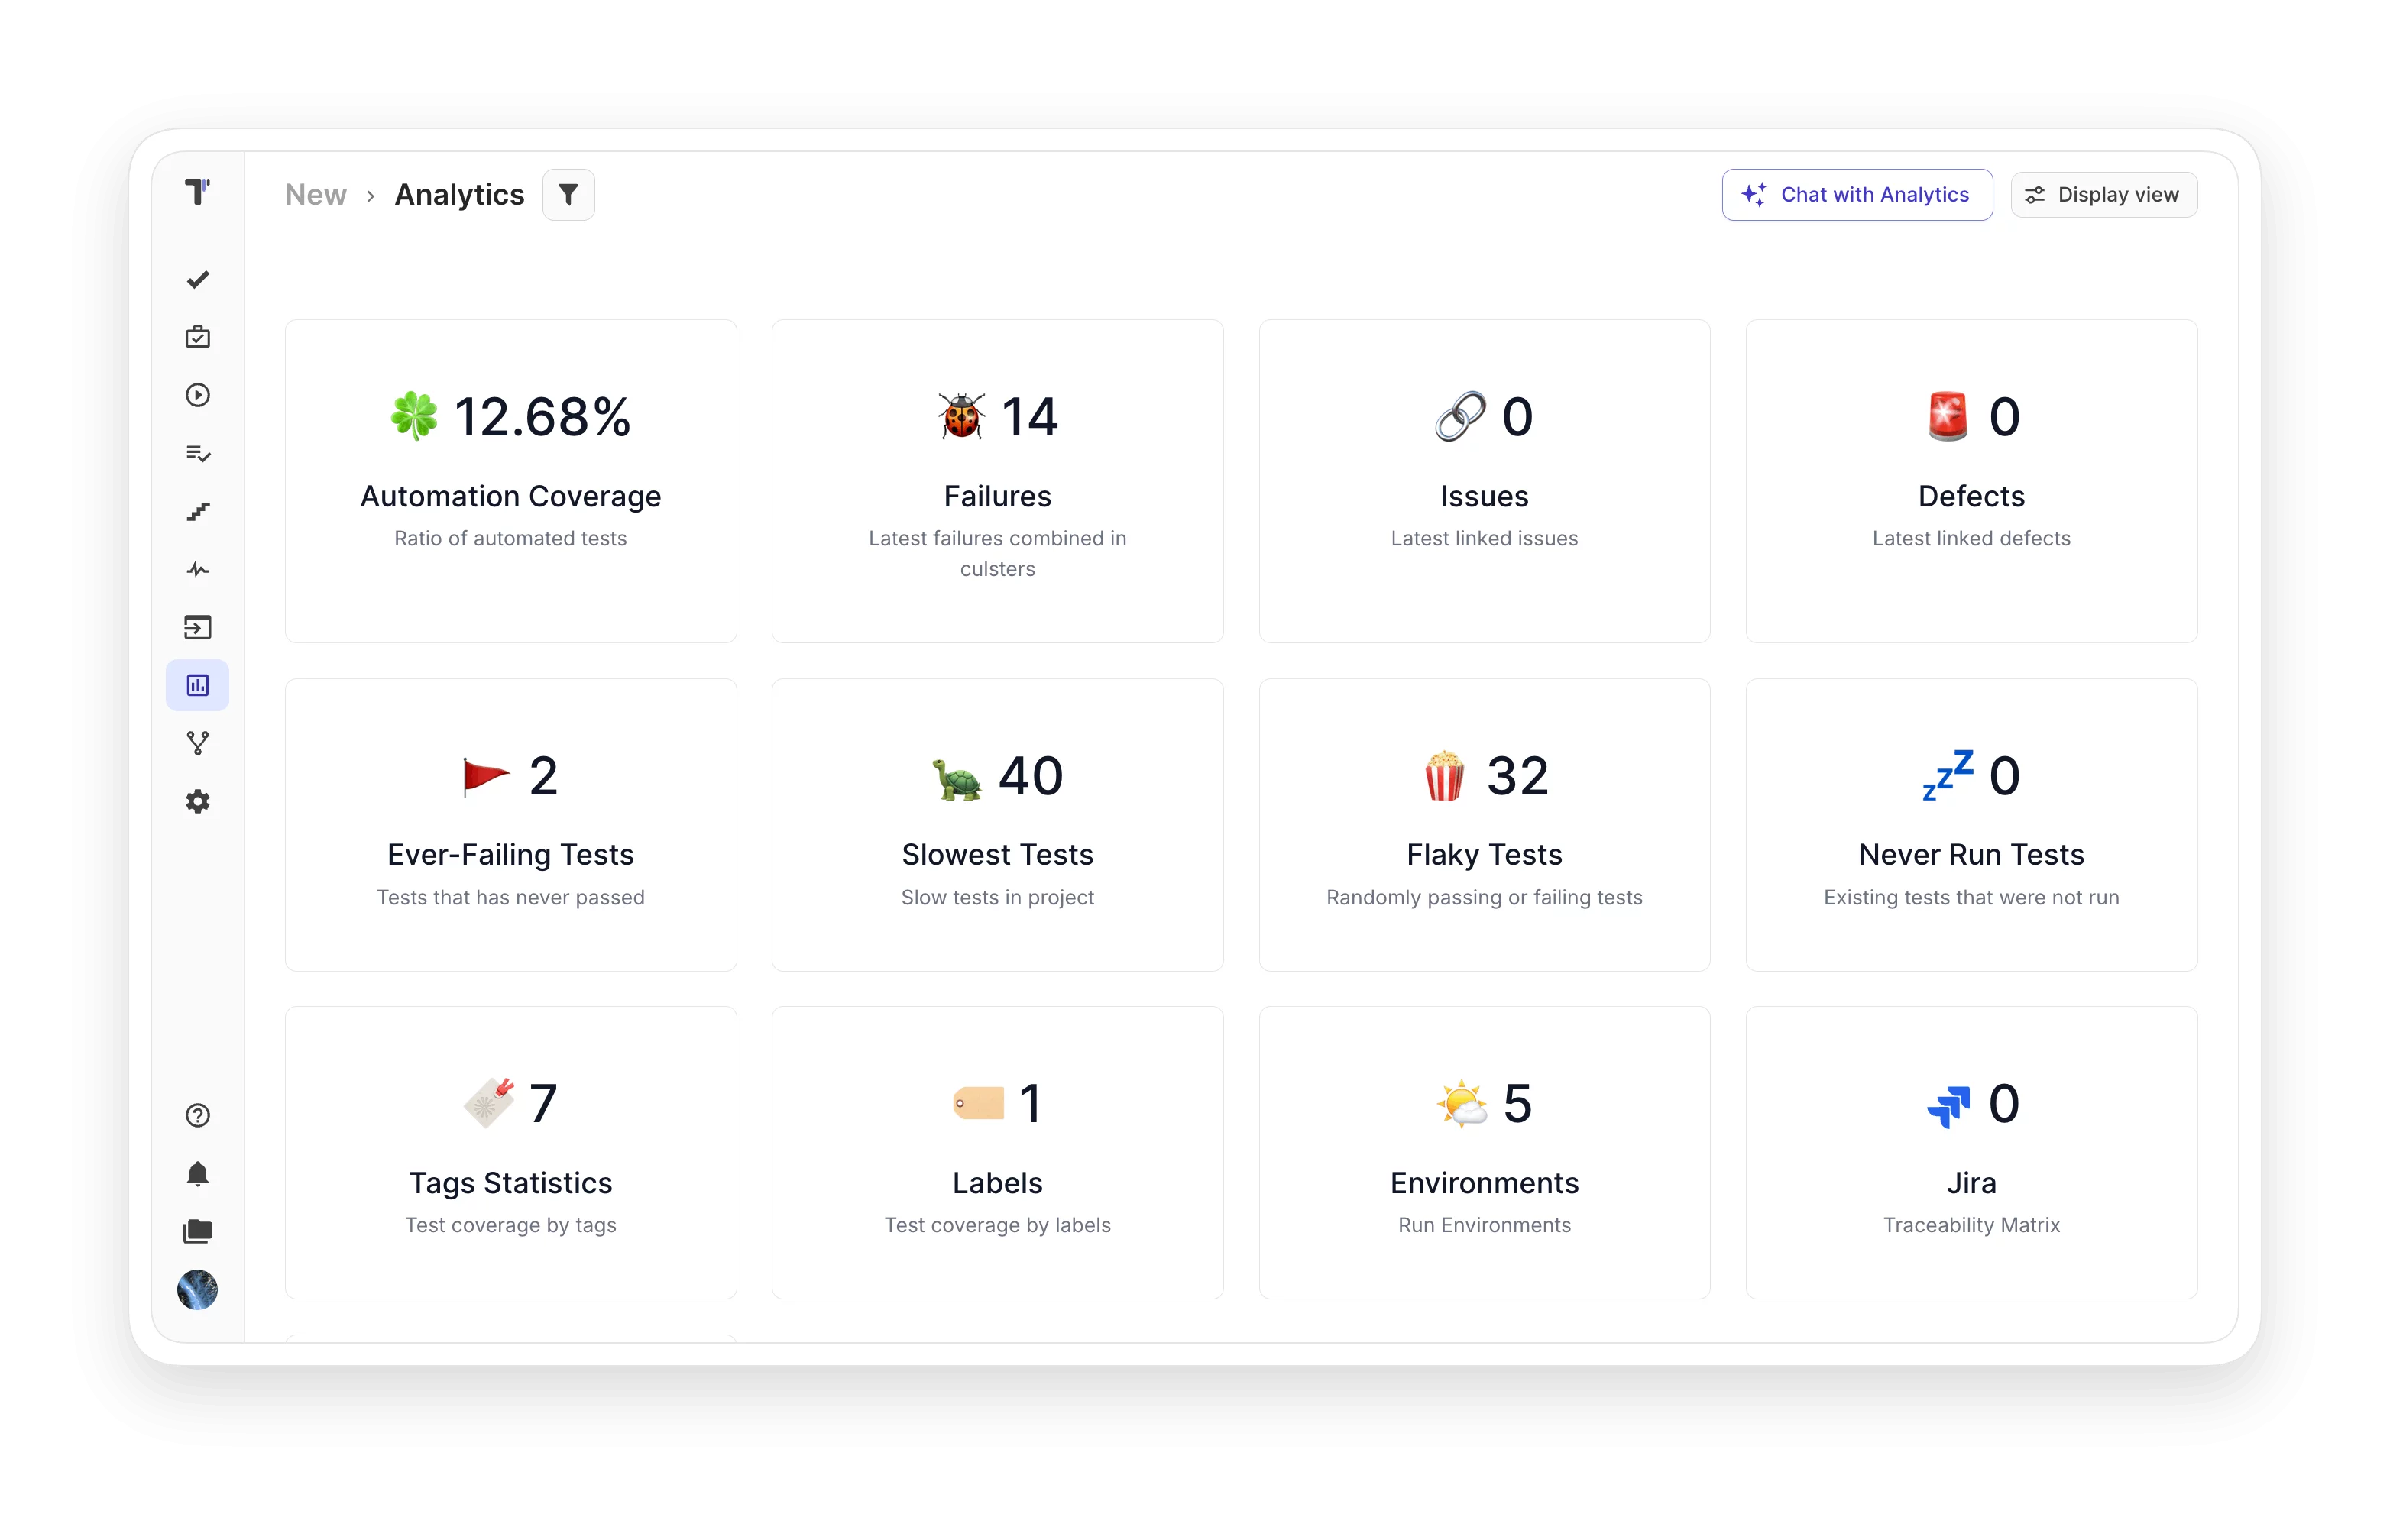
Testing analytics

Make automated tests visible with transparent testing analytics. Track coverage and turn raw run data into clear decisions.
Testing analytics

Benefits of testing analytics

https://testomat.io/wp-content/uploads/2026/06/coverage-visibility.svg
Coverage visibility
See automation progress at a glance.
https://testomat.io/wp-content/uploads/2026/06/defect-insight.svg
Defect insight
Spot defect clusters by date.
https://testomat.io/wp-content/uploads/2026/06/requirement-tracing.svg
Requirement tracing
Connect tests to user stories.
https://testomat.io/wp-content/uploads/2026/06/flaky-detection.svg
Flaky detection
Catch unstable tests automatically.
https://testomat.io/wp-content/uploads/2026/06/company-wide-view.svg
Company-wide view
Compare metrics across all projects.

Testomat.io testing analytics features

Test automation coverage

The automation coverage board displays the percentage of automated tests on the project, so teams can track progress over time.

Learn more
 Test automation   coverage
Defects tracking

The defects board surfaces issues from the latest runs, defect rates, and clustering. Filter results by quantity or by date of occurrence.

Learn more
Defects  tracking
Requirements traceability

Get coverage reports for requirements linked to tests and defects through the advanced Jira plugin. Link tests to user stories directly from Jira.

Learn more
 Requirements  traceability
Flaky tests

Detected flaky tests appear automatically on the widget. Configure flakiness thresholds yourself to decide which tests should be marked unstable.

Learn more
 Flaky   tests
Slowest tests

Make the slowest tests visible by sorting them over a period from a millisecond threshold you define, so you control what counts as slow.

Learn more
Slowest   tests
Never run tests

These metrics measure the scope of imported but unexecuted tests. They reveal how complete and relevant your testing set is for the automation team.

Learn more
Never  run tests
Tags statistics

The Tag Analytics widget shows a heatmap, automation coverage, and run status grouped by tags. These metrics help you track and improve your tests.

Learn more
 Tags   statistics
Aggregated analytics across different projects

The analytics dashboard fetches data from all your projects within a company. Track Flaky tests, Success Rate, Slow Tests, and Automation Coverage globally.

Learn more
 Aggregated analytics  across different projects
Test environment management

Apply environments to manual or automated tests and suites. This metric shows a heatmap, automation coverage, and run status by test environments.

Learn more
Test environment management
Sprints coverage for Jira

Keep track of tests that link to Jira, so you can follow project progress and report it to your stakeholders.

Learn more
Sprints coverage  for Jira
Jira statistics

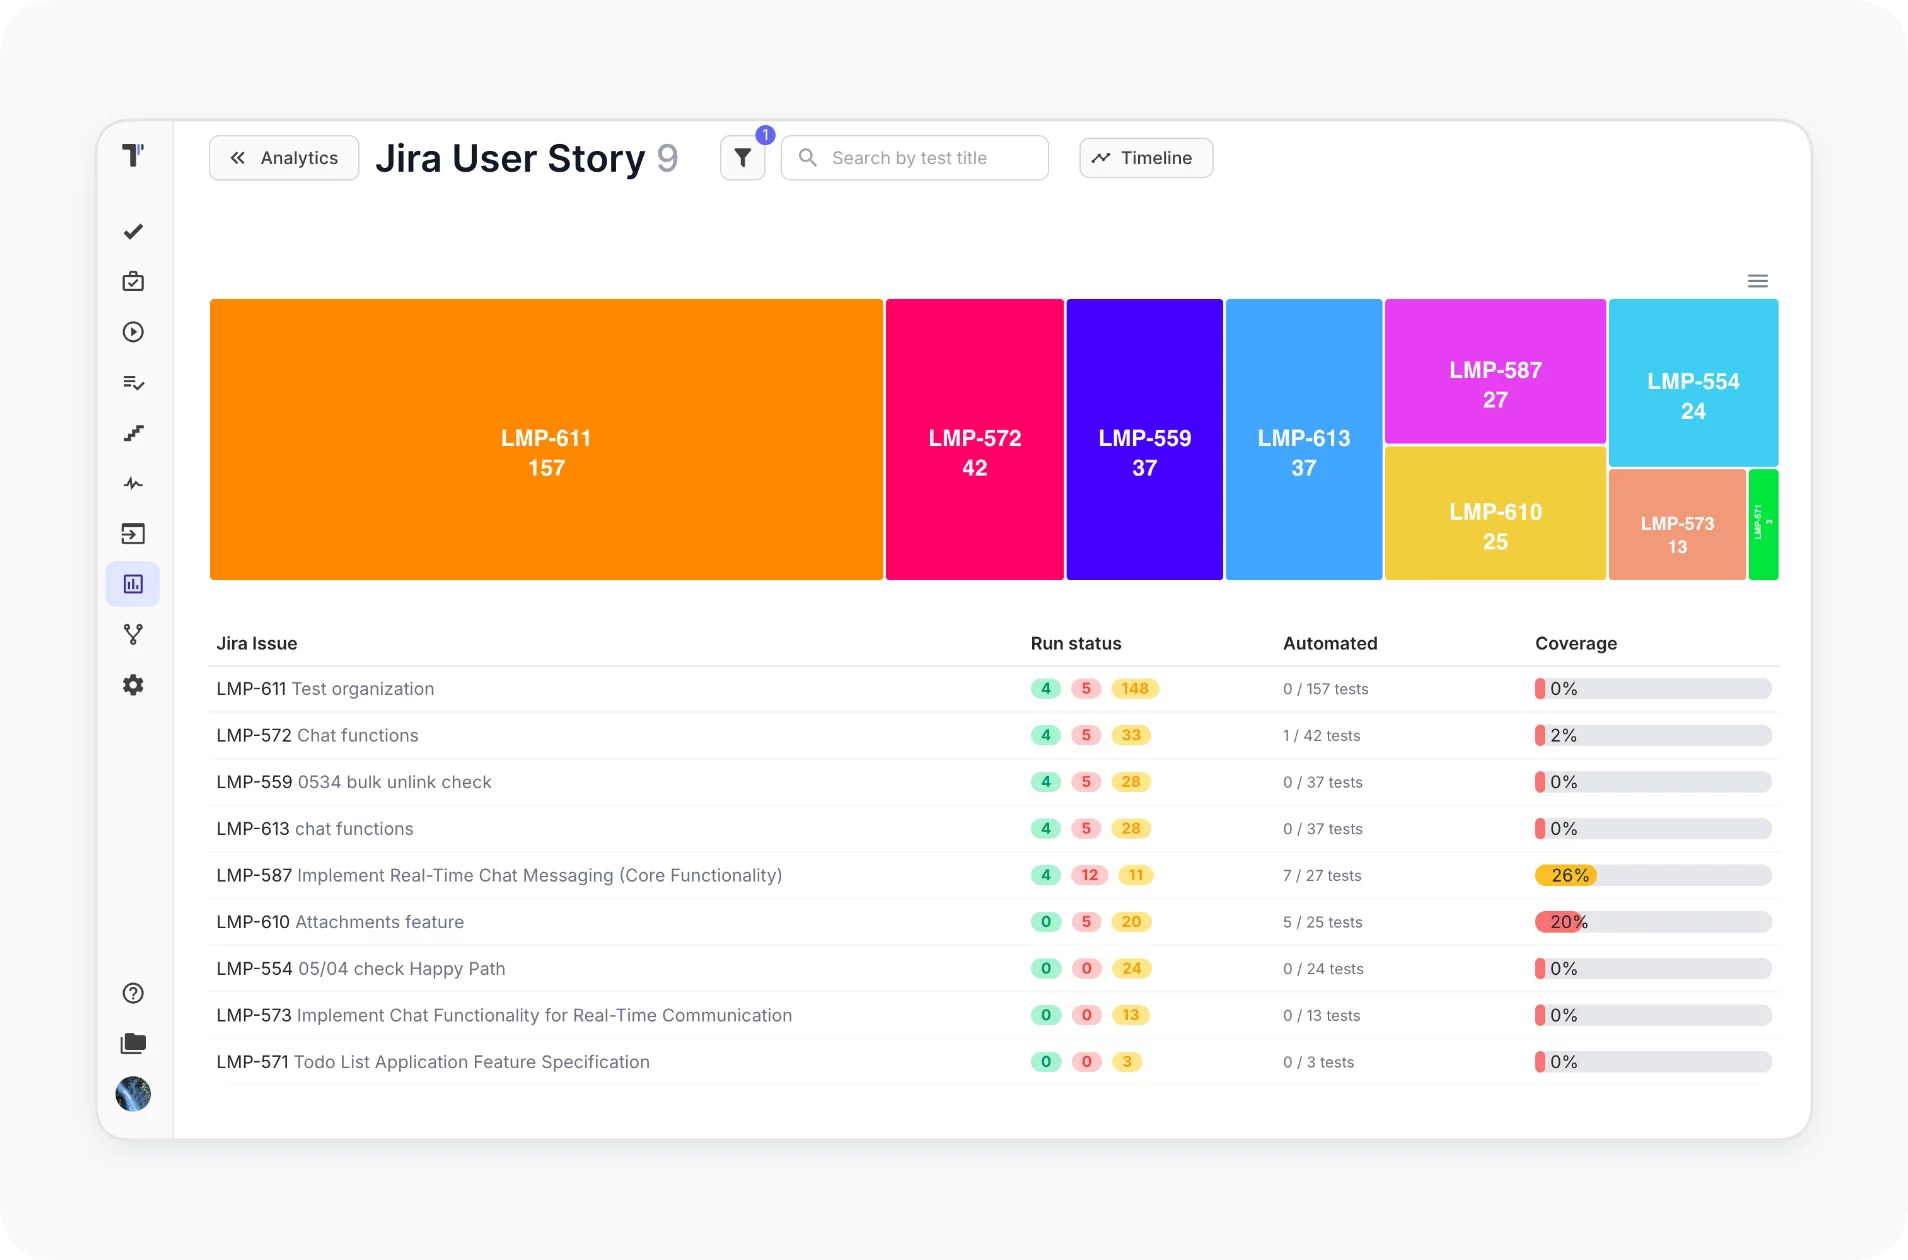
This metric collects information on tests linked to Jira stories through the plugin and displays Automation coverage and Success rate within the Jira project.
Learn more
  Jira  statistics
Compare test runs

Study the summary statistics for any test runs you care about, and draw conclusions on how the project is developing.

Learn more
 Compare  test runs

How testing analytics can help?

Every team gets the same dashboards, but the questions they answer change with project size and structure.
Startups & small teams
Image
Coverage check
See what is automated.
Image
Flaky alerts
Stabilize tests early on.
Image
Run comparison
Track release health over time.
Mid-sized products
Image
Defect clusters
Group issues by area.
Image
Tag heatmaps
Spot weak feature zones.
Image
Environment view
Compare staging vs production.
Enterprise projects
Image
Global analytics
Aggregate data across projects.
Image
Jira statistics
Tie coverage to business goals.
Image
Sprint coverage
Report progress to stakeholders.
What clients says

Recent reviews

“Excellent customer support”
Customer support is always prompt and high-quality. It's also great to see that user feedback is considered when developing new features. The team makes an effort to provide overviews of new features and keeps users informed about the latest updates.
4/5
Aliona Kovalchuk
Aliona Kovalchuk
General QA
“The Best TMS for Our QA Team!”
Our 15-person QA team has used Testomat.io daily for over two years. After comparing tools like TestRail, it stood out in both features and pricing. It’s affordable yet powerful. Jenkins integration works seamlessly, even manual testers can run tests easily. The clean UI speeds onboarding, improves collaboration, and saves time. We’ve recommended it widely, and others love it too.
5/5
Vladyslav M.
Vladyslav M.
General QA
“Testomat.io makes daily testing so much easier”
I’ve used Testomat.io daily for over two years, and it’s the best TMS I’ve worked with. Compared to tools like TestRail, it offers more features at a better price. Jenkins integration is seamless, even for manual testers. The UI is clean and easy to learn. It speeds up workflows, improves transparency, and makes team collaboration much smoother.
5/5
Dmytro H.
Dmytro H.
General QA
“Very convenient platform for managing test cases”
The platform is convenient and intuitive to use. I’ve been using it long enough to say it’s very user-friendly. It’s clear that the team is constantly working on and improving the platform.
5/5
Aleksey K.
Aleksey K.
General QA
“Great tool for creating and managing manual test cases efficiently”
As a Manual QA, I use Testomat.io to create and manage test cases with ease. The interface is intuitive, making onboarding simple. Test plans, runs, and results are well-structured in one place. Tagging helps organize cases efficiently. AI features speed up test creation. It keeps workflows transparent, improves collaboration, and reduces routine work.
5/5
Oksana G.
Oksana G.
General QA
“Testomat.io has been a great tool for managing both automated and manual tests in one place”
I really like how easy it is to integrate with frameworks and CI/CD tools, and the real-time reports with screenshots and analytics save a lot of time. Overall, it makes collaboration in the team much smoother and keeps testing well-organized.
5/5
Aleksey K.
Aleksey K.
Quality Assurance Engineer

Frequently asked questions

What is analytics testing? Testomat

Analytics testing measures test run data, coverage, flakiness, and defect rates to show the health of a test suite. A testing and analytics platform collects these signals in one place so teams track quality trends over time.

What is the best analytics for beta testing? Testomat

For beta testing, the best analytics track defect rates, coverage per feature, and how results shift between builds. Testomat.io compares test runs and aggregates coverage across projects, so you can judge release readiness.

What is data analytics testing? Testomat

Data analytics testing verifies that data pipelines and reports return correct results. That differs from test analytics. Testomat.io focuses on testing analytics: the metrics and trends from your test runs.

How to automate security testing for analytics? Testomat

Security testing runs in a dedicated scanner, not a test management tool. You automate it in CI, then send results to Testomat.io. From there you can integrate analytics with testing tools you already use, viewing security outcomes alongside your other testing analytics.

What is analytics testing in software testing? Testomat

In software testing, analytics testing means analysing results from automated and manual runs to guide decisions. Analytics and testing together show coverage gaps, unstable tests, and where defects cluster, instead of a raw pass/fail count.
Get full visibility into your test results with Testomat.io

Get full visibility into your test results with Testomat.io