📊🧵 Collection of tweets featuring open-access materials that I have shared over the last years:
Talks, seminars, blog posts, hands-on notebooks, codes, and more!
#rstats#ggplot2#tidyverse#dataviz 🧙♂️
🔥🔥 MAJOR UPDATE 🔥🔥
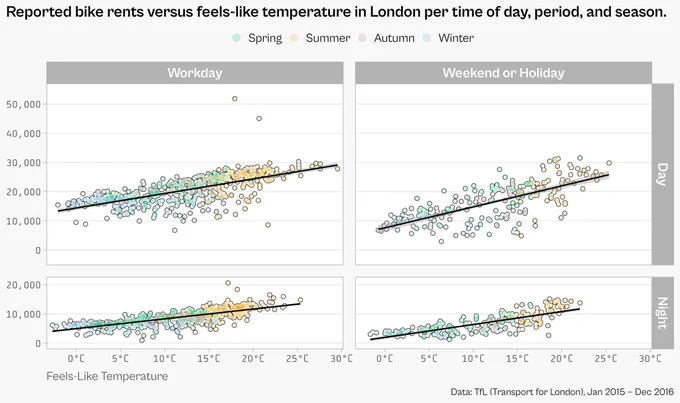
The extended "#ggplot2 Tutorial for Beautiful Plotting in #Rstats" is online 🥳
A ton of new examples such as adding annotations, playing with after_scale, new chart types, modifying legends, interactive #dataviz and many more!
🔗 cedricscherer.netlify.app/2019/08/05/a-g…
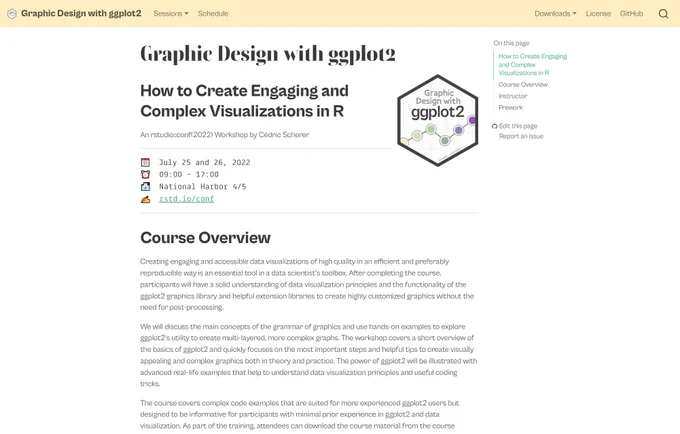
"Graphic Design with #ggplot2" 👨💼👩💻🧑💻
Do you want to recap the 2-day workshop at #rstudioconf? Or do you feel sad you've missed it?
🔥 All course material incl. latest updates can be found on the workshop webpage—9 sessions, 760 slides, 314 ggplots!
👉 rstudio-conf-2022.github.io/ggplot2-graphi…
📢 New blog post!
I finally finished the post on "Visualizing Distributions with Raincloud Plots with #ggplot2" showing why such hybrid charts are a good alternative to boxplots and numerous ways how to create them in #rstats with #ggplot2. #dataviz
🔗 cedricscherer.com/2021/06/06/vis…
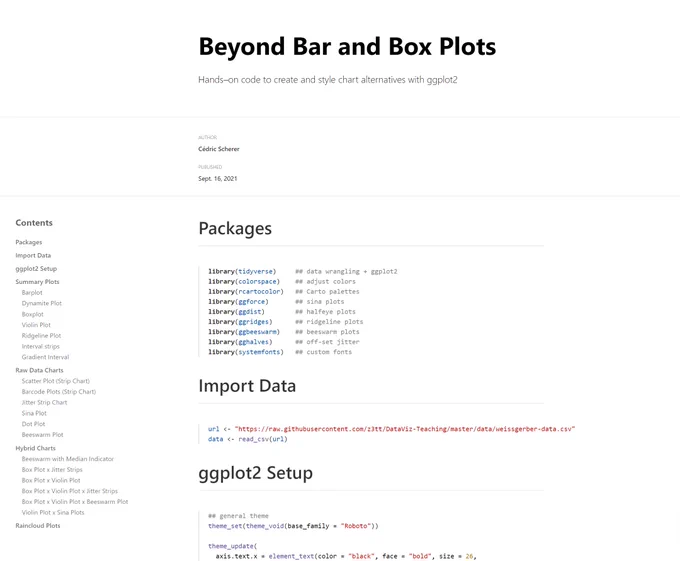
👨💼All materials for yesterday's session at @USGS_CDI on bar and box plot alternatives and how to design them in #rstats with #ggplot2.
🔗 github.com/z3tt/beyond-ba…
➡️ slides of my talk
➡️ notebook and source code to rebuild all the charts
⏳ recording (will be added later)
Yesterday night our second child was born. Everyone is healthy and in good spirits ❤️
Now that there are four of us it might be about time for a bigger bed...
Sorry for my silence as I've been quite absent from all social media thanks to lots of projects and workshops.
Most time went into developing a 5-day course covering all steps of the #DataScience workflow with #rstats#tidyverse#dplyr#ggplot2 + #Quarto—almost 1000 slides! 🙀