1. X
  2. Cédric Scherer
Log inSign up
Cédric Scherer
14.7K posts
Image
user avatar
Cédric Scherer
@CedScherer
Inactive account → find me on BlueSky and LinkedIn 🧙‍♂️✨📊 Independent #DataViz Consultant & Designer 👨‍🎓🌿🐗 PhD in Computational Ecology
Berlin, Germany
cedricscherer.com
Joined March 2015
1,896
Following
24.2K
Followers
RepliesRepliesMediaMedia
Terms·Privacy·Cookies·Accessibility·Ads Info·© 2026 X Corp.
Don't miss what's happening
People on X are the first to know.
Log inSign up

New to X?

Sign up now to get your own personalized timeline!

Create account

By signing up, you agree to the Terms of Service and Privacy Policy, including Cookie Use.

  • Pinned
    user avatar
    Cédric Scherer
    @CedScherer
    Sep 23, 2021
    📊🧵 Collection of tweets featuring open-access materials that I have shared over the last years: Talks, seminars, blog posts, hands-on notebooks, codes, and more! #rstats #ggplot2 #tidyverse #dataviz 🧙‍♂️
    Title slide of my "ggplot Wizardry" talk at Outlier conference 2021.
    Final visualization of my "Evolution of a ggplot2" blog post.
    Overview of plots contained in my "A ggplot2 tutorial for beautiful plotting in R"
    Title slide of my "Beyond Bar and Box Plots: Chart alternatives and how to design them with ggplot2" talk for USGS
  • user avatar
    Cédric Scherer
    @CedScherer
    Dec 2, 2020
    🔥🔥 MAJOR UPDATE 🔥🔥 The extended "#ggplot2 Tutorial for Beautiful Plotting in #Rstats" is online 🥳 A ton of new examples such as adding annotations, playing with after_scale, new chart types, modifying legends, interactive #dataviz and many more! 🔗 cedricscherer.netlify.app/2019/08/05/a-g…
    Image
    Image
    Image
    Image
  • user avatar
    Cédric Scherer
    @CedScherer
    Aug 17, 2022
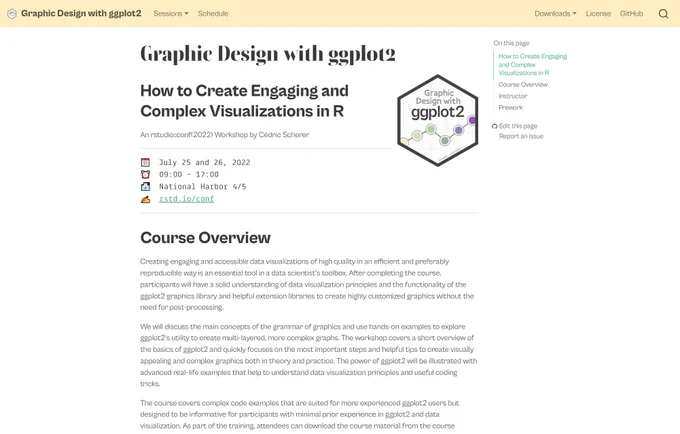
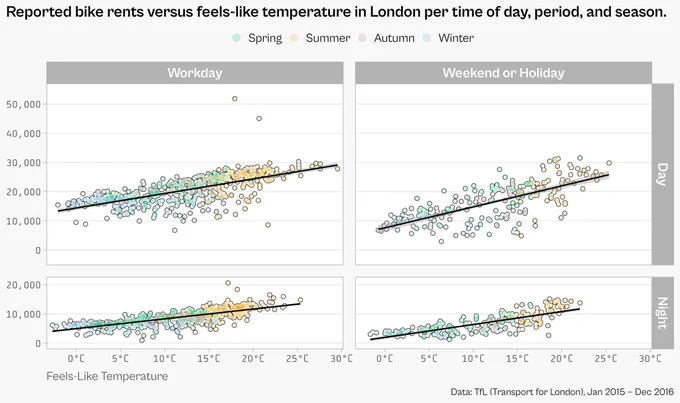
    "Graphic Design with #ggplot2" 👨‍💼👩‍💻🧑‍💻 Do you want to recap the 2-day workshop at #rstudioconf? Or do you feel sad you've missed it? 🔥 All course material incl. latest updates can be found on the workshop webpage—9 sessions, 760 slides, 314 ggplots! 👉 rstudio-conf-2022.github.io/ggplot2-graphi…
    A screenshot of the rstudio::conf(2022) workshop "Graphic Design with ggplot2", available via https://rstudio-conf-2022.github.io/ggplot2-graphic-design/
    A screenshot of the title slide of that workshop.
    The motivational example illustrating the capability of ggplot2 (custom colors, facets, smoothing, theming) and the data set used for the workshop (bike sharing daat from London via TfL)
  • user avatar
    Cédric Scherer
    @CedScherer
    Jun 6, 2021
    📢 New blog post! I finally finished the post on "Visualizing Distributions with Raincloud Plots with #ggplot2" showing why such hybrid charts are a good alternative to boxplots and numerous ways how to create them in #rstats with #ggplot2. #dataviz 🔗 cedricscherer.com/2021/06/06/vis…
    A collection of raincloud plots I created for various occasions.
    A basic raincloud plot, created with the R packages ggplot2 and ggdist.
    Two boxplot charts using the ggbeeswarm and ggforce packages, respectively, to add the raw data points on top.
    A polished raincloud plot using the palmer penguins data set with annotations and an illustration by Allison Horst.
  • user avatar
    Cédric Scherer
    @CedScherer
    Dec 7, 2020
    All 188 plots contained in "A #ggplot2 Tutorial for Beautiful Plotting in #Rstats" 🔖 The full tutorial here: cedricscherer.netlify.app/2019/08/05/a-g… 🛠️ All codes here: cedricscherer.netlify.app/files/ggplot-t…
    Image
  • user avatar
    Cédric Scherer
    @CedScherer
    May 17, 2019
    Friday and don't know what to do? Train your #ggplot2 skills! 📊 My first blog post "The Evolution of a ggplot (Ep. 1)" is online 🎉 cedricscherer.netlify.com/2019/05/17/the… Thanks to @R4DScommunity @rstudio @dataandme for all the neat #rstats tricks! #tidyverse #DataViz #TidyTuesday #R4DS
    Image
    GIF
  • user avatar
    Cédric Scherer
    @CedScherer
    Sep 17, 2021
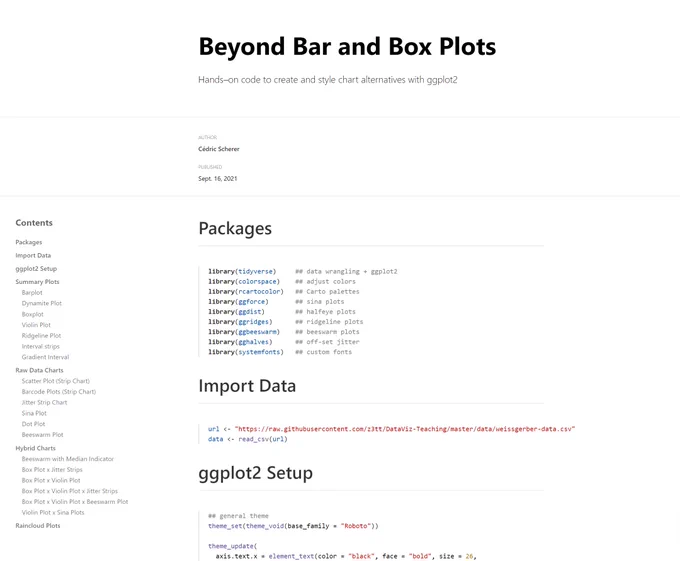
    👨‍💼All materials for yesterday's session at @USGS_CDI on bar and box plot alternatives and how to design them in #rstats with #ggplot2. 🔗 github.com/z3tt/beyond-ba… ➡️ slides of my talk ➡️ notebook and source code to rebuild all the charts ⏳ recording (will be added later)
    Title slide for my talk "Beyond Bars and Box Plots: Chart alternatives and how to design them with ggplot2" at USGS Community for Data Integration.
    A quote by F.J. Anscombe: "...make both calculations and graphs. Both sorts of output should be studied; each will contribute to understanding."
    An example of chart alternatives: an interval strip in combination with a half-violin and a median marker, build with ggplot2.
    A snapshot of the notebook that allows you to rebuild all the chart alternatives shown during the talk.
  • user avatar
    Cédric Scherer
    @CedScherer
    Mar 23, 2021
    The repository now includes the full list of links. github.com/Z3tt/OutlierCo… 📊 Slides: cutt.ly/Yxbo2QY 📺 Recording: cutt.ly/YxboC3n 🖥️ Tutorial: cutt.ly/Gxbpu61 🛠️ Codes: cutt.ly/TxbpcDV #rstats #ggplot2 #dataviz #outlier2021
    Image
    Image
    Image
    Image
  • user avatar
    Cédric Scherer
    @CedScherer
    Sep 16, 2023
    While preparing two new courses for @posit_pbc's #positconf2023 in #Chicago, I've also updated the 2-day #ggplot2 workshop from last year's conf to use the same style 💅 Slides, exercises, solutions, and more—available here 👉 rstudio-conf-2022.github.io/ggplot2-graphi… #rstats #tidyverse #dataviz
    Image
    Graphic Design with ggplot2 - Graphic Design with ggplot2
    From rstudio-conf-2022.github.io
    88K
  • user avatar
    Cédric Scherer
    @CedScherer
    Jul 16, 2021
    how it started: how it’s going:
    Screenshot of the first version of my ggplot2 tutorial that I shared on GitHub more than 4 years ago.
    Screenshot of the front page of the ggplot2 I start writing today.
  • user avatar
    Cédric Scherer
    @CedScherer
    Mar 19, 2022
    Slides for my presentation "Adding value with graphics: Principles of effective data visualization 
and communication" 🧑‍💼at @bib_bund are now available in both, German and English! 🇩🇪 cedricscherer.com/slides/BiB_202… 🇬🇧 cedricscherer.com/slides/BiB_202…
    Title slide with the German title "Mit grafiken Mehrwert schaffen". The image shows a colorful stream graph with mostly blue-cyan colors and a sprinkle of bright orange.
    Slide "Perceiving-Interpreting-Comprehending"

Content:
Gradient from perceiving "what do I see?" to "Interpreting: What does it mean for the subject?" and "Comprehending: WHat does it mean for me?".
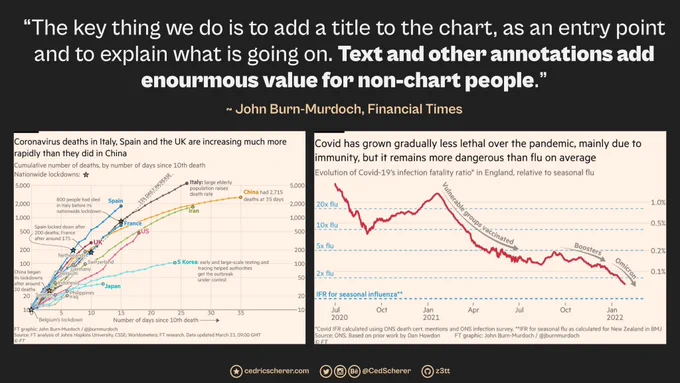
    Two example graphs by John Burn-Murdoch, Financial Times with the quote: “The key thing we do is to add a title to the chart, as an entry point and to explain what is going on. Text and other annotations add enourmous value for non-chart people.”
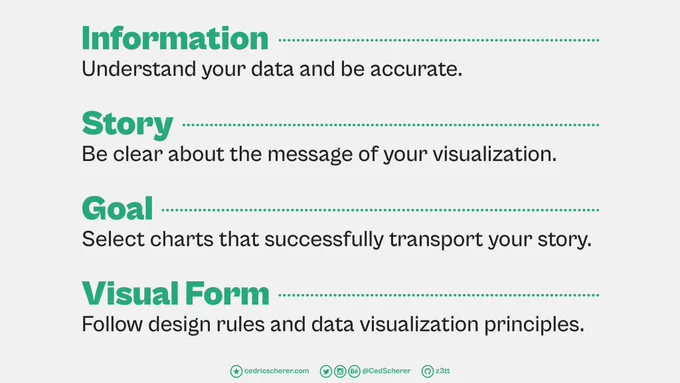
    Summary Slide with the 4 steps: 
- Information: Understand your data and be accurate.
- Story: Be clear about the message of your visualization.
- Goal: Select charts that successfully transport your story.
- Visual Form: Follow design rules and data visualization principles.
  • user avatar
    Cédric Scherer
    @CedScherer
    Jul 10, 2020
    #TidyTuesday Week 2020/28 ☕️ #Coffee Ratings Motivated by the current attention on my boxplot animation, I aimed for an update with bar codes or beeswarms - and ended up using @mjskay's fantastic {ggdist} 📦 once again. #r4ds #rstats #tiyverse #ggplot2 #dataviz #coffeelovers
    Image
  • user avatar
    Cédric Scherer
    @CedScherer
    Apr 14, 2023
    Yesterday night our second child was born. Everyone is healthy and in good spirits ❤️ Now that there are four of us it might be about time for a bigger bed...
    A fun data visualization of "My share of the bed area as the family grows" with tree maps indicating the bed size (90 cm wide until 2012) and two colors indicating my area versus the (subjectively estimated) area taken by my wife and kids. The lower part of the graphic shows a flow diagram indicating the space use per family member for the respective time steps shown as tree maps.
    34K
  • user avatar
    Cédric Scherer
    @CedScherer
    Mar 13, 2023
    Sorry for my silence as I've been quite absent from all social media thanks to lots of projects and workshops. Most time went into developing a 5-day course covering all steps of the #DataScience workflow with #rstats #tidyverse #dplyr #ggplot2 + #Quarto—almost 1000 slides! 🙀
    Image
    GIF
    65K
Advertisement
Advertisement