1. X
  2. St. Louis Fed
Log inSign up
St. Louis Fed
56.1K posts
Image
user avatar
St. Louis Fed
@stlouisfed
Official Federal Reserve Bank of St. Louis account. We share economic data and insights. Home to FRED®, @FedFRASER & @FedHistory
St. Louis, MO
stlouisfed.org
Joined September 2009
37
Following
304.7K
Followers
RepliesRepliesMediaMedia

New to X?

Sign up now to get your own personalized timeline!

Create account

By signing up, you agree to the Terms of Service and Privacy Policy, including Cookie Use.

Terms·Privacy·Cookies·Accessibility·Ads Info·© 2026 X Corp.
Don't miss what's happening
People on X are the first to know.
Log inSign up
  • user avatar
    St. Louis Fed
    @stlouisfed
    Jul 18
    When did former Fed Chairman Alan Greenspan coin the term “irrational exuberance”? You can find the 1996 speech in which he first used the term in FRASER, our digital library of economic and Fed history. The latest In Focus: News and Notes from the St. Louis Fed highlights
    Dark blue background with text: "In Focus: News and Notes from the St. Louis Fed."
    4.6K04.6K
  • user avatar
    St. Louis Fed
    @stlouisfed
    Jul 17
    From last May to this May, U.S. manufacturing employment decreased by 0.4%. This may seem small, but a nationwide figure can hide considerable variation across the country. Visit the FRED Blog to see data for every U.S. state plus the District of Columbia bit.ly/3RHddBE
    Image
    4.8K04.8K
  • user avatar
    St. Louis Fed
    @stlouisfed
    Jul 17
    How Are “Disconnected” Young Adults Spending Their Time? A substantial share of 18- to 24-year-olds are neither employed nor enrolled in school. A new analysis examines why labor market strength may not help everyone in the same way:
    Image
    How Are 'Disconnected' Young Adults Spending Their Time? | St. Louis Fed
    From stlouisfed.org
    4.3K04.3K
  • user avatar
    St. Louis Fed
    @stlouisfed
    Jul 17
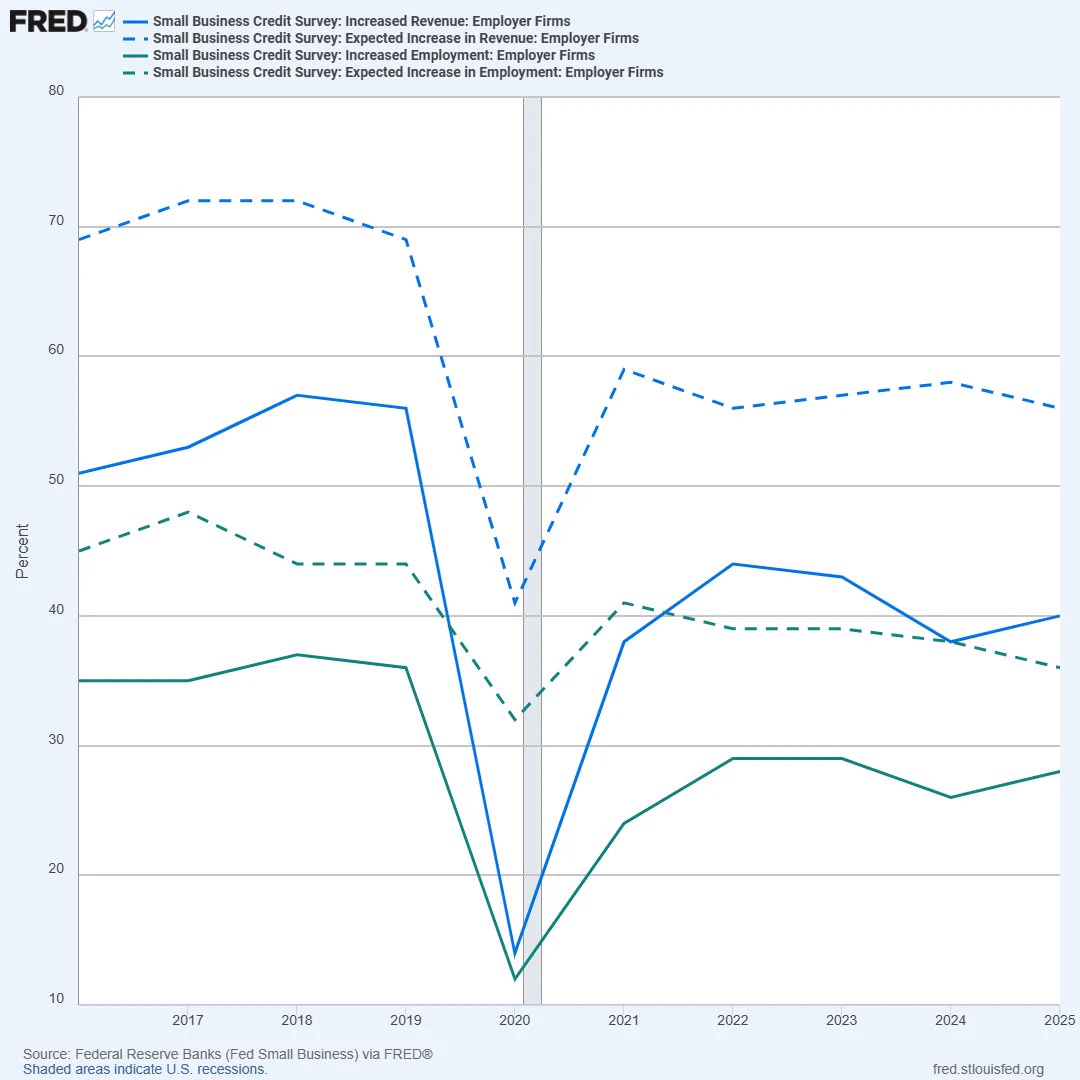
    What’s new in FRED? Find out in the latest In Focus: News and Notes from the St. Louis Fed, along with how vintage companion ALFRED can help you compare different methods to collect data, track updates, improve data accuracy, and more bit.ly/3TlFfmI
    A line chart showing four metrics from the Small Business Credit Survey tracking employer firms from 2016 to 2025. The chart displays both actual (solid lines) and expected (dashed lines) percentages for revenue and employment increases.
    3.8K03.8K
  • user avatar
    St. Louis Fed
    @stlouisfed
    Jul 17
    Can a personal consumption expenditures (PCE) price index that excludes only energy goods provide a better measure of underlying inflationary pressures than core PCE? See the analysis: bit.ly/4hfg8fe
    Image
    00:00
    4.6K04.6K
  • user avatar
    St. Louis Fed
    @stlouisfed
    Jul 17
    Elizabeth Kepner of @ChicagoFed joins the St. Louis Fed’s @MatuschkaLindo and Charles Gascon to discuss economic conditions across the Eighth District and the rest of the nation. Listen to the latest Beige Book podcast bit.ly/4fFAgpC
    Image
    3.9K03.9K
  • user avatar
    St. Louis Fed
    @stlouisfed
    Jul 17
    Economists often use inflation measures that exclude volatile food and energy prices to get a better sense of underlying price pressures. Is there a better method? bit.ly/4hfg8fe
    Image
    3.7K03.7K
  • user avatar
    St. Louis Fed
    @stlouisfed
    Jul 17
    From a low of -1.6% in South Dakota to a high of +4.5% in Washington, the FRED Blog maps first-quarter economic growth data for all 50 states bit.ly/4bpdTlP
    Image
    3.2K03.2K
  • user avatar
    St. Louis Fed
    @stlouisfed
    Jul 17
    In the week ending July 11, seasonally adjusted initial claims for unemployment insurance benefits—those filed for the first time after a job loss—fell by 8,000, to 208,000. The four-week moving average ticked down by 4,750, to 214,250 bit.ly/4yxgPHd
    Image
    3.3K03.3K
  • user avatar
    St. Louis Fed
    @stlouisfed
    Jul 17
    U.S. commercial paper outstanding—reflecting short-term promissory notes issued mostly by corporations—decreased in the week ending July 15, by $6.6 billion to $1.39 trillion bit.ly/4pst7wi
    Image
    3.8K03.8K
  • user avatar
    St. Louis Fed
    @stlouisfed
    Jul 17
    U.S. retail and food services sales ticked up 0.2% in June following a revised gain of 1.0% in May. See the latest results alongside initial data from @uscensusbureau in archival database ALFRED: bit.ly/4wNPnDj
    Image
    3.3K03.3K
  • user avatar
    St. Louis Fed
    @stlouisfed
    Jul 16
    U.S. manufacturing employment is down, but each state has its own story. Check the FRED Blog for the data and discussion bit.ly/3RHddBE
    Image
    6.3K06.3K
  • user avatar
    St. Louis Fed
    @stlouisfed
    Jul 16
    Thank you to @jasonfurman, the Aetna Professor of the Practice of Economic Policy at the @Harvard University @Kennedy_School, for delivering this year’s Homer Jones Memorial Lecture. Furman explored why consumer sentiment remains low despite strong economic fundamentals, and
    Image
    Image
    Image
    4.5K04.5K
    user avatar
    St. Louis Fed
    @stlouisfed
    Jul 16
    View videos and slides from the lecture:
    Image
    2026 Homer Jones Memorial Lecture
    From stlouisfed.org
    1.8K01.8K
  • user avatar
    St. Louis Fed
    @stlouisfed
    Jul 16
    New research by St. Louis Fed economist Fernando Martin (@martinbcra) suggests policymakers could improve their read on inflation trends by excluding only specific energy products, like gasoline. • To avoid misgauging inflation, policymakers use alternative price indexes that
    Image
    00:00
    9.1K09.1K
Advertisement
Advertisement