Pinned
COVID-19 Actuaries Response Group
3,868 posts


COVID-19 Actuaries Response Group
@COVID19actuary
Continuing to share regular data and analysis on excess mortality and hospital admissions with Covid-19. Run by volunteers.
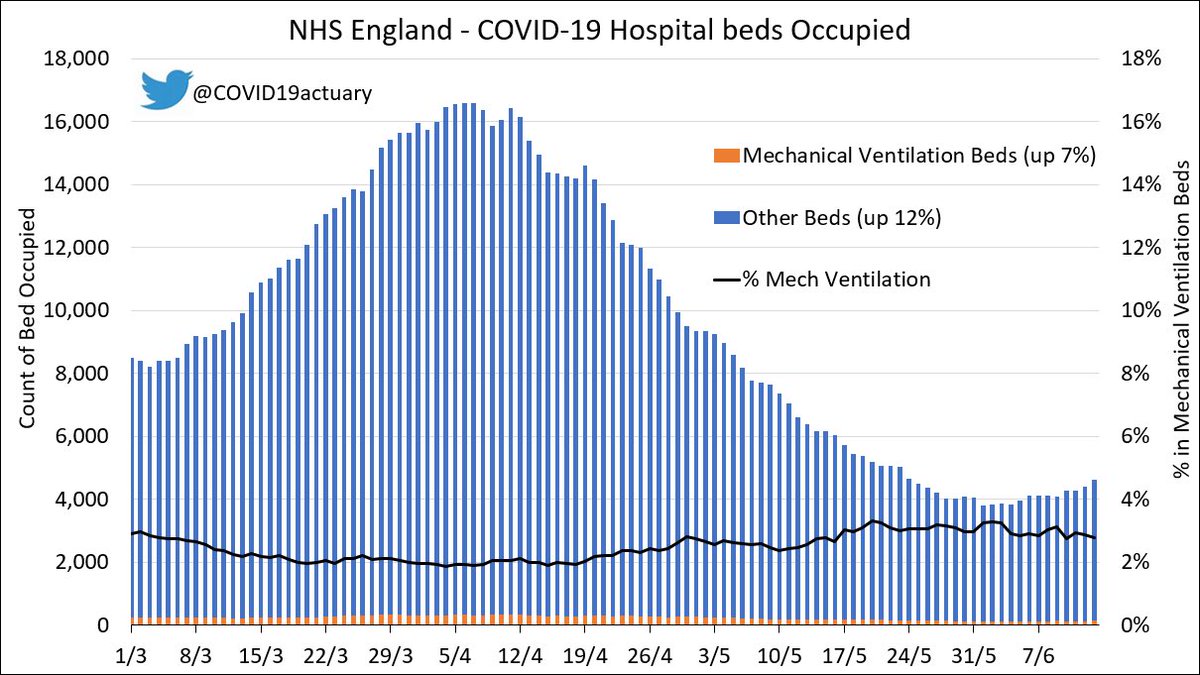
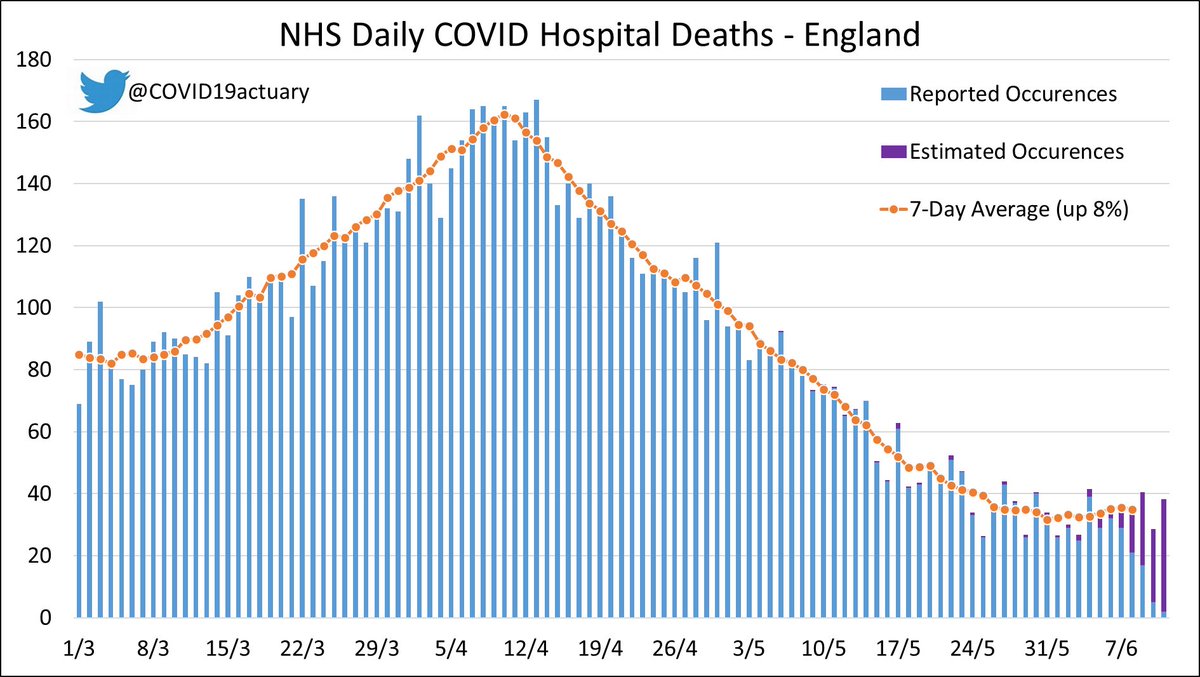
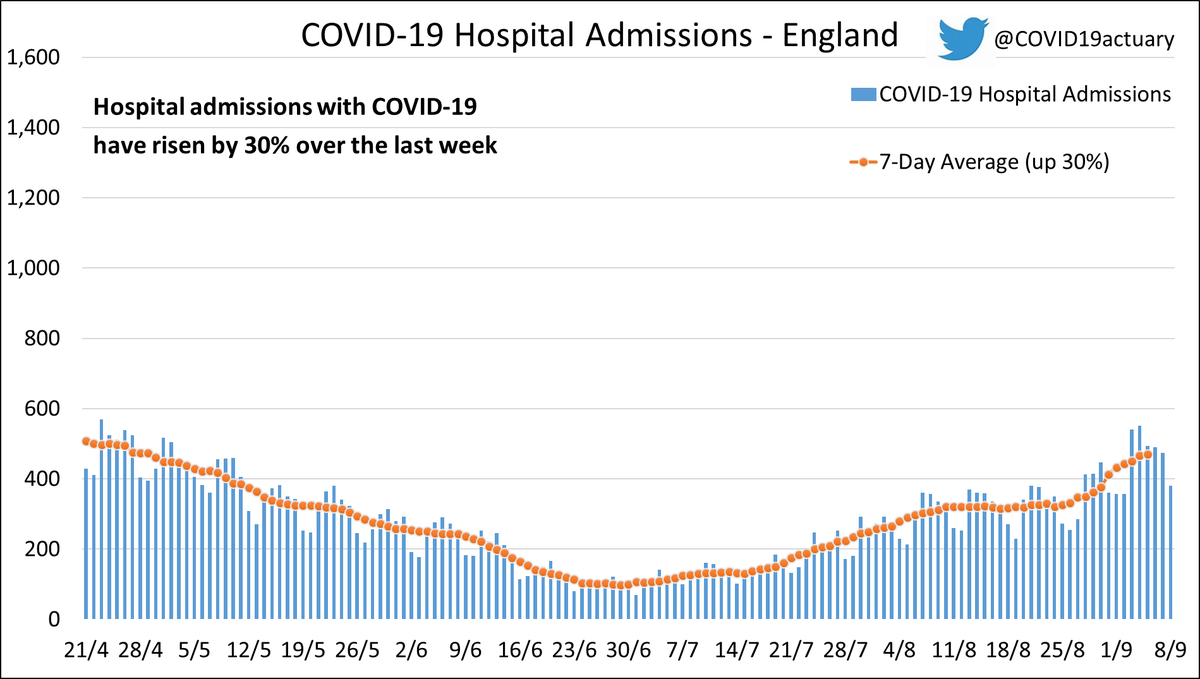
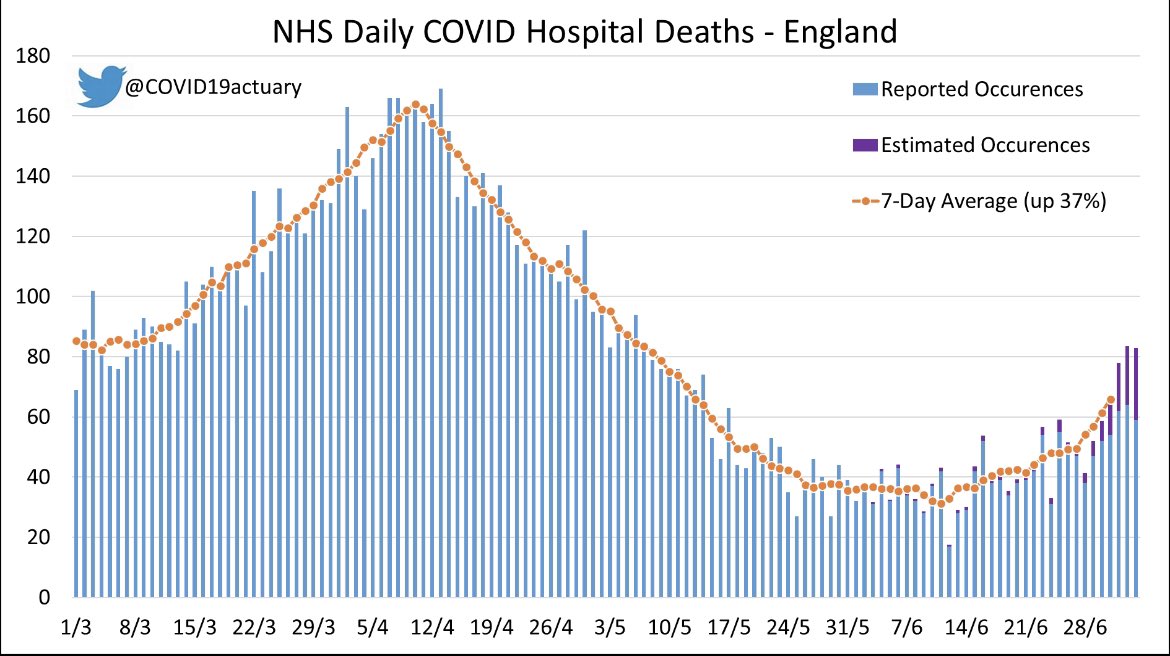
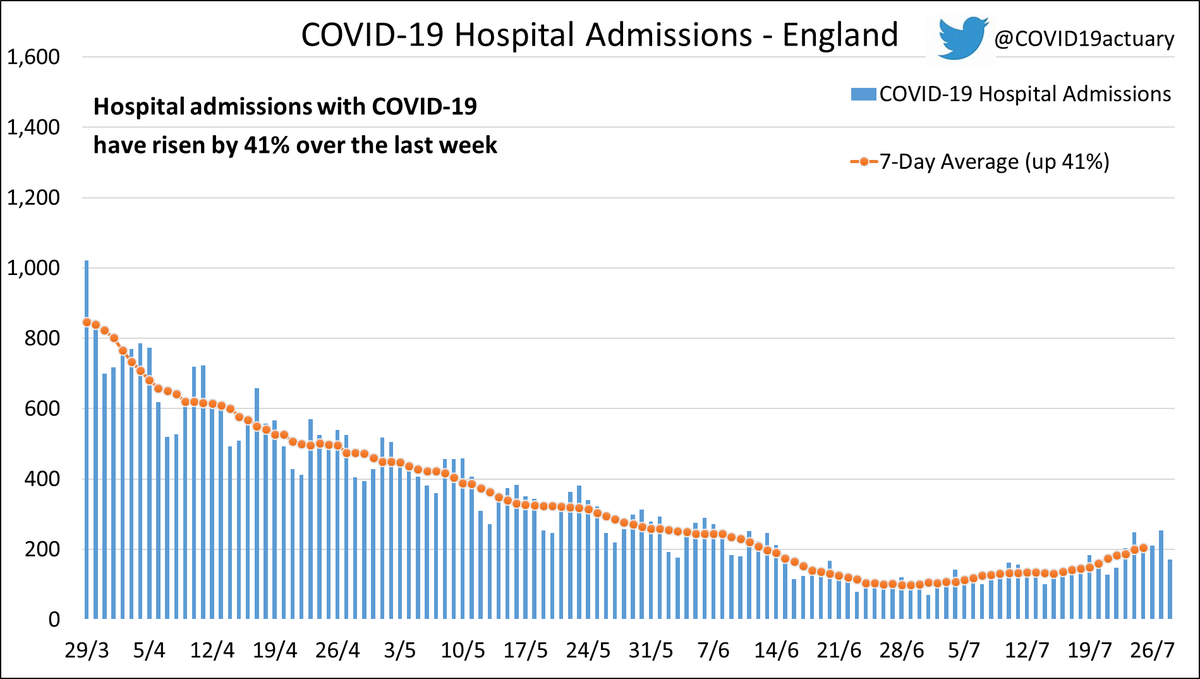
 Hospital admissions with COVID are rising sharply across England, up 33% week-on-week. Admissions rose by between 23% and 50% in all English regions. Bed occupancy is up by 12%. Hospital deaths with COVID are no longer falling. Our estimate suggests deaths rose by 8% this week.
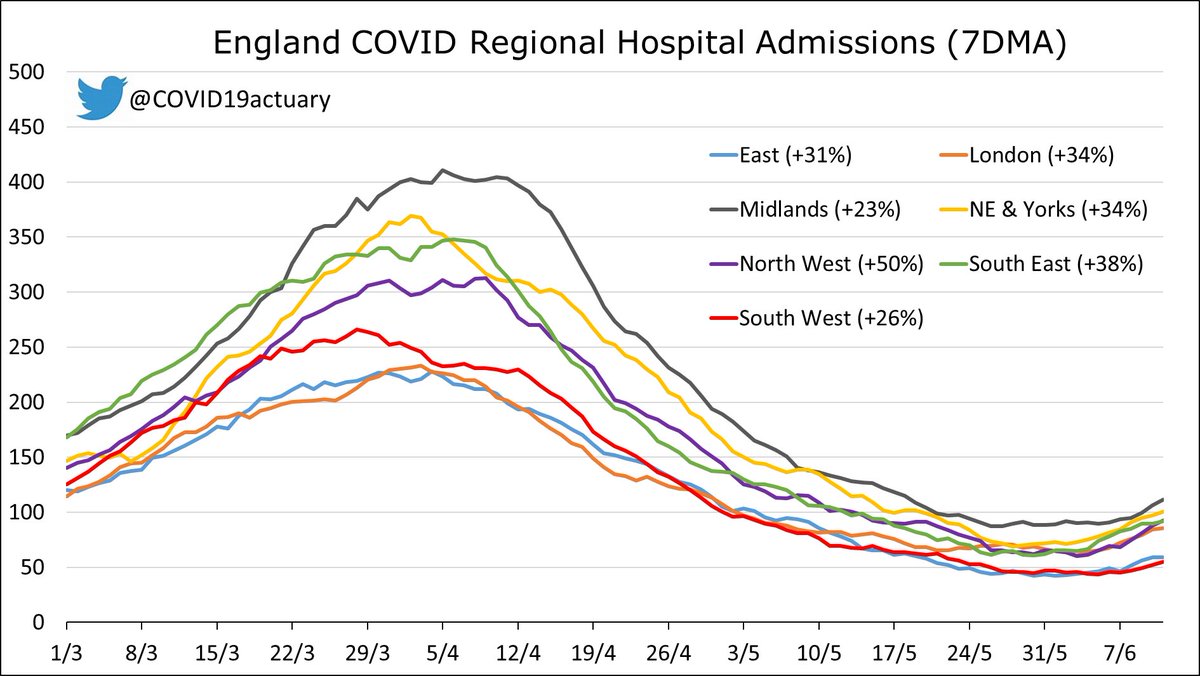
- No doubt now about the trajectory of hospital admissions with COVID. Up 16% in the last week. Daily numbers remain low but as always it is important to focus on the direction of travel. Regional detail below. 1/2

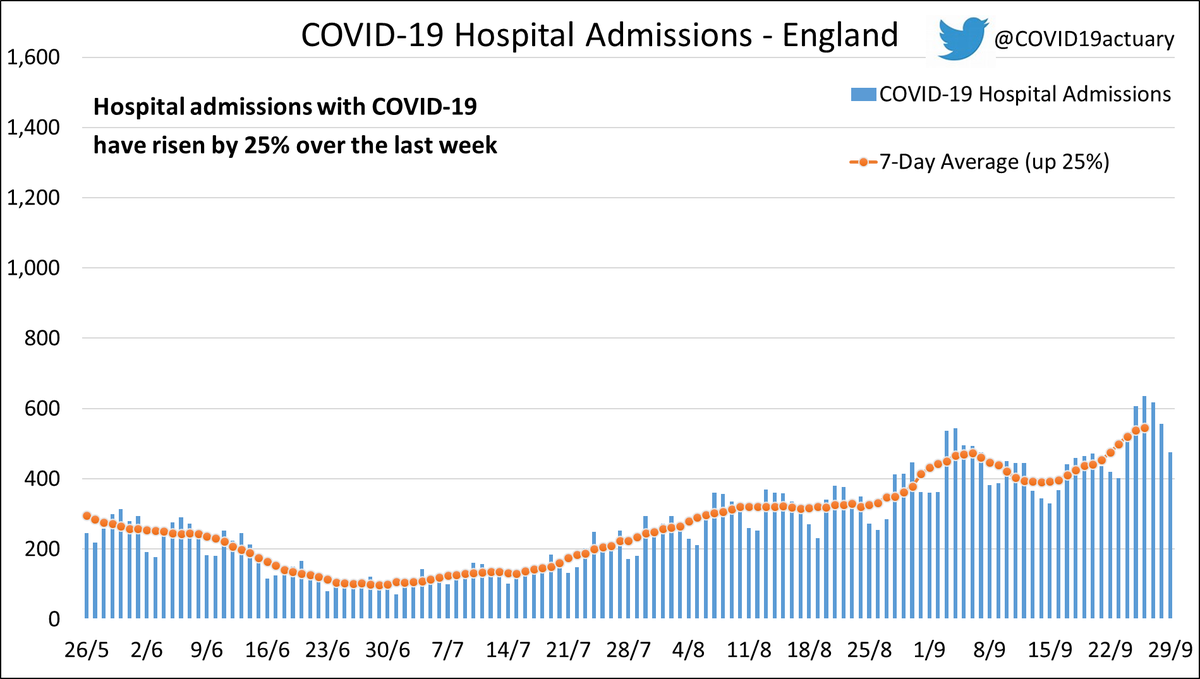
- Hospital admissions with COVID have risen sharply! 7-day average for England up 48%. Implied R estimate above 1.2. The highest we’ve seen in 2022. Regionally, the biggest increases are in SE (up 64%) and Mids (up 58%) but big increases everywhere. Bed occupancy is up by 37%.


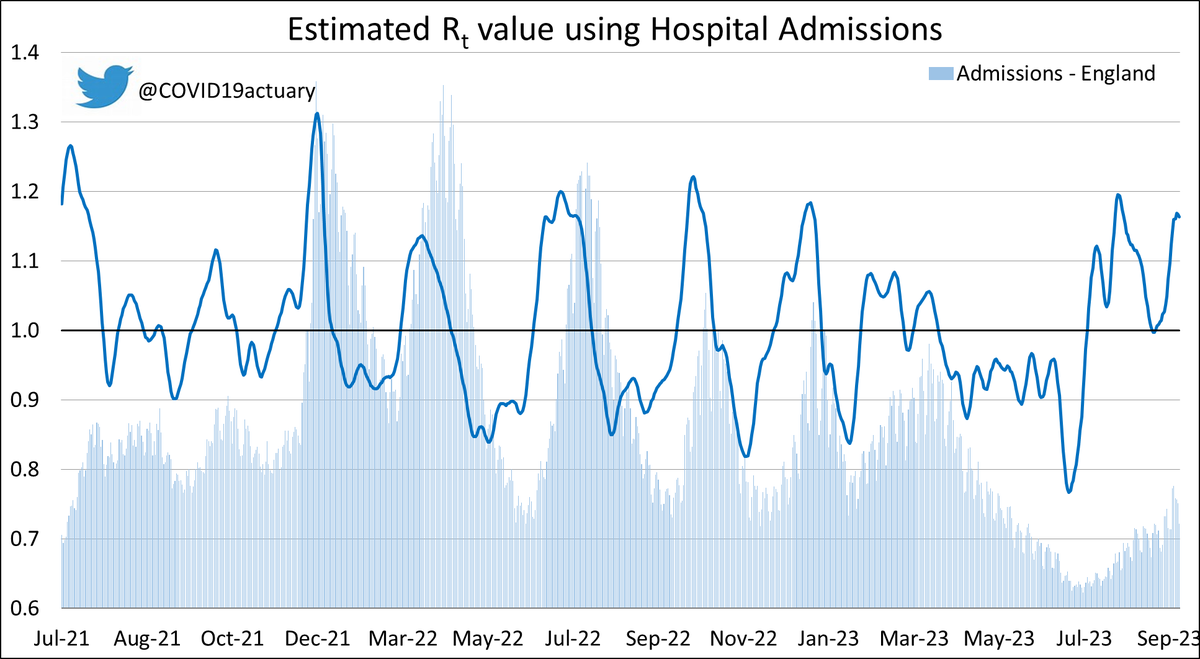
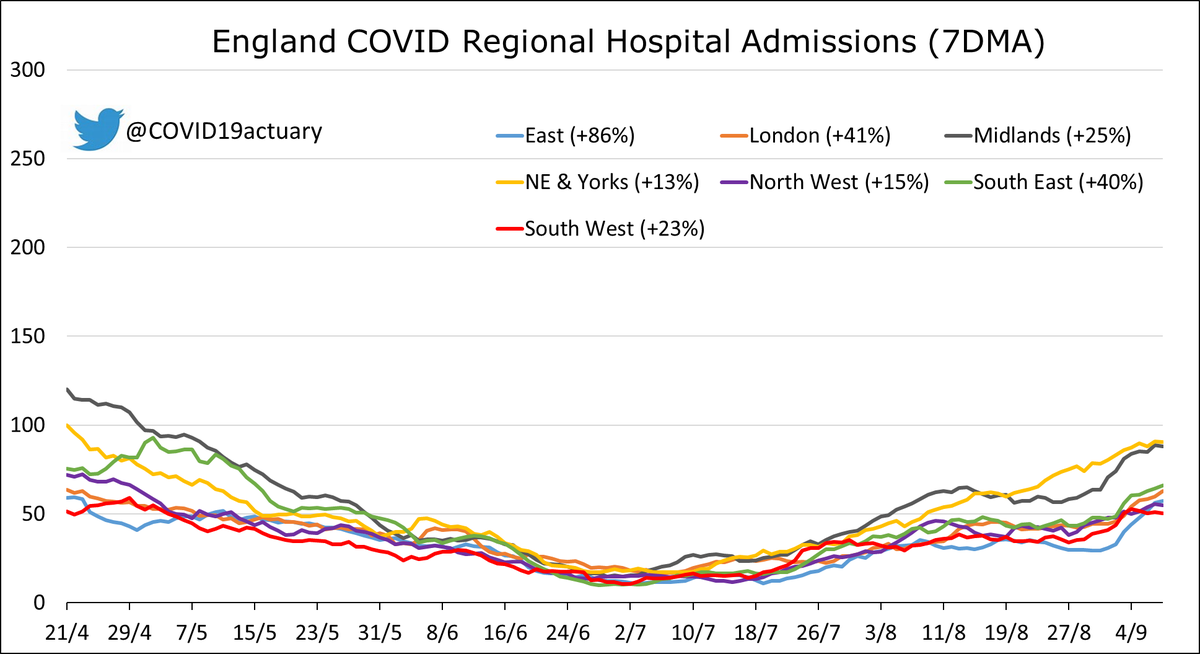
- Hospital admissions with COVID in England increased by 30% in-week. Our R-value risen to 1.16. Admissions rose in all English regions. The largest increase was 86% in the East followed by London (+41%). Acute bed occupancy increased by 15%.

- ONS have today updated their analysis of mortality rates in England based on vaccination status. Key result is that whether we consider all-cause deaths or deaths with COVID, the age-standardised mortality rate is higher for unvaccinated people. Chart 1 - All causes of death.

- We have analysed the difference between ONS and PHE reported deaths from COVID-19 as part of our latest bulletin, released today. We reiterate that excess deaths is the most reliable way to measure the pandemic’s impact. Over 60,000 excess deaths have occurred to date in the UK

- Update on COVID hospital admissions and deaths in England. Admissions are rising sharply again with a big jump today to 283. This takes the daily average to 227 - that’s three time as many as in mid May and currently accelerating. 1/2

- Latest data on COVID-19 hospital admissions and occupancy in England shows a significant increase in admissions nationally, up 54% week-on-week. 1,751 admissions were reported today. Most of the charts that follow have been rescaled significantly in light of the latest data. 1/5

- Deaths with COVID in English hospitals are now updated weekly on Thursdays. Todays update suggests that deaths are rising sharply. Adjusting recent days based on historical reporting delays suggests a 37% increase week-on-week.
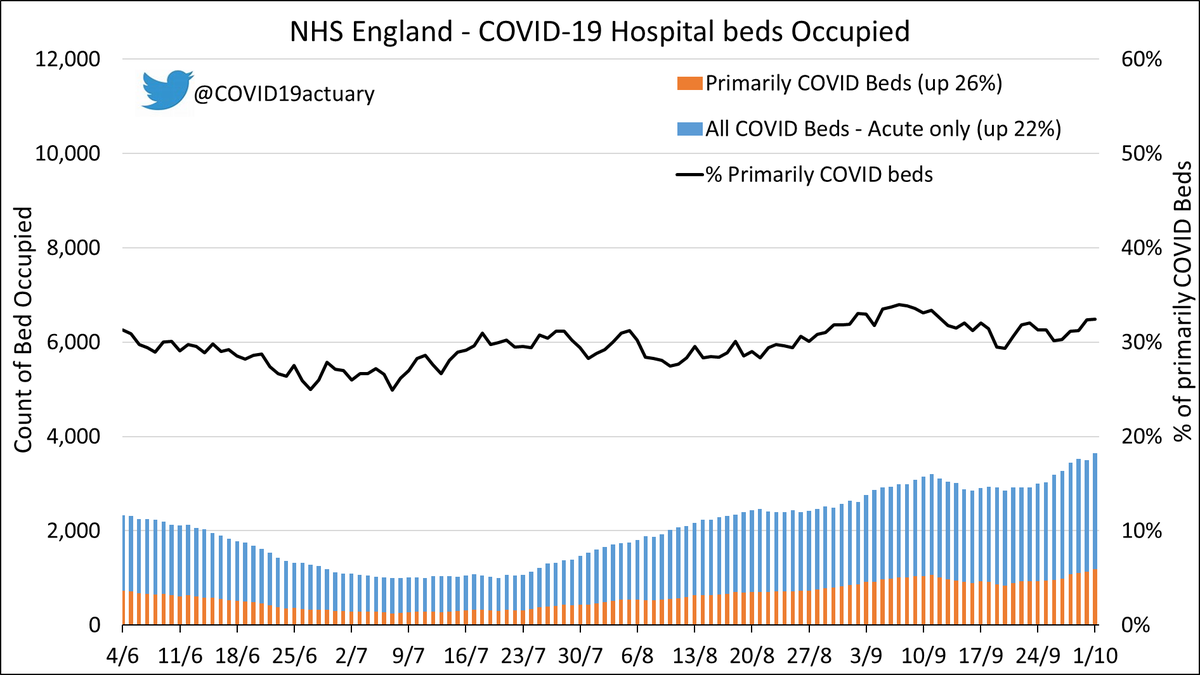
- Hospital admissions with COVID in England increased sharply, up 41% in-week. Our R estimate increased to 1.20. Admissions slightly fell in London (-4%), but rose in all other English regions. The largest increase was 82% in the South East. Acute bed occupancy increased by 43%.
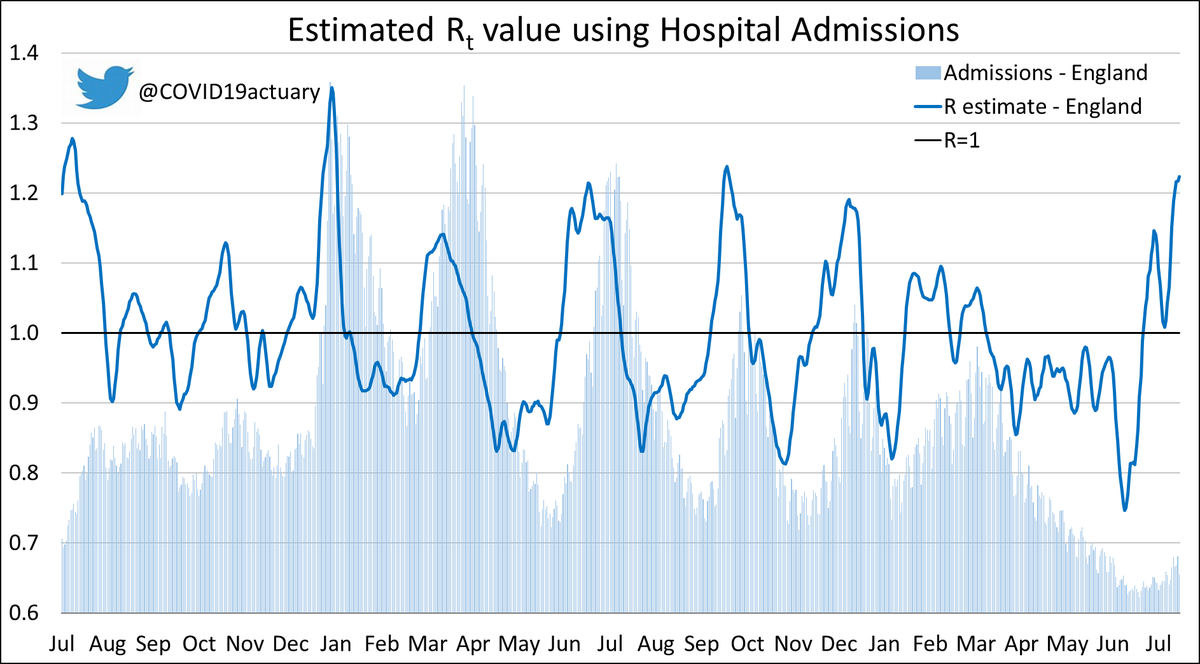


- Hospital admissions with COVID in England increased by 25% in-week. Our R-value has risen to 1.14. Admissions slightly fell in London (-8%) but rose elsewhere. Biggest increases in the South East (+51%) and North West (+37%). Acute bed occupancy is up by 22%.


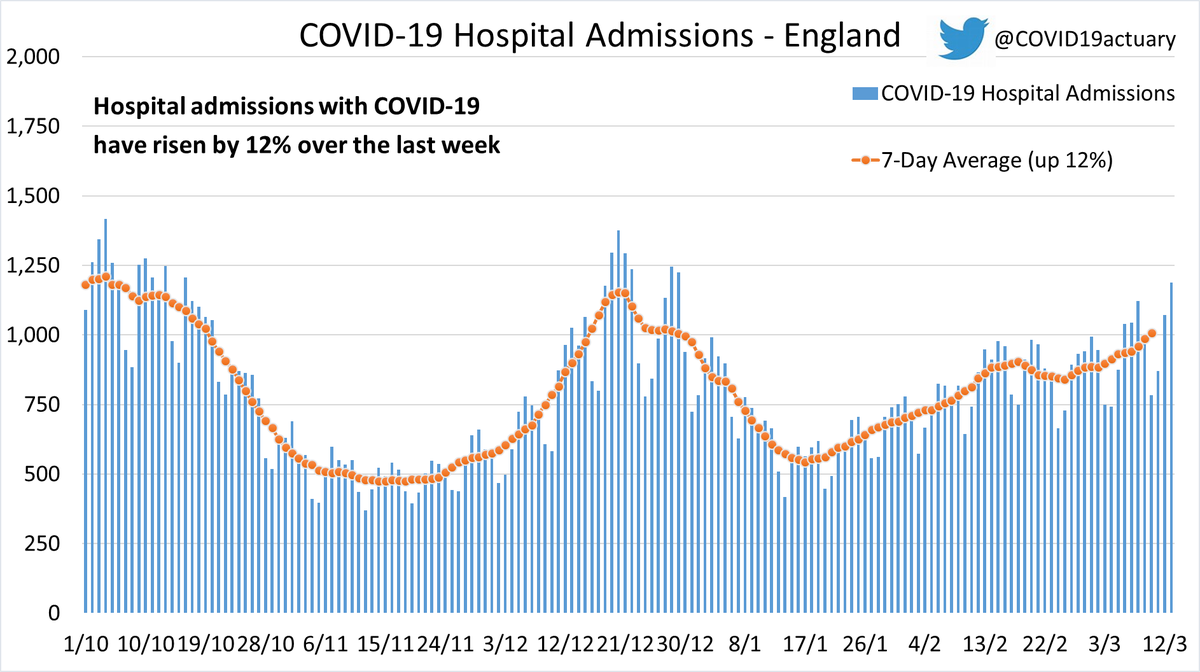
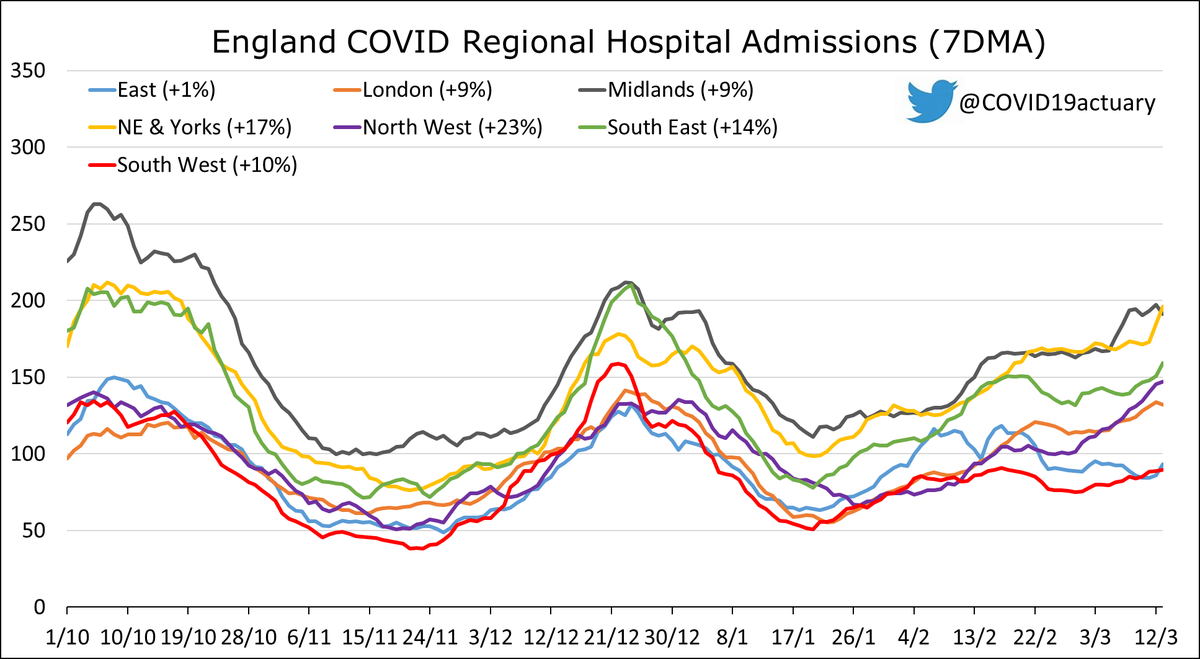
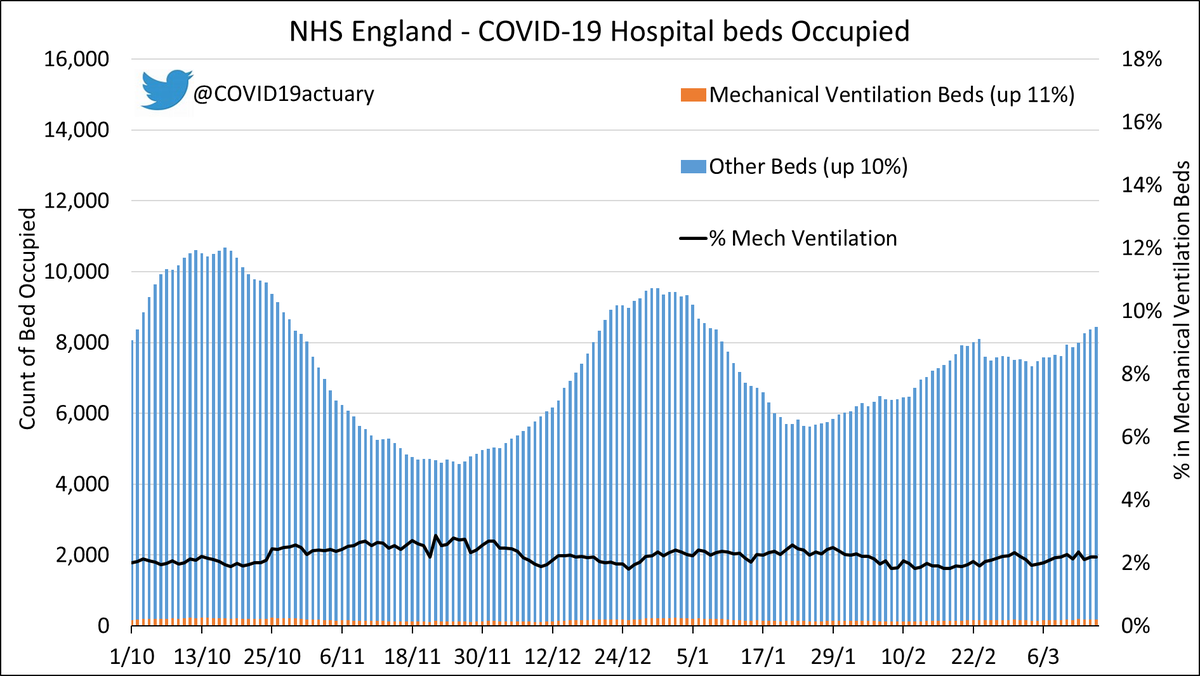
- Hospital admissions with COVID in England have risen by 12% in-week. Our R estimate has risen to 1.06. Admissions rose in every English region. The largest increase was 23% in the North West. Bed occupancy has risen by 10%.

- A further update on hospitals in England with one more day of data. Over 2,000 admissions today - still ahead of @cmmid_lshtm modelling. Almost a vertical rise in NE&Yorks, up 91%. Occupancy up 68% and over 11,000 but still little increase in mechanical ventilation beds.


