🚀 Supercharge your YouTube channel's growth with AI.
Try YTGrowAI FreePython tabulate module: How to Easily Create Tables in Python?


Print a nested list and you get a wall of brackets that nobody can scan. I rendered the same student marks through tabulate 0.10.0 on Python 3.11.16 this morning, knob by knob, and every table below sits next to the exact call that produced it.
One function turns rows into readable text, while a handful of options control headers, borders, indexes, and number formats. You will go from install to styled tables in minutes, and learn where tabulate stops helping.
Printed Lists Are Unreadable and Tabulate Fixes That
Debugging data means printing it, yet raw lists punish your eyes with commas and quotes. Sequential prints of nested data defeat the purpose of looking, which is why readers keep asking for pretty terminal tables.
Tabulate takes rows and returns aligned text with no dataframe library required, and I confirmed everything against the installed 0.10.0 release.
| Input shape | How tabulate reads it |
|---|---|
| Nested list | Each inner list becomes one row |
| List of dicts | Keys become columns with headers equals keys |
| Dict of lists | Keys become headers, values become columns |
What You Need Before Your First Table
Install the library and confirm the version, because outputs below come from 0.10.0. I installed fresh in this run and printed the version string to prove it.
pip install tabulate
import tabulate

print(tabulate.__version__)
0.10.0
| Setup step | Command | Proves |
|---|---|---|
| Install | pip install tabulate | Library present |
| Import | from tabulate import tabulate | Function available |
| Version | tabulate dot __version__ | 0.10.0 behavior |
Turn Data Into Tables With Tabulate
One marks table carries this whole section, five students with roll numbers and scores. Each heading adds one option and shows the new output directly beneath it.
Render a Nested List
The simplest call takes the nested list and aligns the columns. I ran it with no options first so you can see the default plain style.
from tabulate import tabulate

all_data = [["Roll Number", "Student name", "Marks"],
            [1, "Sasha", 34],
            [2, "Richard", 36],
            [3, "Judy", 20],
            [4, "Lori", 39],
            [5, "Maggie", 40]]

print(tabulate(all_data))
-----------  ------------  -----
Roll Number  Student name  Marks
1            Sasha         34
2            Richard       36
3            Judy          20
4            Lori          39
5            Maggie        40
-----------  ------------  -----
Readable already, though the header row still looks like data. The headers option fixes that next.
Label Columns With Headers
Pass headers as firstrow and the first inner list becomes the header with a separator beneath it. Numbers right-align automatically, which the output shows.
from tabulate import tabulate

print(tabulate(all_data, headers="firstrow"))
  Roll Number  Student name      Marks
-------------  --------------  -------
            1  Sasha                34
            2  Richard              36
            3  Judy                 20
            4  Lori                 39
            5  Maggie               40
Style the Table With tablefmt
tablefmt redraws the same data with different borders. I rendered grid, fancy grid, and github back to back so you can pick by eye.
from tabulate import tabulate

print(tabulate(all_data, headers="firstrow", tablefmt="grid"))
+---------------+----------------+---------+
|   Roll Number | Student name   |   Marks |
+===============+================+=========+
|             1 | Sasha          |      34 |
+---------------+----------------+---------+
|             2 | Richard        |      36 |
+---------------+----------------+---------+
|             3 | Judy           |      20 |
+---------------+----------------+---------+
|             4 | Lori           |      39 |
+---------------+----------------+---------+
|             5 | Maggie         |      40 |
+---------------+----------------+---------+
from tabulate import tabulate

print(tabulate(all_data, headers="firstrow", tablefmt="fancy_grid"))
print(tabulate(all_data, headers="firstrow", tablefmt="github"))
╒═══════════════╤════════════════╤═════════╕
│   Roll Number │ Student name   │   Marks │
╞═══════════════╪════════════════╪═════════╡
│             1 │ Sasha          │      34 │
├───────────────┼────────────────┼─────────┤
│             2 │ Richard        │      36 │
├───────────────┼────────────────┼─────────┤
│             3 │ Judy           │      20 │
├───────────────┼────────────────┼─────────┤
│             4 │ Lori           │      39 │
├───────────────┼────────────────┼─────────┤
│             5 │ Maggie         │      40 │
╘═══════════════╧════════════════╧═════════╛
|   Roll Number | Student name   |   Marks |
|---------------|----------------|---------|
|             1 | Sasha          |      34 |
|             2 | Richard        |      36 |
|             3 | Judy           |      20 |
|             4 | Lori           |      39 |
|             5 | Maggie         |      40 |
Grid suits terminal reports, fancy grid suits presentations, and github pastes straight into markdown files. One option changes the whole look, so experiment freely.
Add an Index, Handle Missing Values, Format Numbers
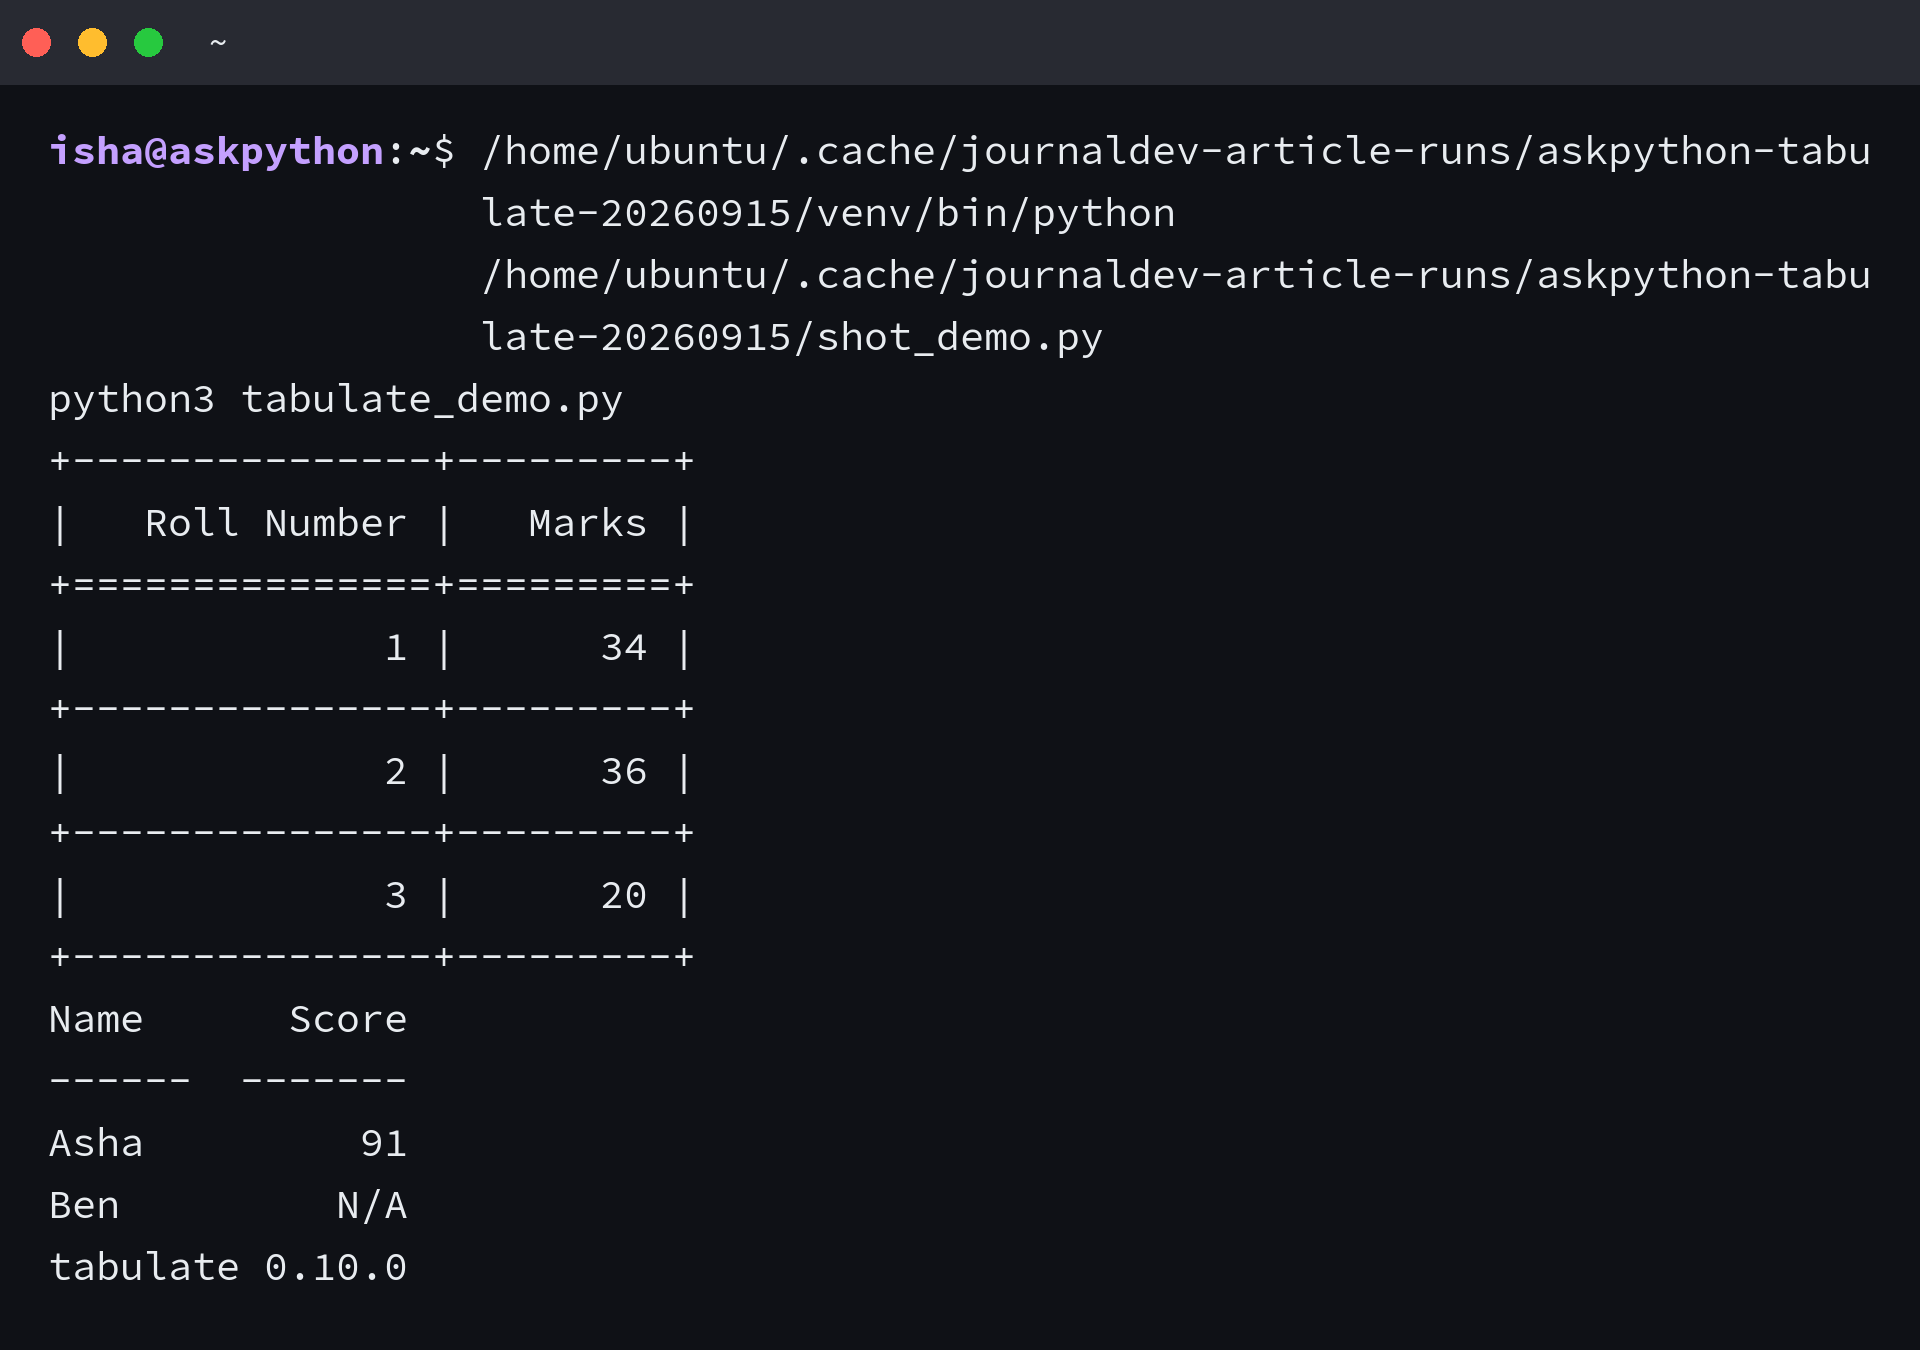
Three small options cover the messy-data cases. showindex numbers the rows, missingval fills the blanks, and floatfmt tames decimals, each shown running below.
from tabulate import tabulate

print(tabulate(all_data[1:], headers=all_data[0], showindex=True))
      Roll Number  Student name      Marks
--  -------------  --------------  -------
 0              1  Sasha                34
 1              2  Richard              36
 2              3  Judy                 20
 3              4  Lori                 39
 4              5  Maggie               40
from tabulate import tabulate

sparse = [["Name", "Score"], ["Asha", 91], ["Ben", None], ["Cat", 77]]
print(tabulate(sparse, headers="firstrow"))
print(tabulate(sparse, headers="firstrow", missingval="N/A"))
Name      Score
------  -------
Asha         91
Ben
Cat          77
Name      Score
------  -------
Asha         91
Ben         N/A
Cat          77
from tabulate import tabulate

floats = [["Item", "Price"], ["apple", 1.5], ["bread", 2.3456], ["cheese", 10.0]]
print(tabulate(floats, headers="firstrow", floatfmt=".2f"))
Item      Price
------  -------
apple      1.50
bread      2.35
cheese    10.00
Feed It Dictionaries
Data rarely arrives as neat nested lists, so tabulate also reads dicts. A list of dicts takes its columns from the keys, and I ran both shapes to prove they agree.
from tabulate import tabulate

print(tabulate([{"name": "Sasha", "marks": 34},
                {"name": "Judy", "marks": 20}], headers="keys"))
print(tabulate({"name": ["Sasha", "Judy"],
                "marks": [34, 20]}, headers="keys"))
name      marks
------  -------
Sasha        34
Judy         20
name      marks
------  -------
Sasha        34
Judy         20
Lists of lists stay the default for numeric work, while dicts fit records with named fields. Pick the shape your data already has.
Where Tabulate Stops Helping
Tabulate parses text that looks numeric, which backfires on codes with leading zeros. A zip code of 007 prints as 7 unless you switch parsing off, and I confirmed the mangling before the fix.
from tabulate import tabulate

rows = [["zip", "007"], ["pin", "042"]]
print(tabulate(rows, headers="firstrow", disable_numparse=True))
zip    007
-----  -----
pin    042
| Limit | Symptom | Move |
|---|---|---|
| Leading-zero codes | 007 prints as 7 | disable_numparse set True |
| Empty input | Headers with no rows | Guard empty data before calling |
| HTML pages | Raw table markup needed | tablefmt html, then style separately |
| Full dataframe styling | Beyond text tables | Use pandas styling instead |
from tabulate import tabulate

print(tabulate(all_data, headers="firstrow", tablefmt="html").splitlines()[0])
print(repr(tabulate([], headers=["a", "b"])))
<table>
'a    b\n---  ---'
Also read: How to Render a Data Frame to a LaTeX Table?
The One Call to Remember
Most sessions need exactly one call with three options. Headers label the columns, firstrow points at them, and grid draws the borders readers expect.
| Job | Call shape |
|---|---|
| Quick readable table | tabulate with headers firstrow and tablefmt grid |
| Markdown-ready table | tabulate with headers firstrow and tablefmt github |
| Rows with blanks and decimals | Add showindex, missingval, and floatfmt as needed |
| Named records | Pass dicts with headers keys |
Frequently Asked Questions
Direct answers to the tabulate questions readers keep asking. Each one points back at the section that proves it.
How do I install tabulate in Python?
Run pip install tabulate, then import it with from tabulate import tabulate. This guide verified every output against version 0.10.0.
How do I add headers to a tabulate table?
Pass headers equals firstrow when your first row holds the labels, or pass a headers list directly. Tabulate draws a separator under the header and right-aligns numbers.
Which tablefmt should I choose?
Grid fits terminal reports, fancy grid fits presentations, and github pastes into markdown files. The same data renders under each, so pick by eye for your destination.
How do I show missing values in tabulate?
Pass missingval with your placeholder text, such as N/A. Empty cells render with that text instead of blank space.
Why does tabulate strip leading zeros?
Tabulate parses numeric-looking text by default, so 007 becomes 7. Pass disable_numparse True to keep codes and zip values literal.