Python For Data Analysis | Python Pandas Tutorial | Learn Python | Python Training | Edureka
The document outlines a Python certification training program offered by Edureka, focusing on data analysis with Python and utilizing libraries like Pandas, NumPy, and SciPy. It provides a comprehensive agenda that includes topics on data visualization, data life-cycle, and operations such as merging, joining, and slicing data frames. Additionally, it addresses practical applications through use-cases like analyzing youth unemployment data.
Introduction to Edureka's Python certification training with a focus on data analysis, covering agenda topics including Python applications and its role in data handling.
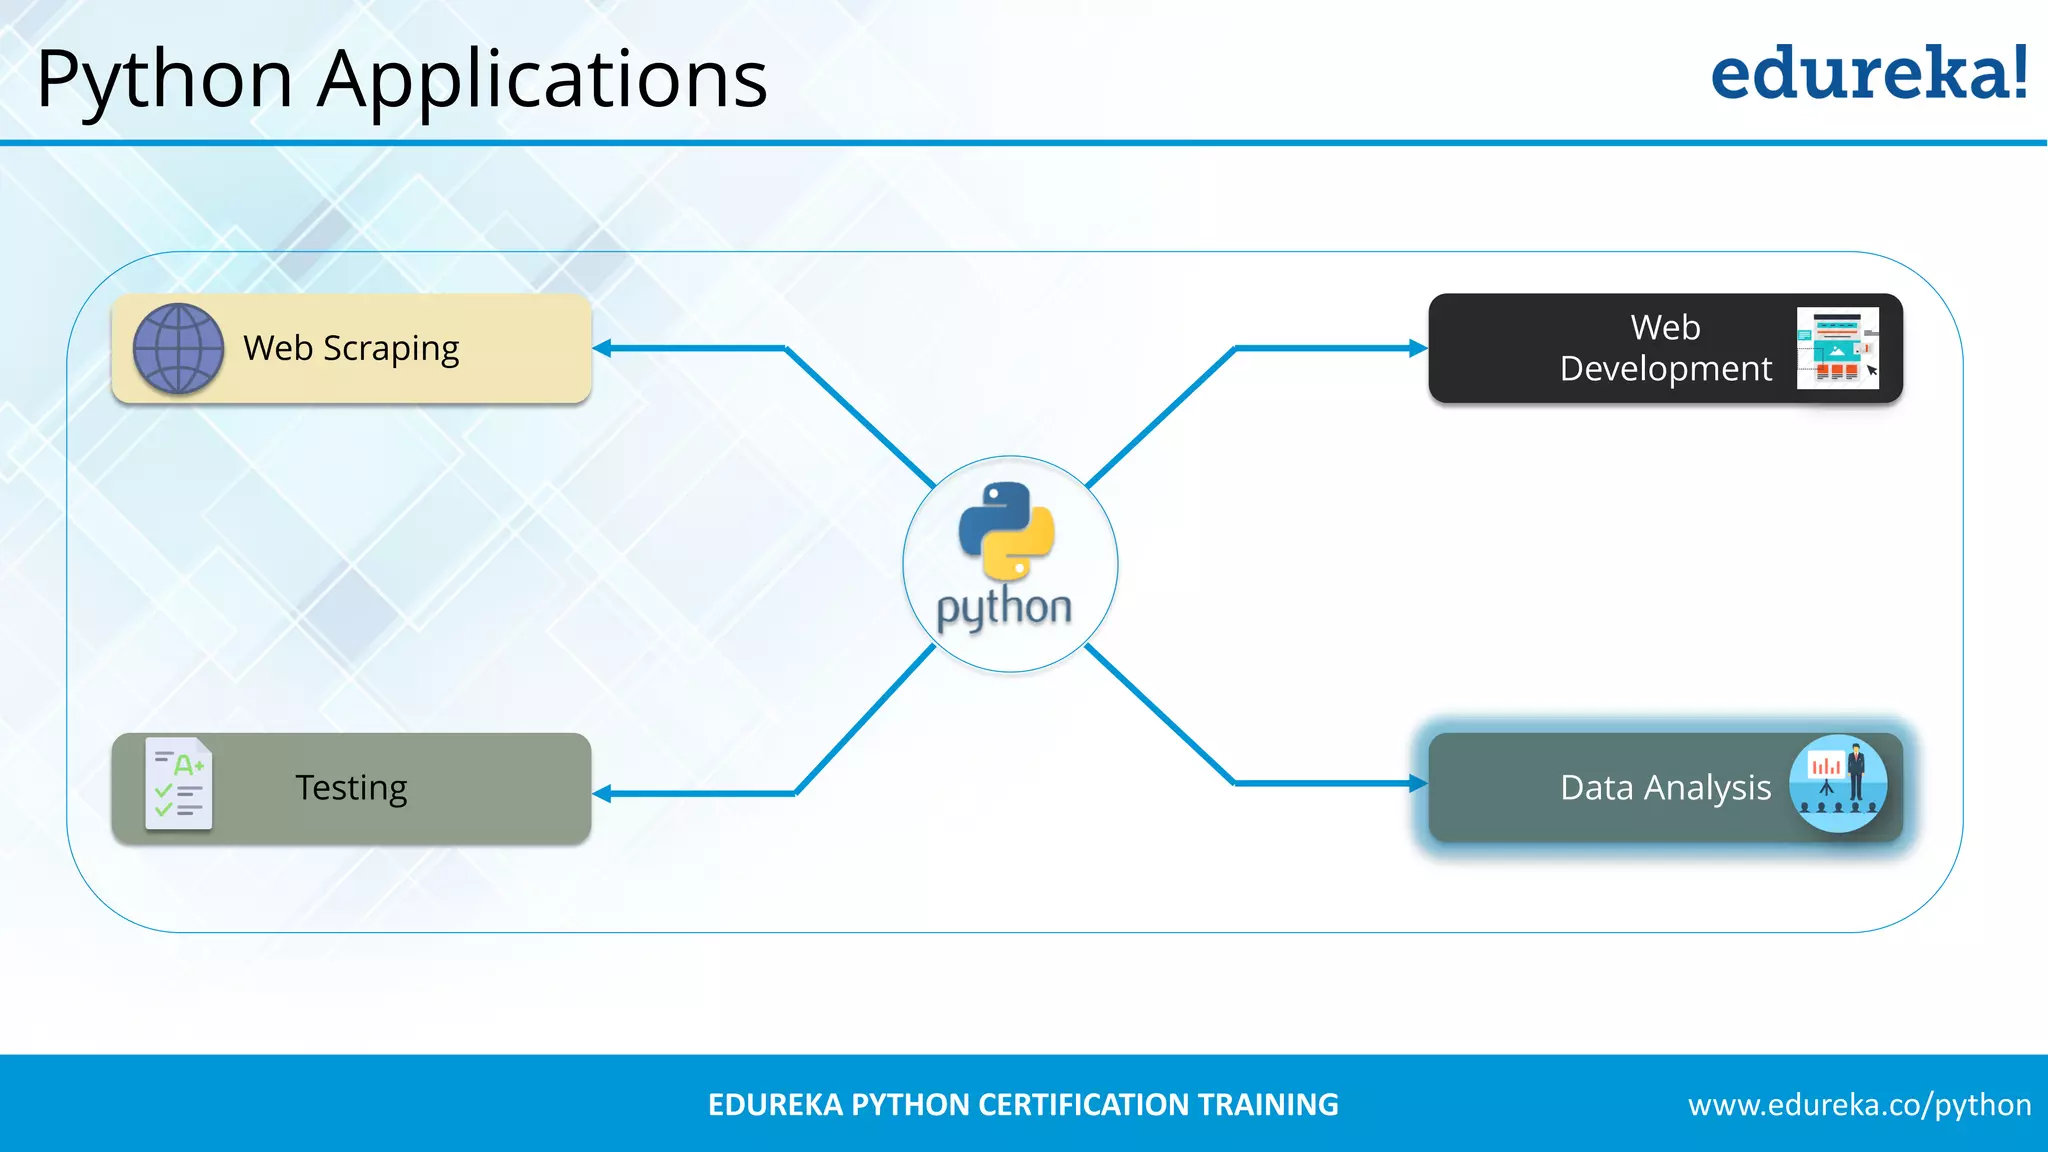
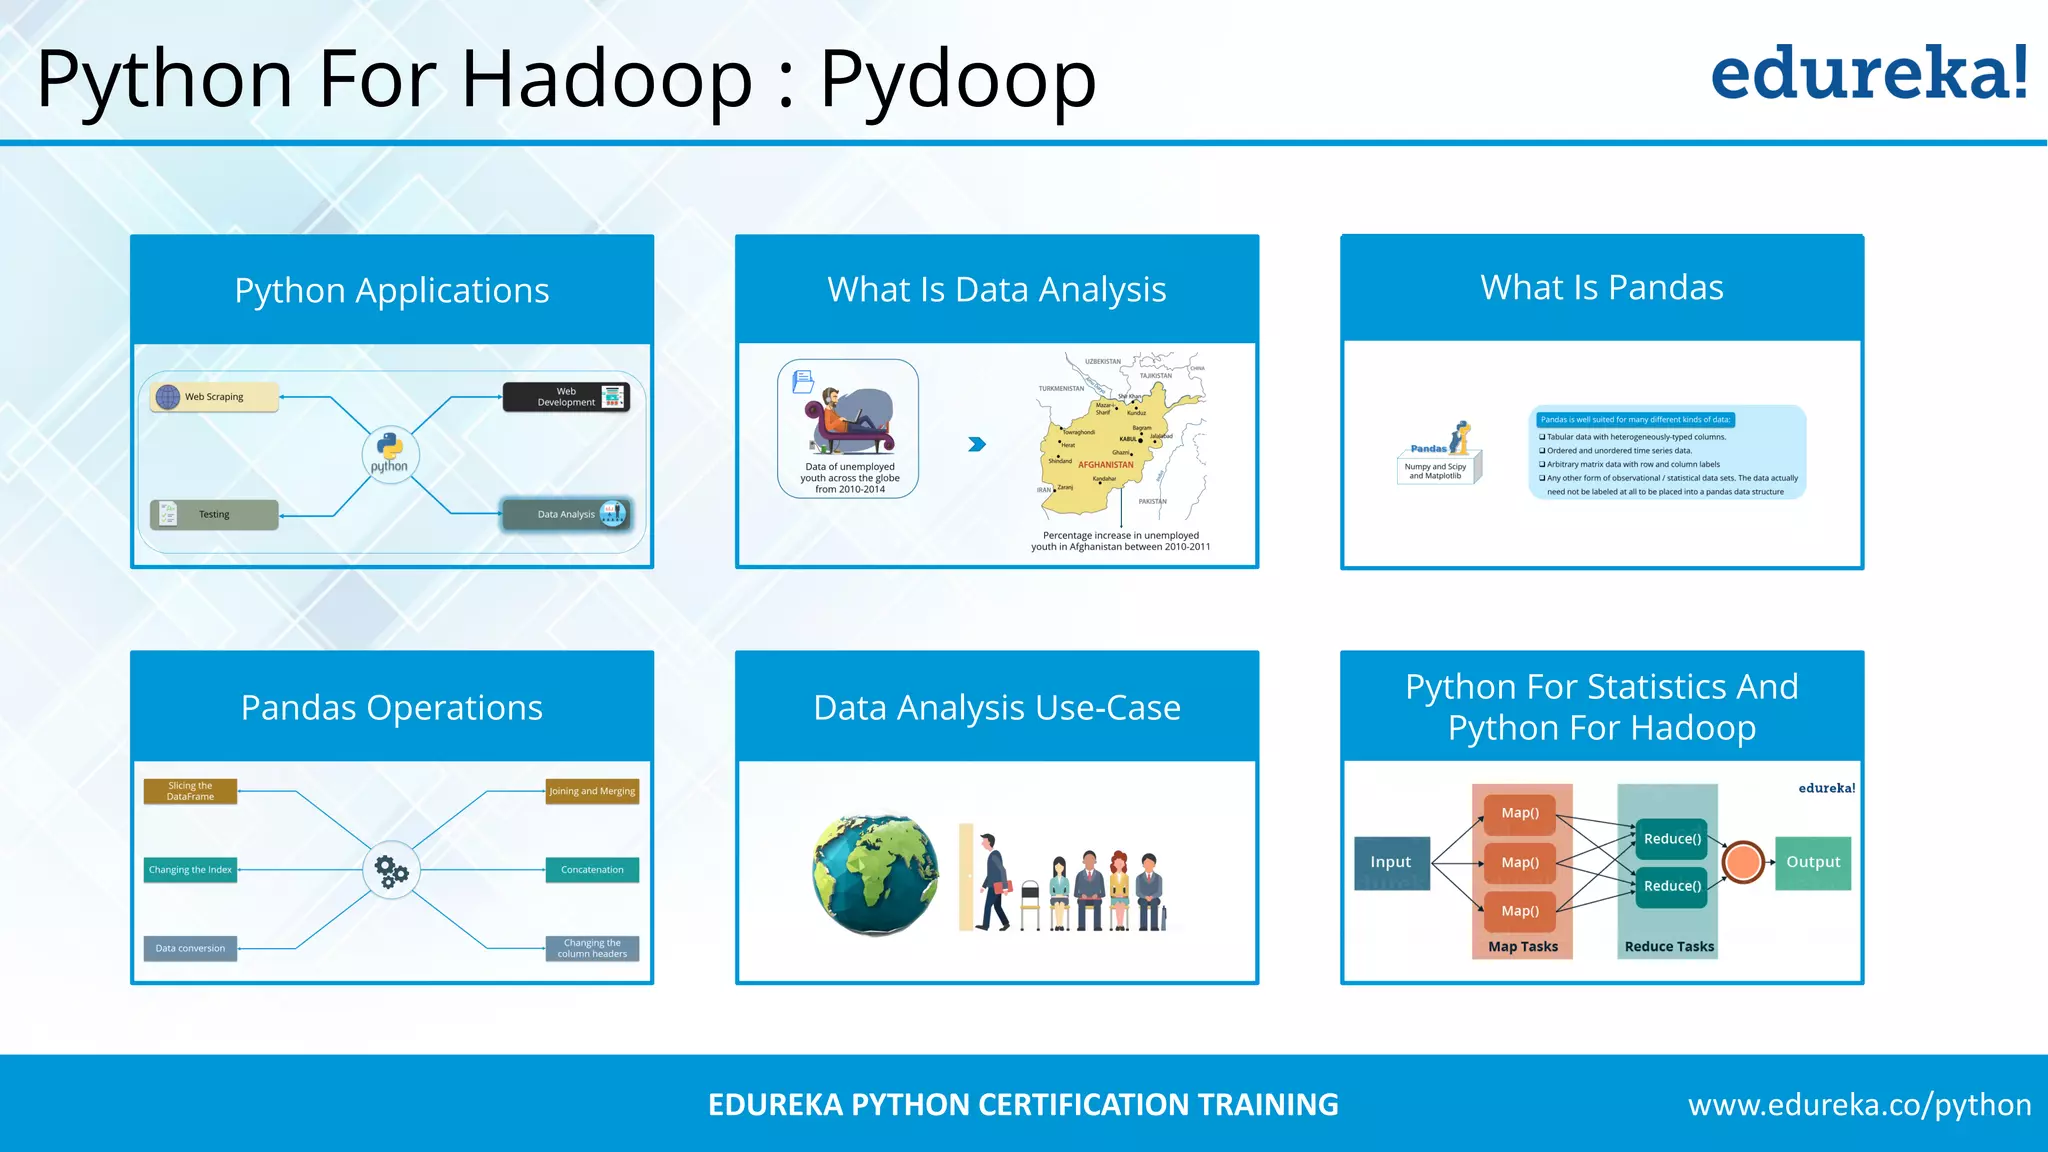
Discussion of Python applications such as web scraping, testing, web development, and particularly data analysis.
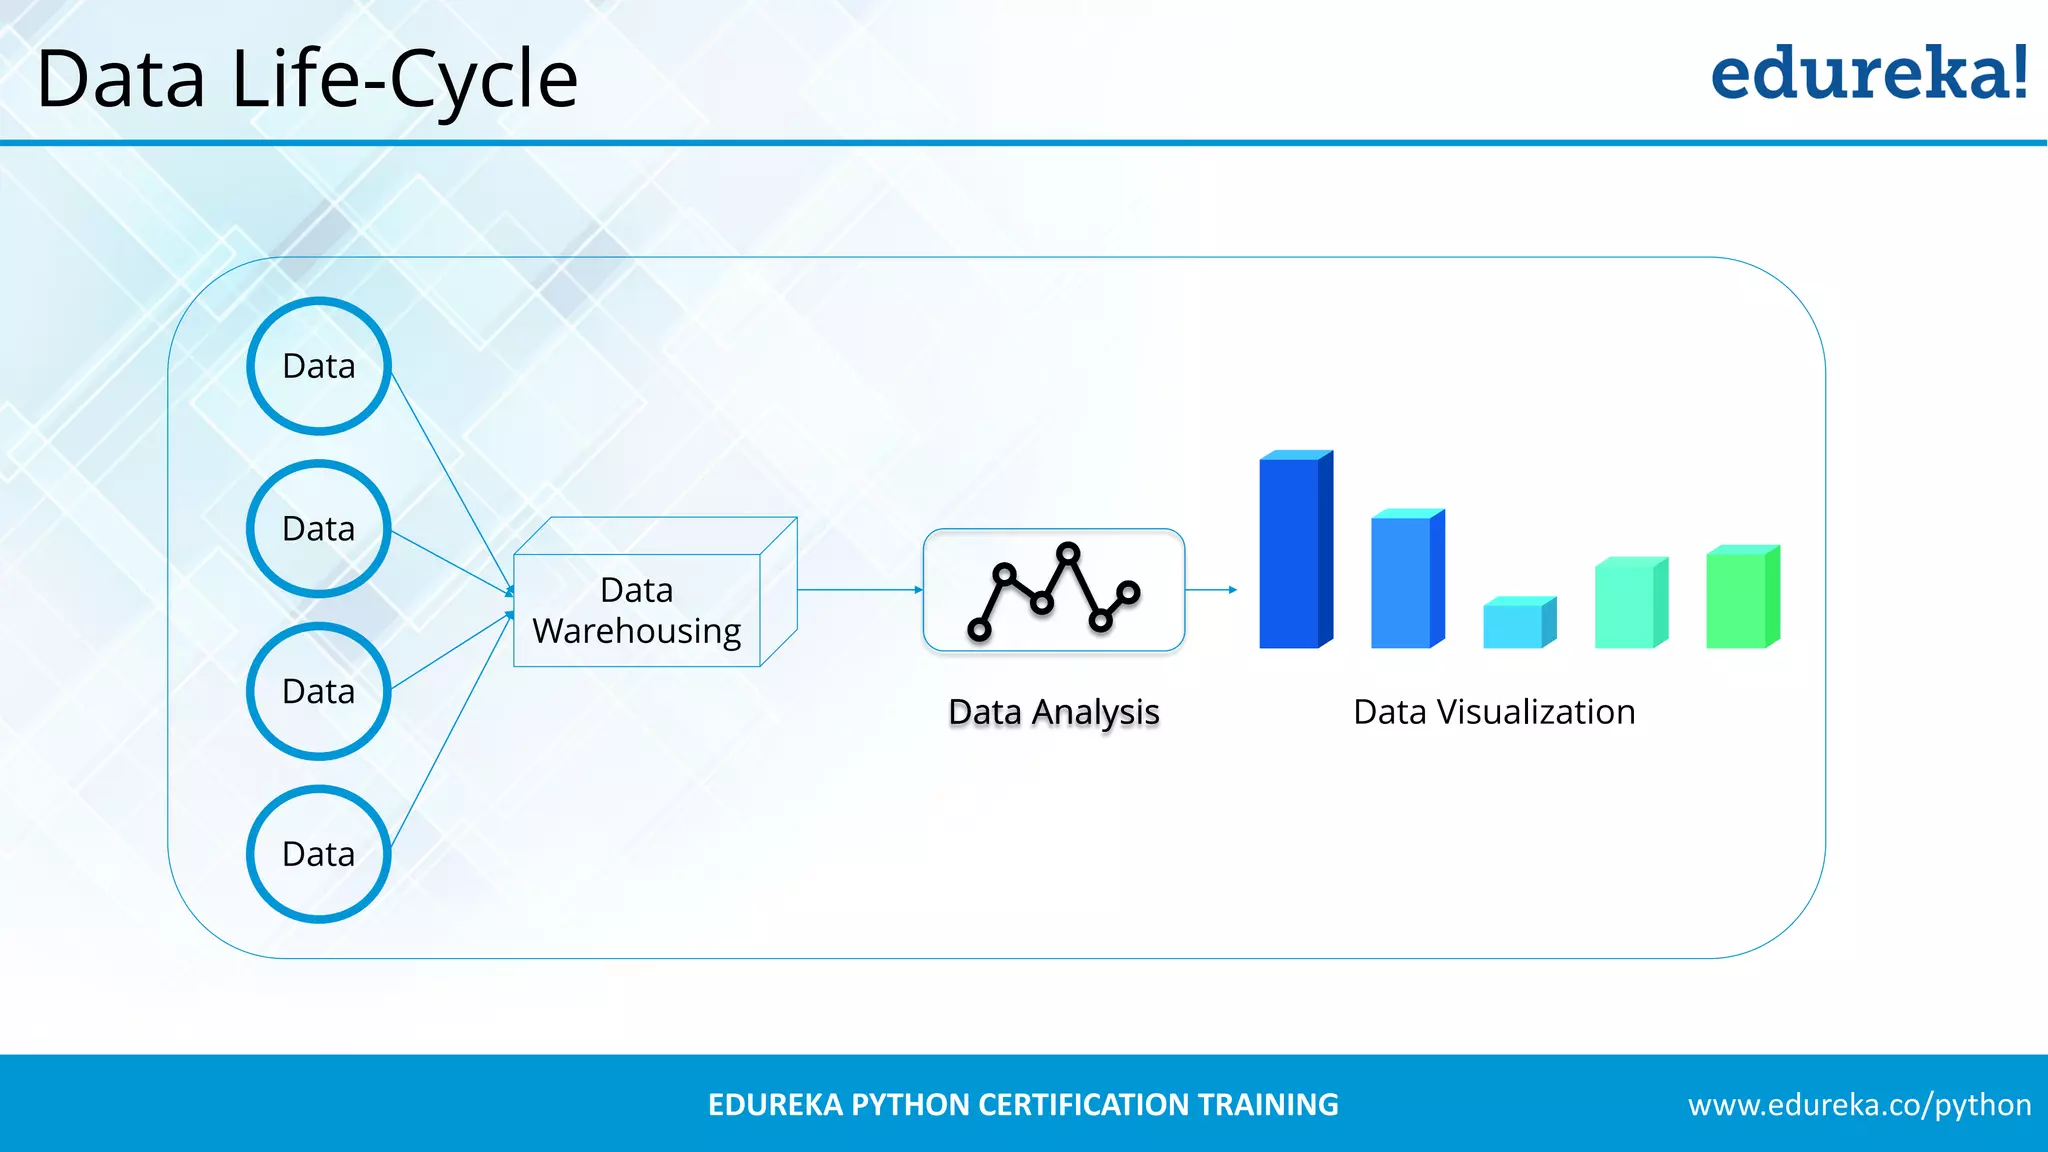
Overview of the data life-cycle stages including data warehousing, analysis, visualization, and its significance.
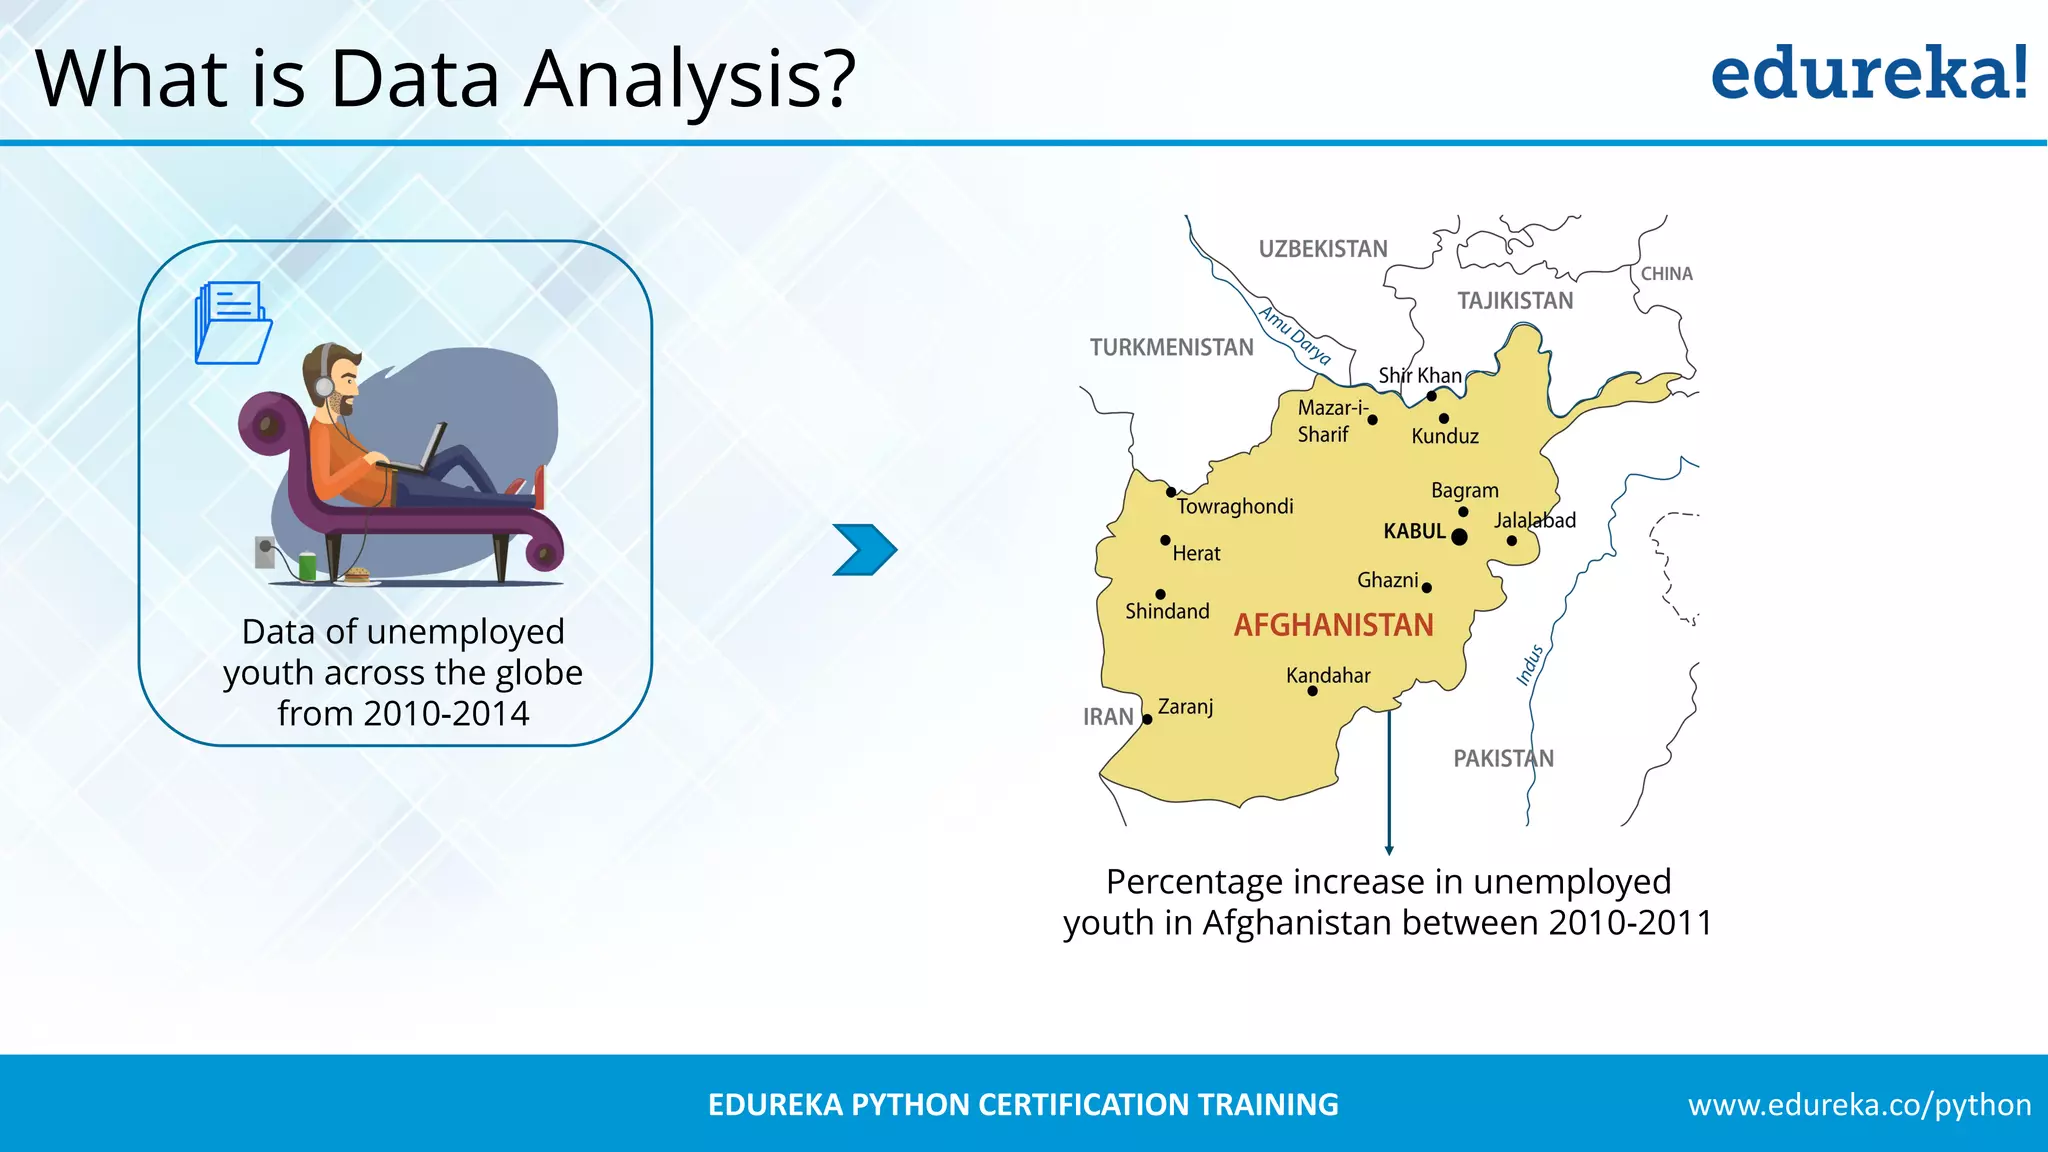
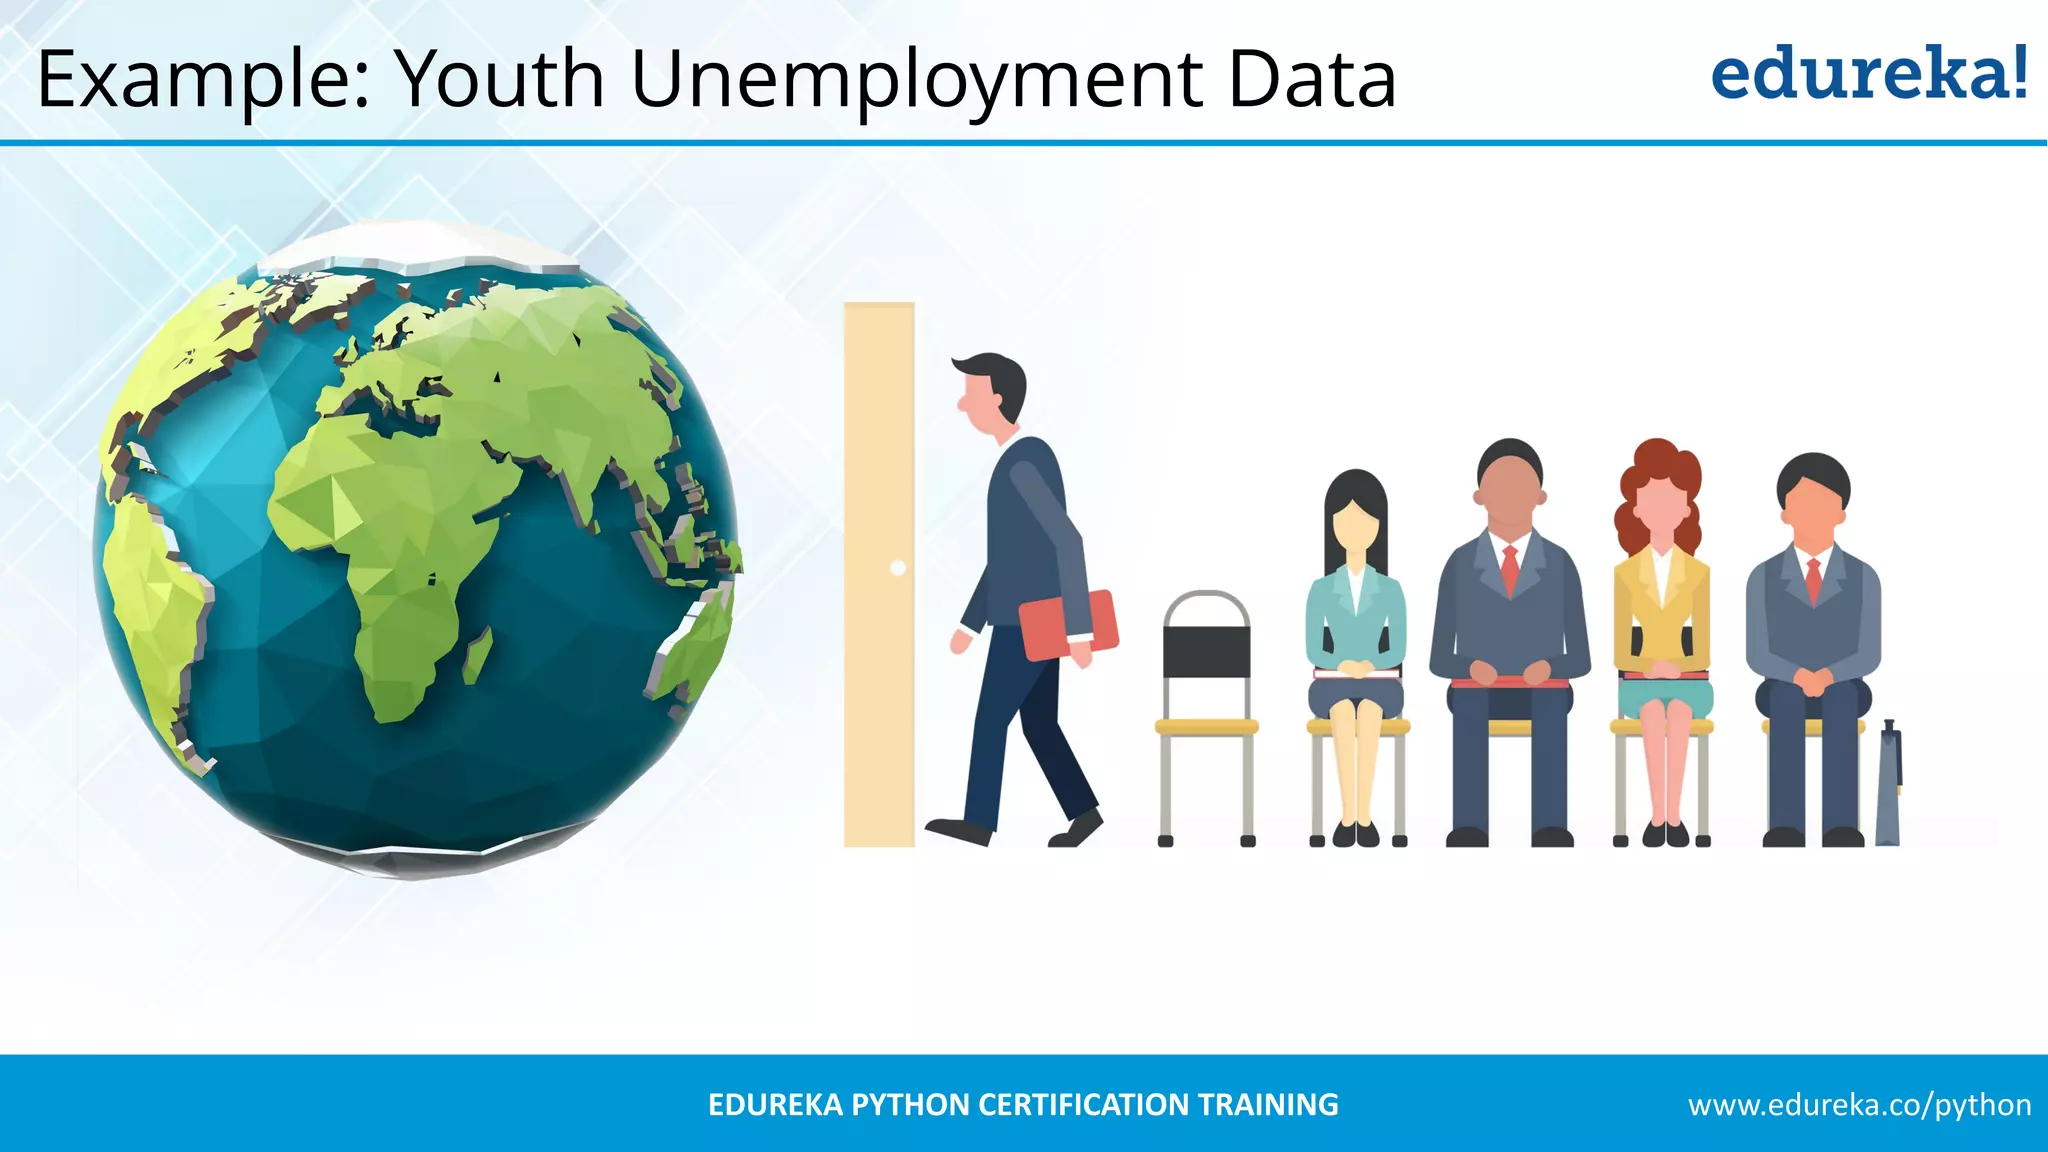
Definition of data analysis with an example highlighting the percentage increase in unemployment rates among youth globally.
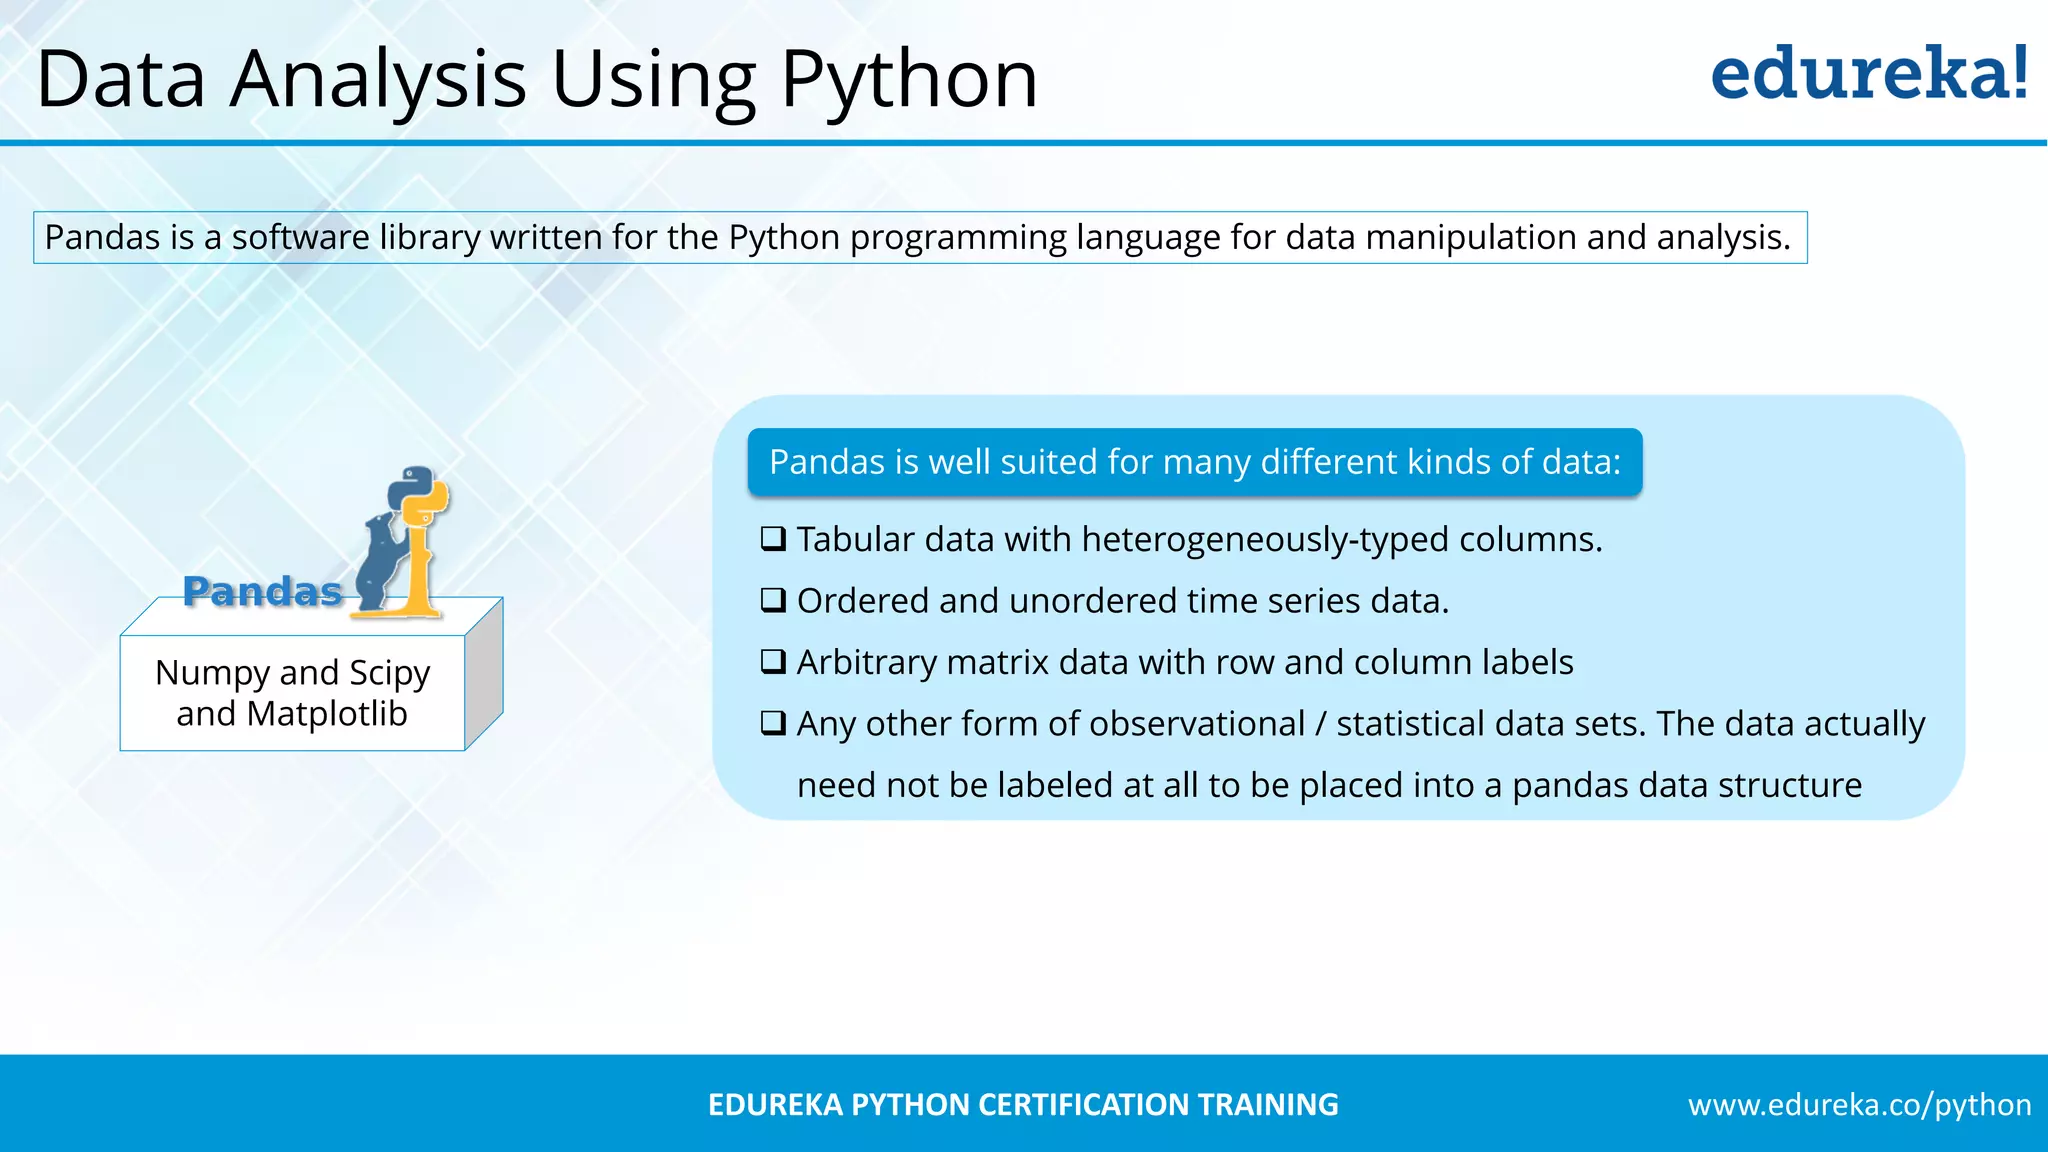
Introduction to Pandas software library for data manipulation and analysis, supporting various data types and structures.
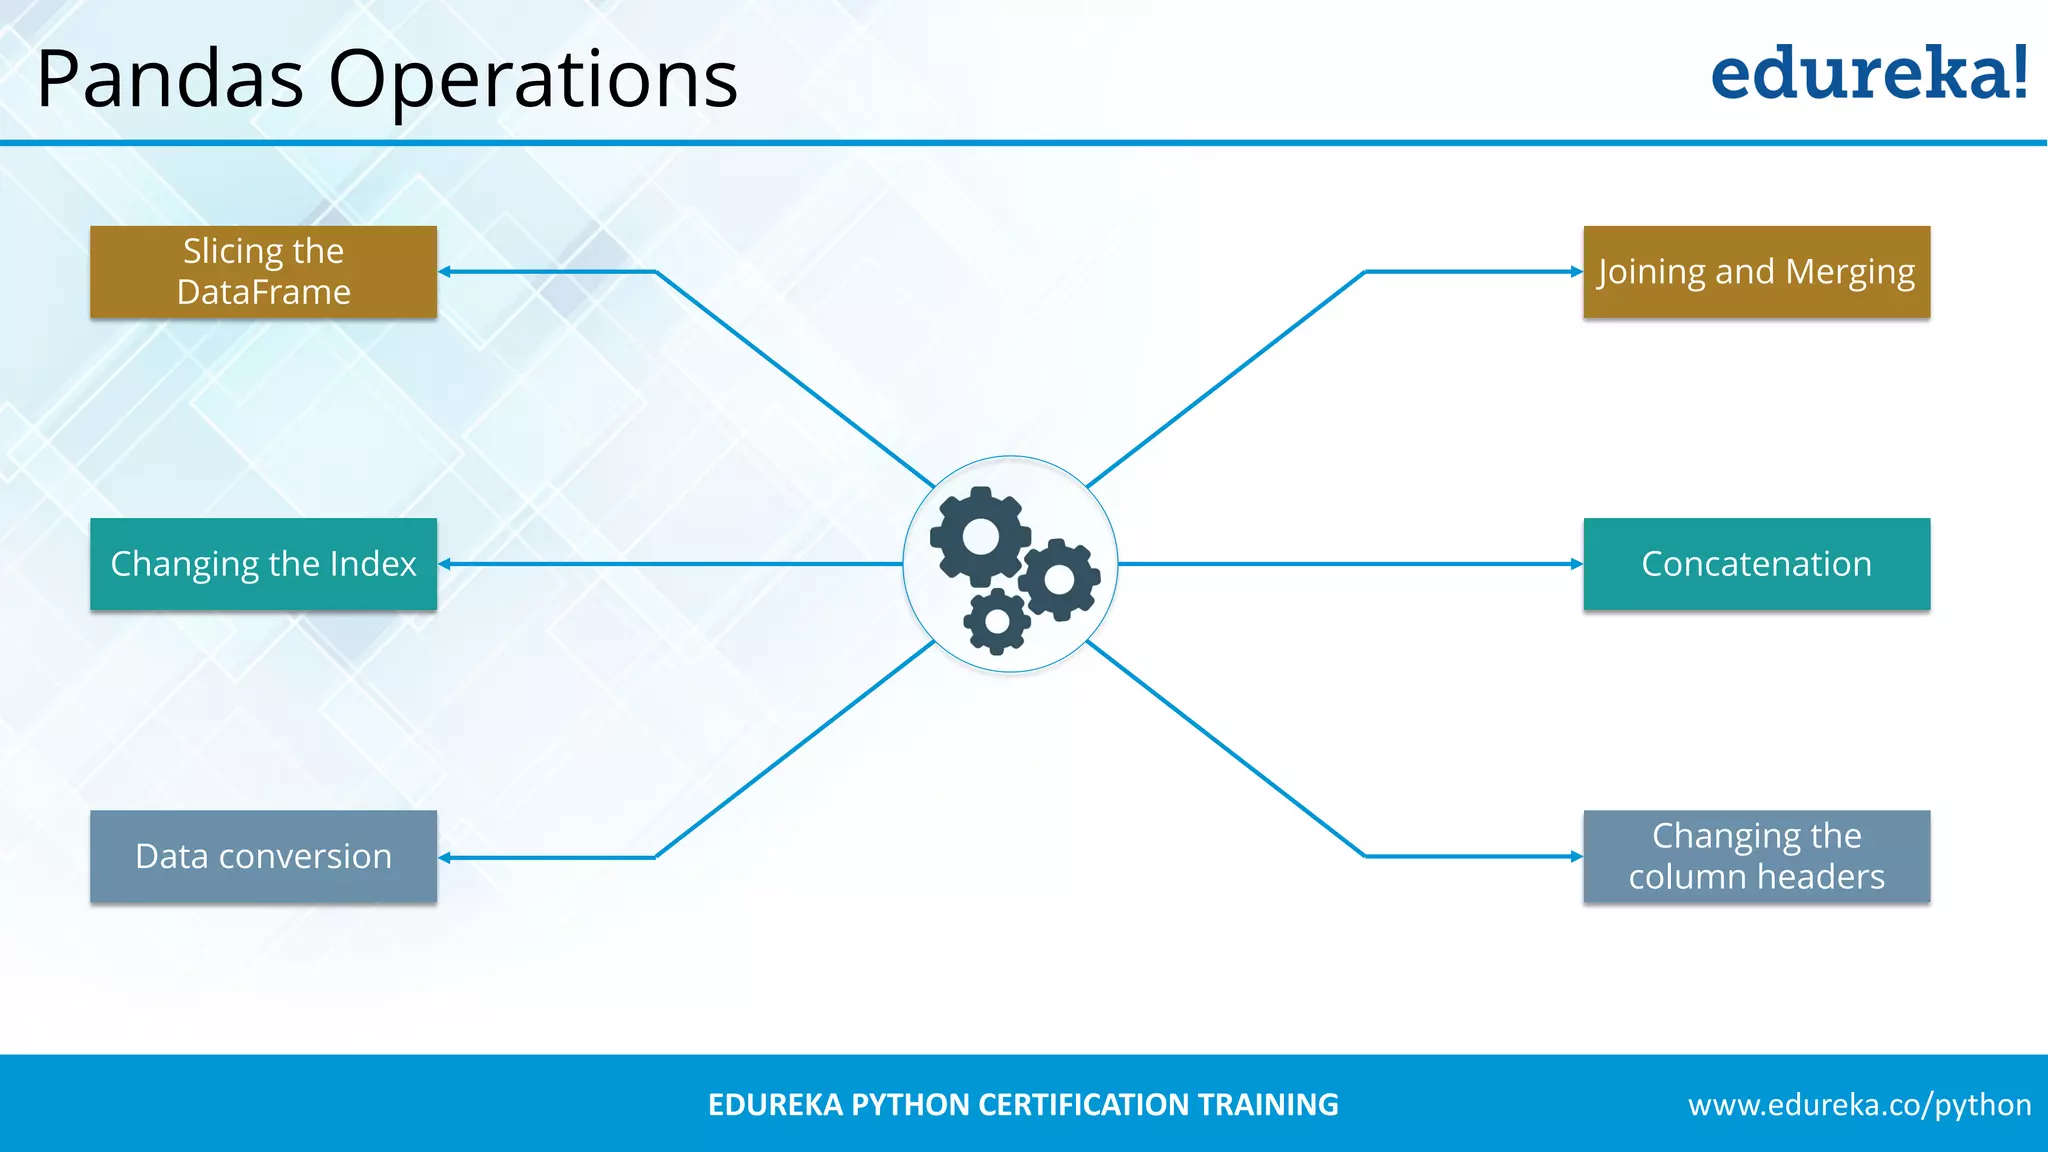
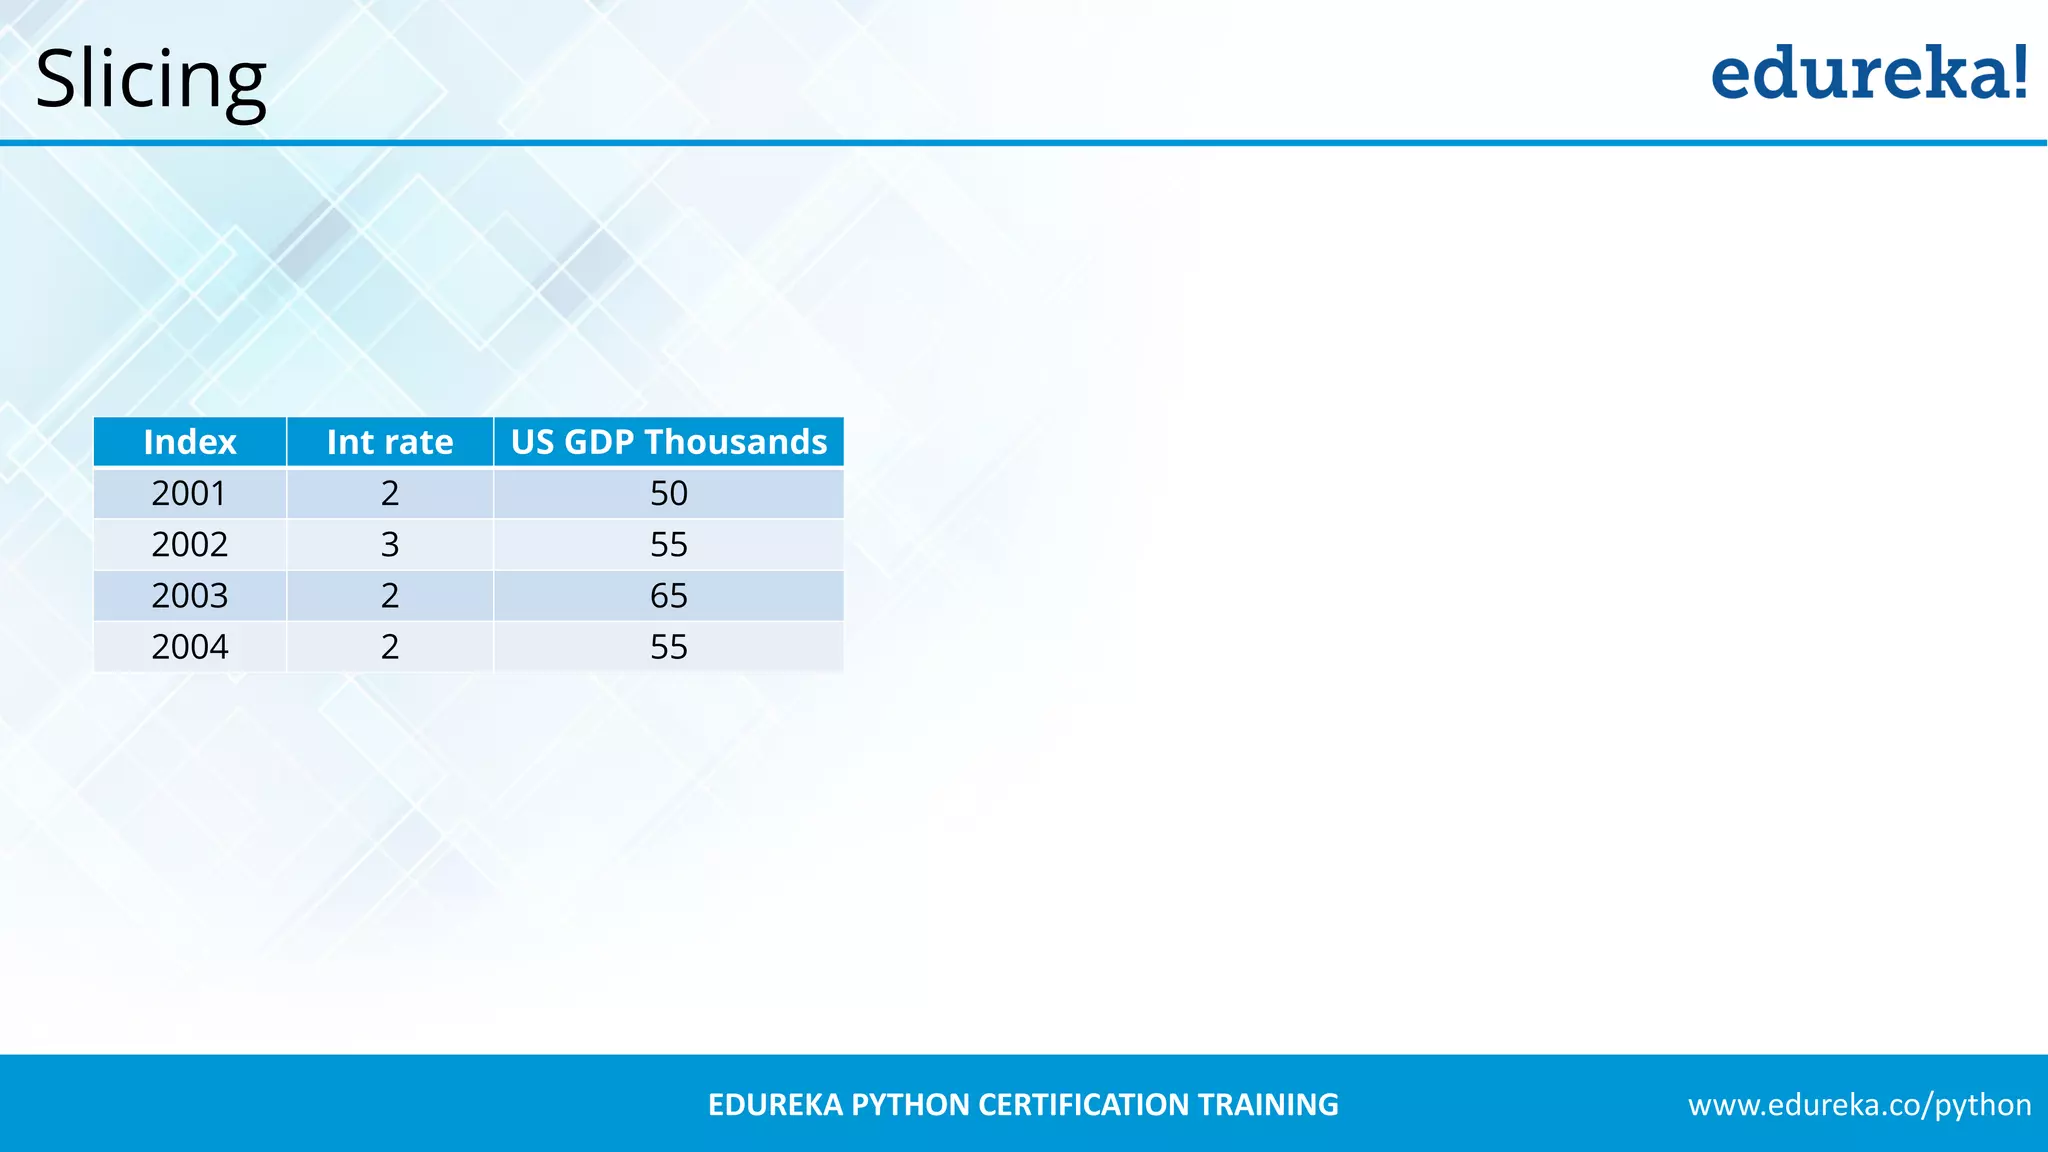
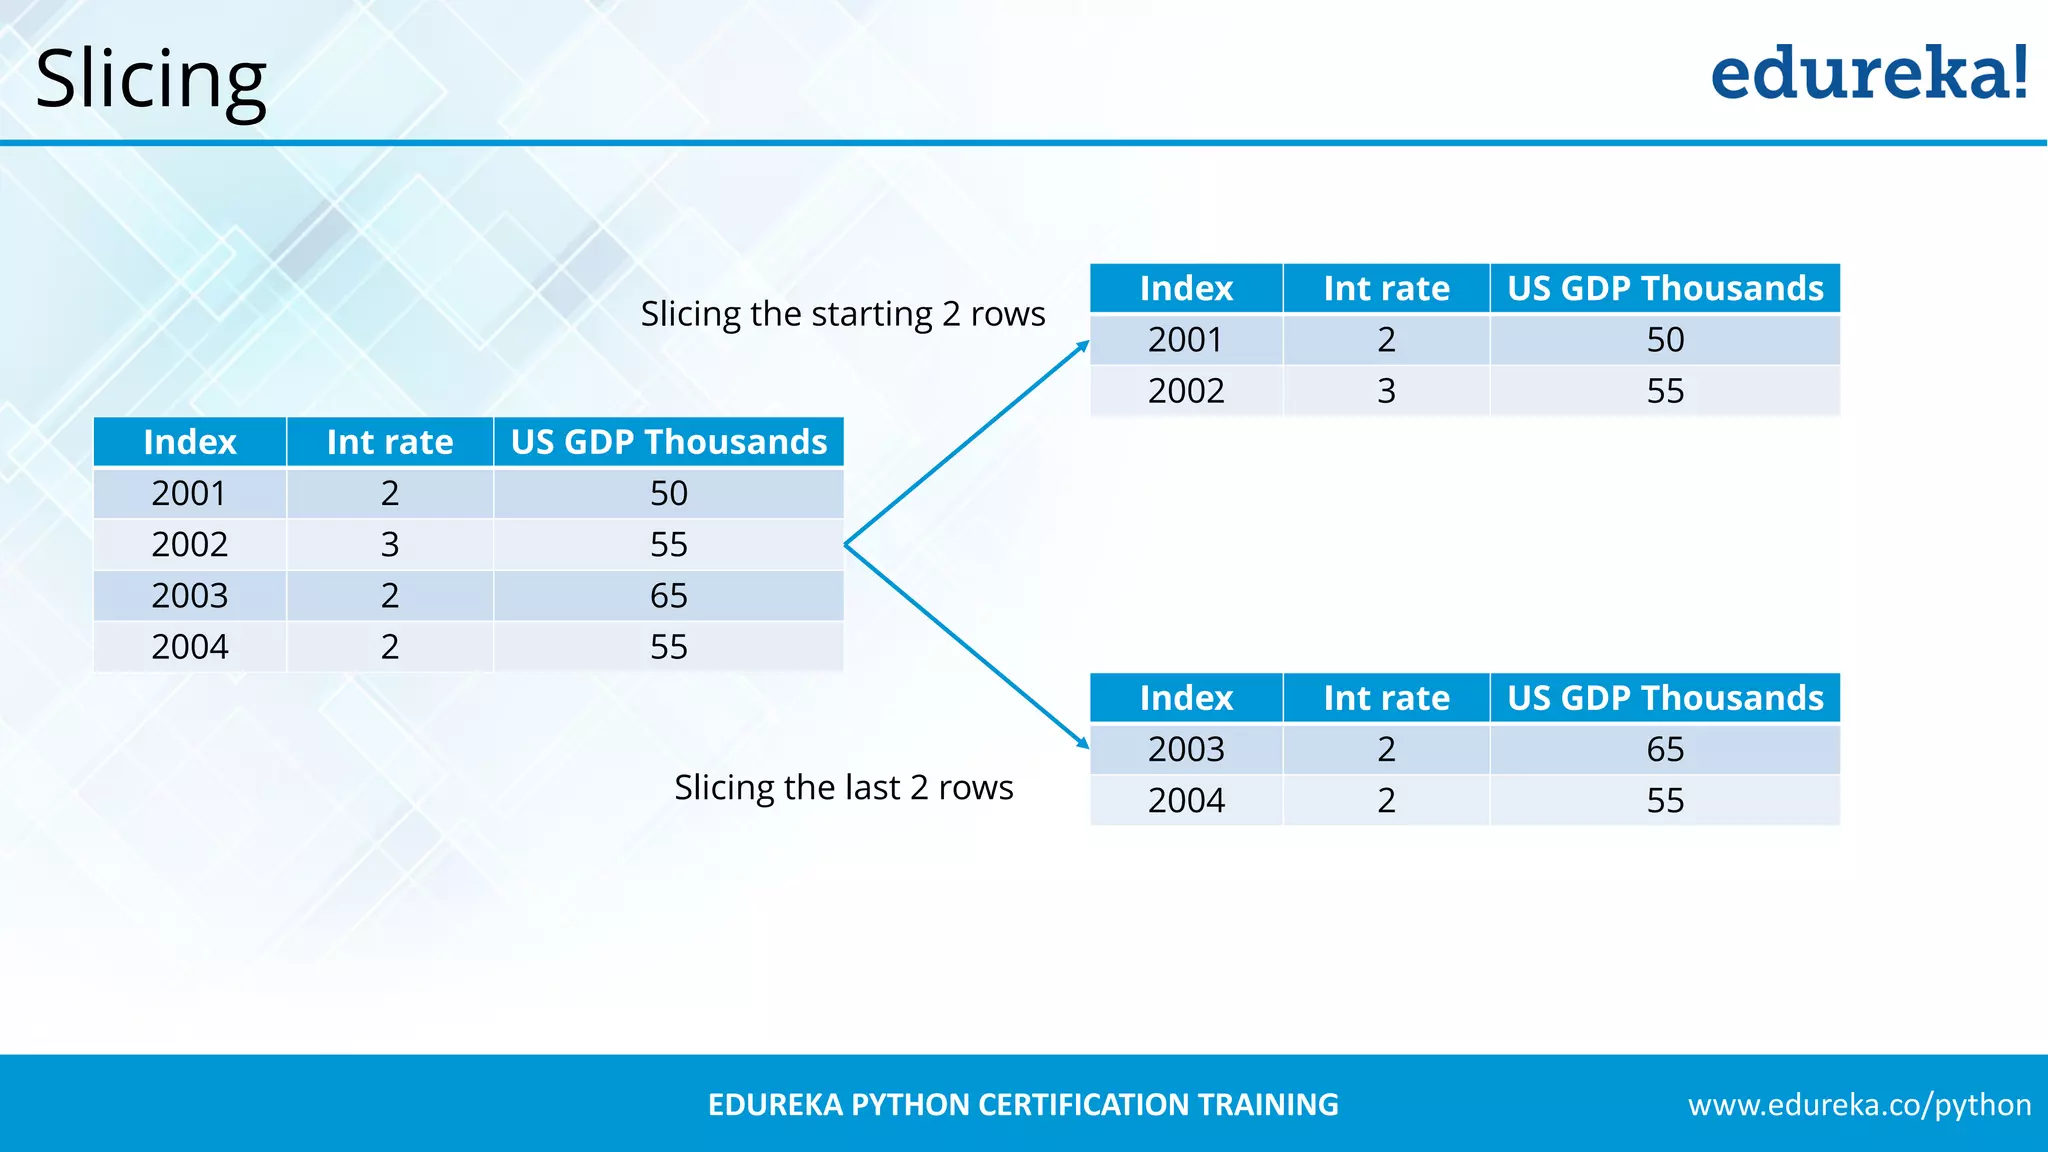
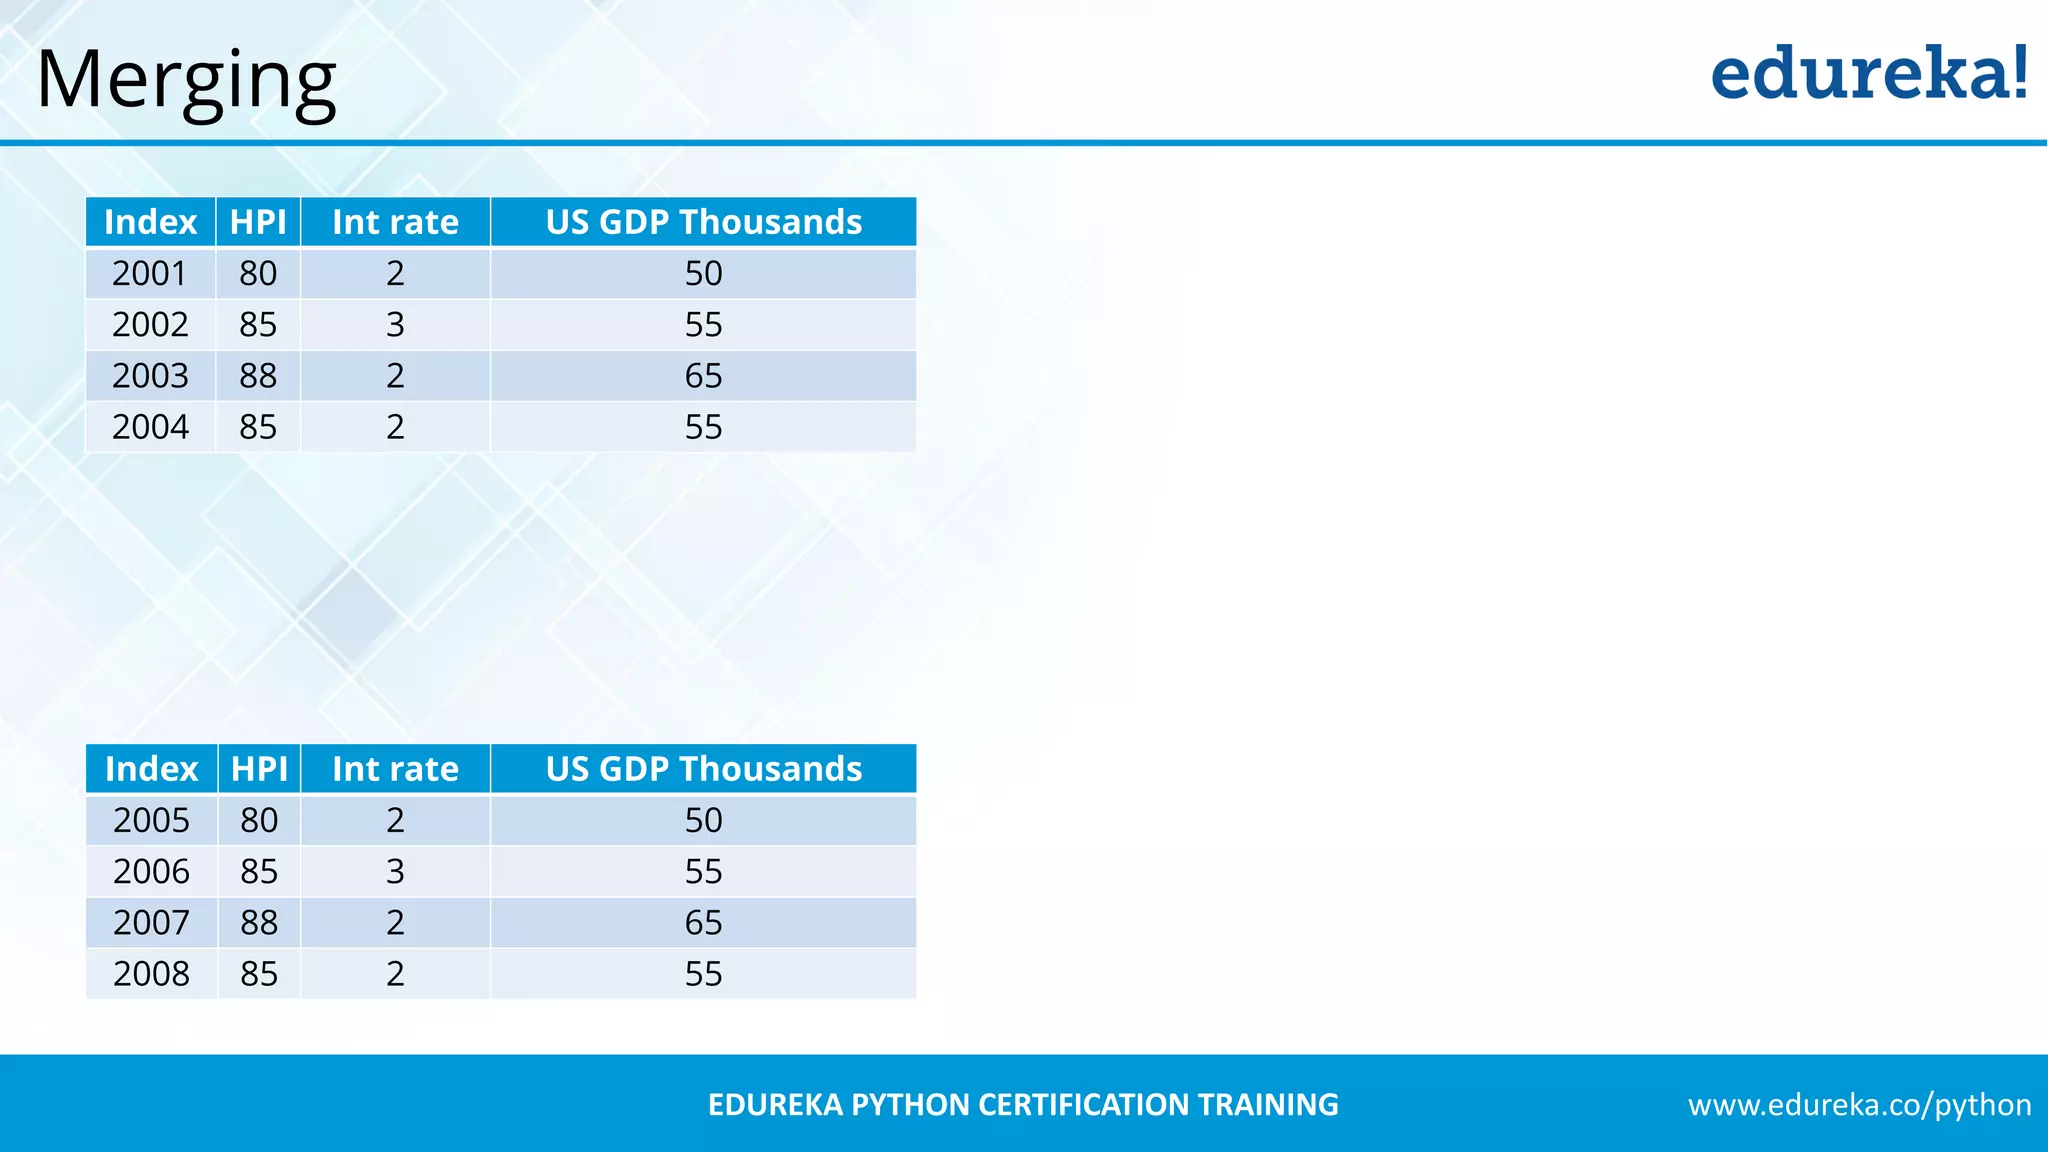
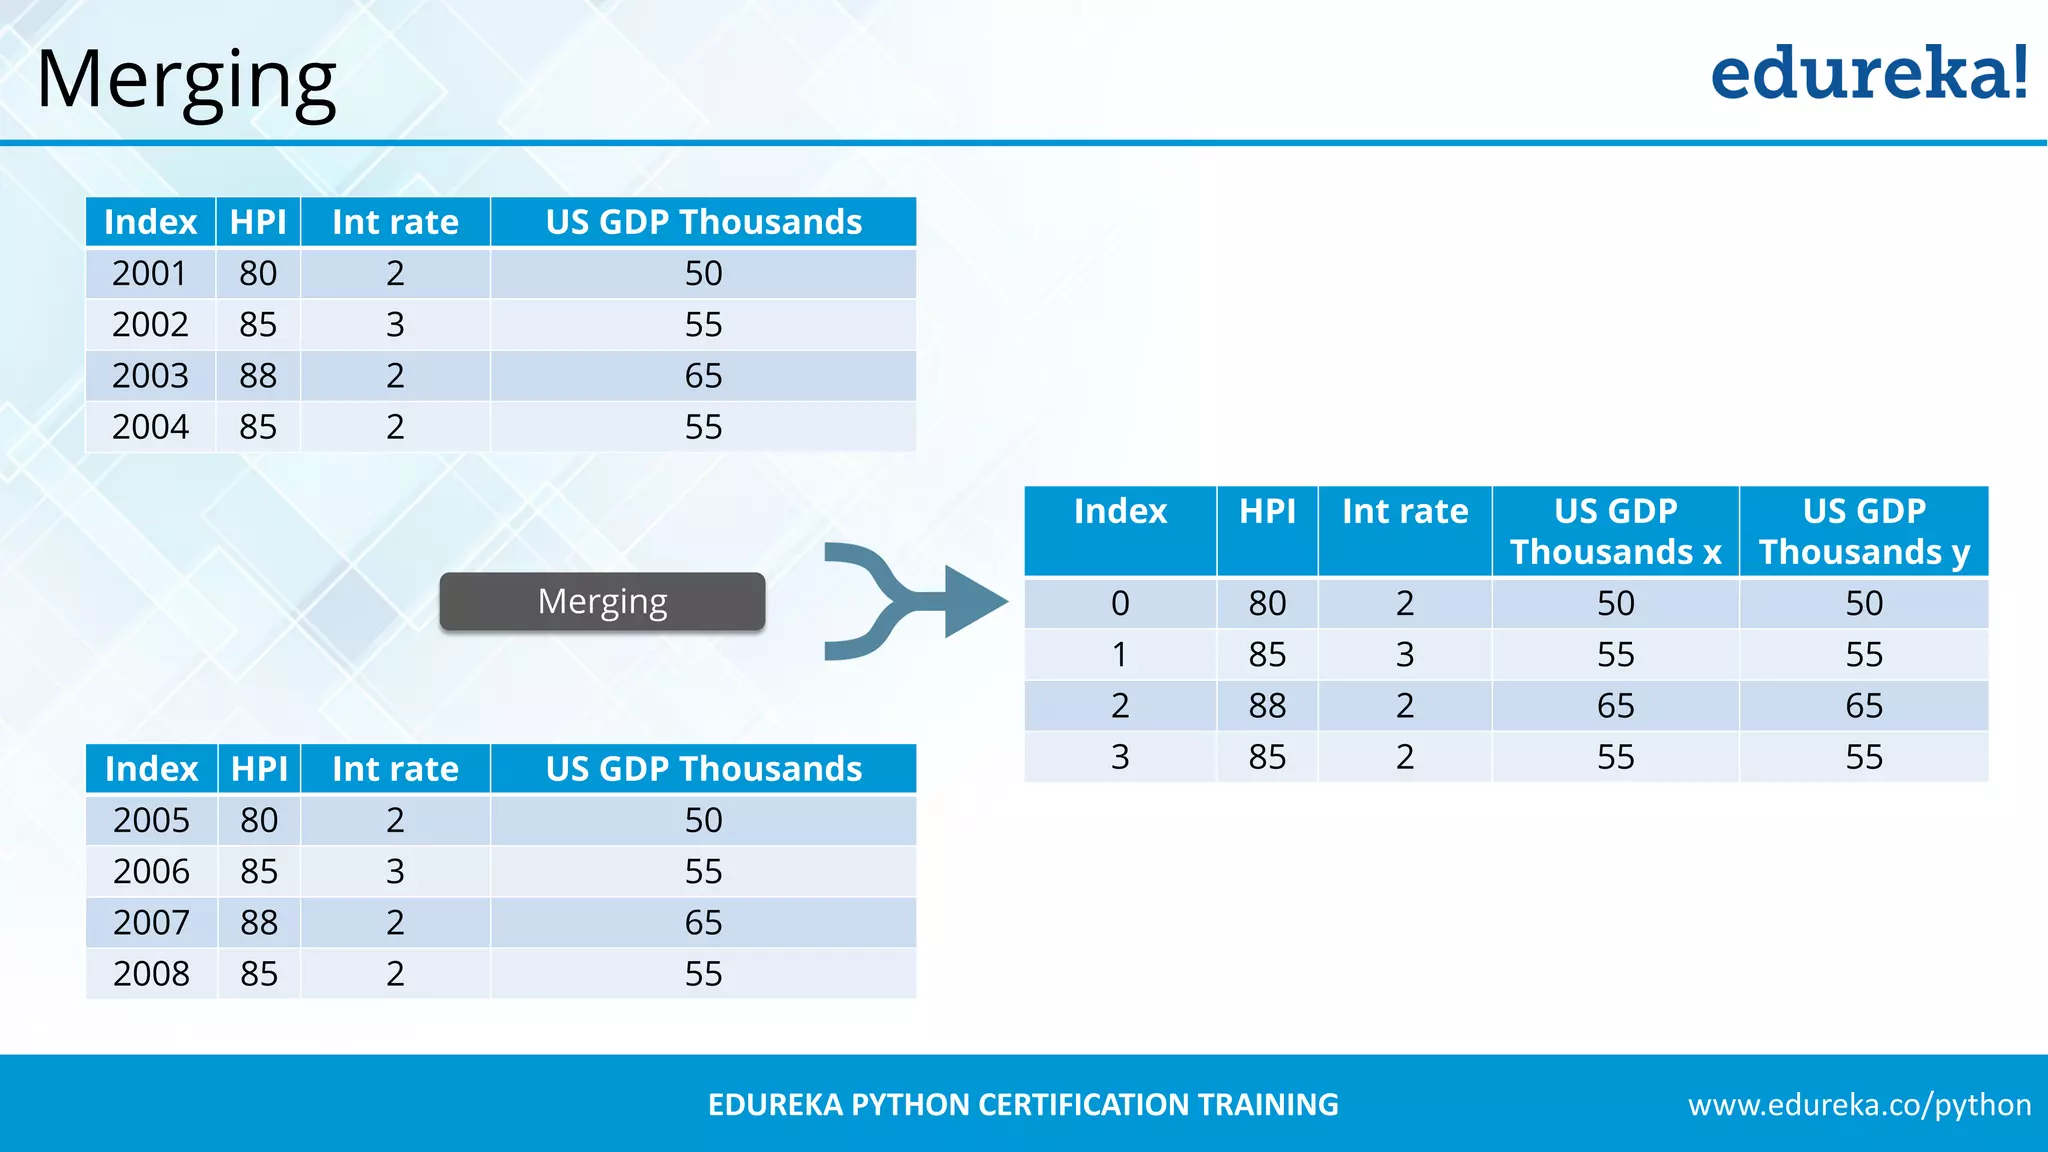
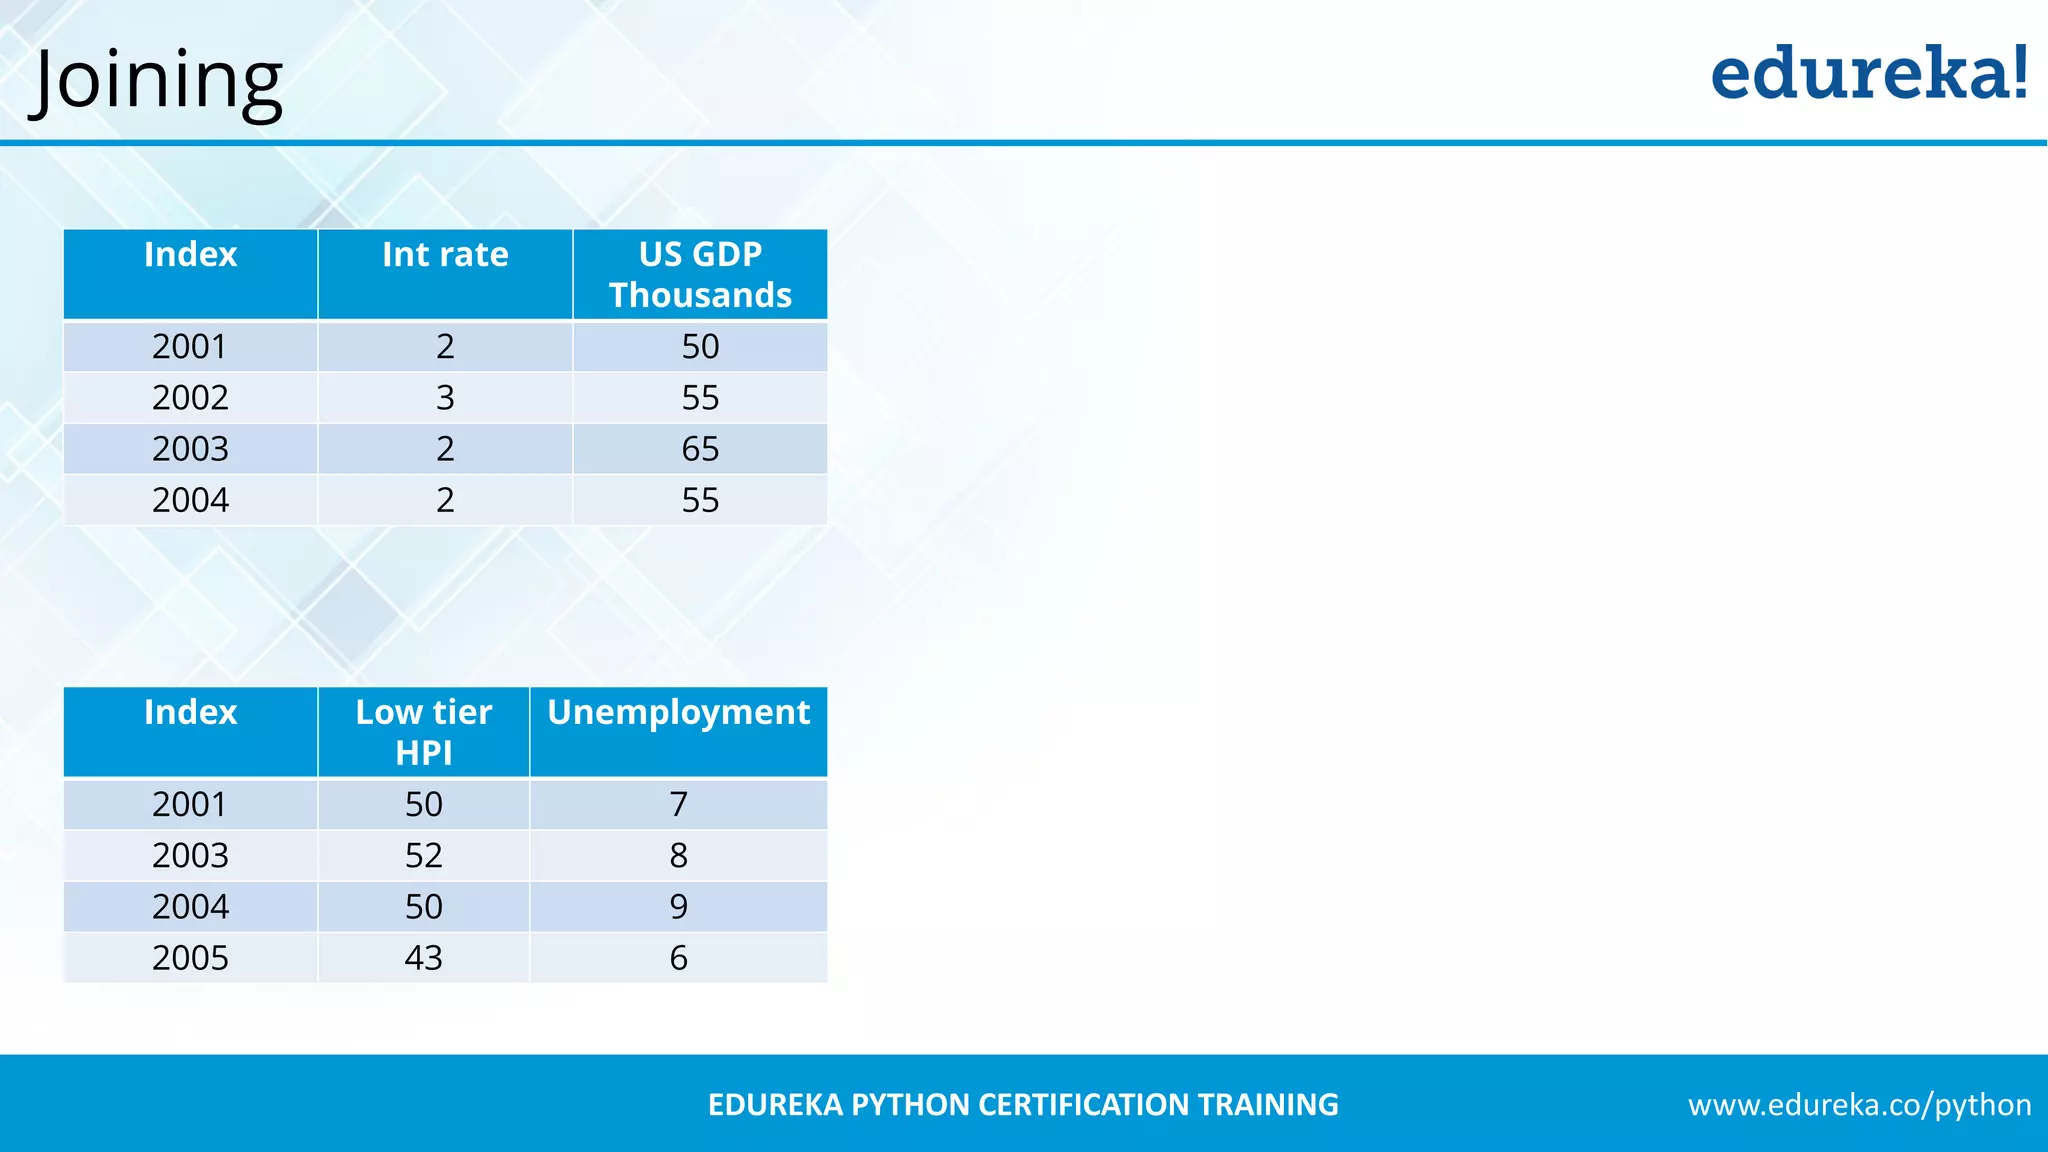
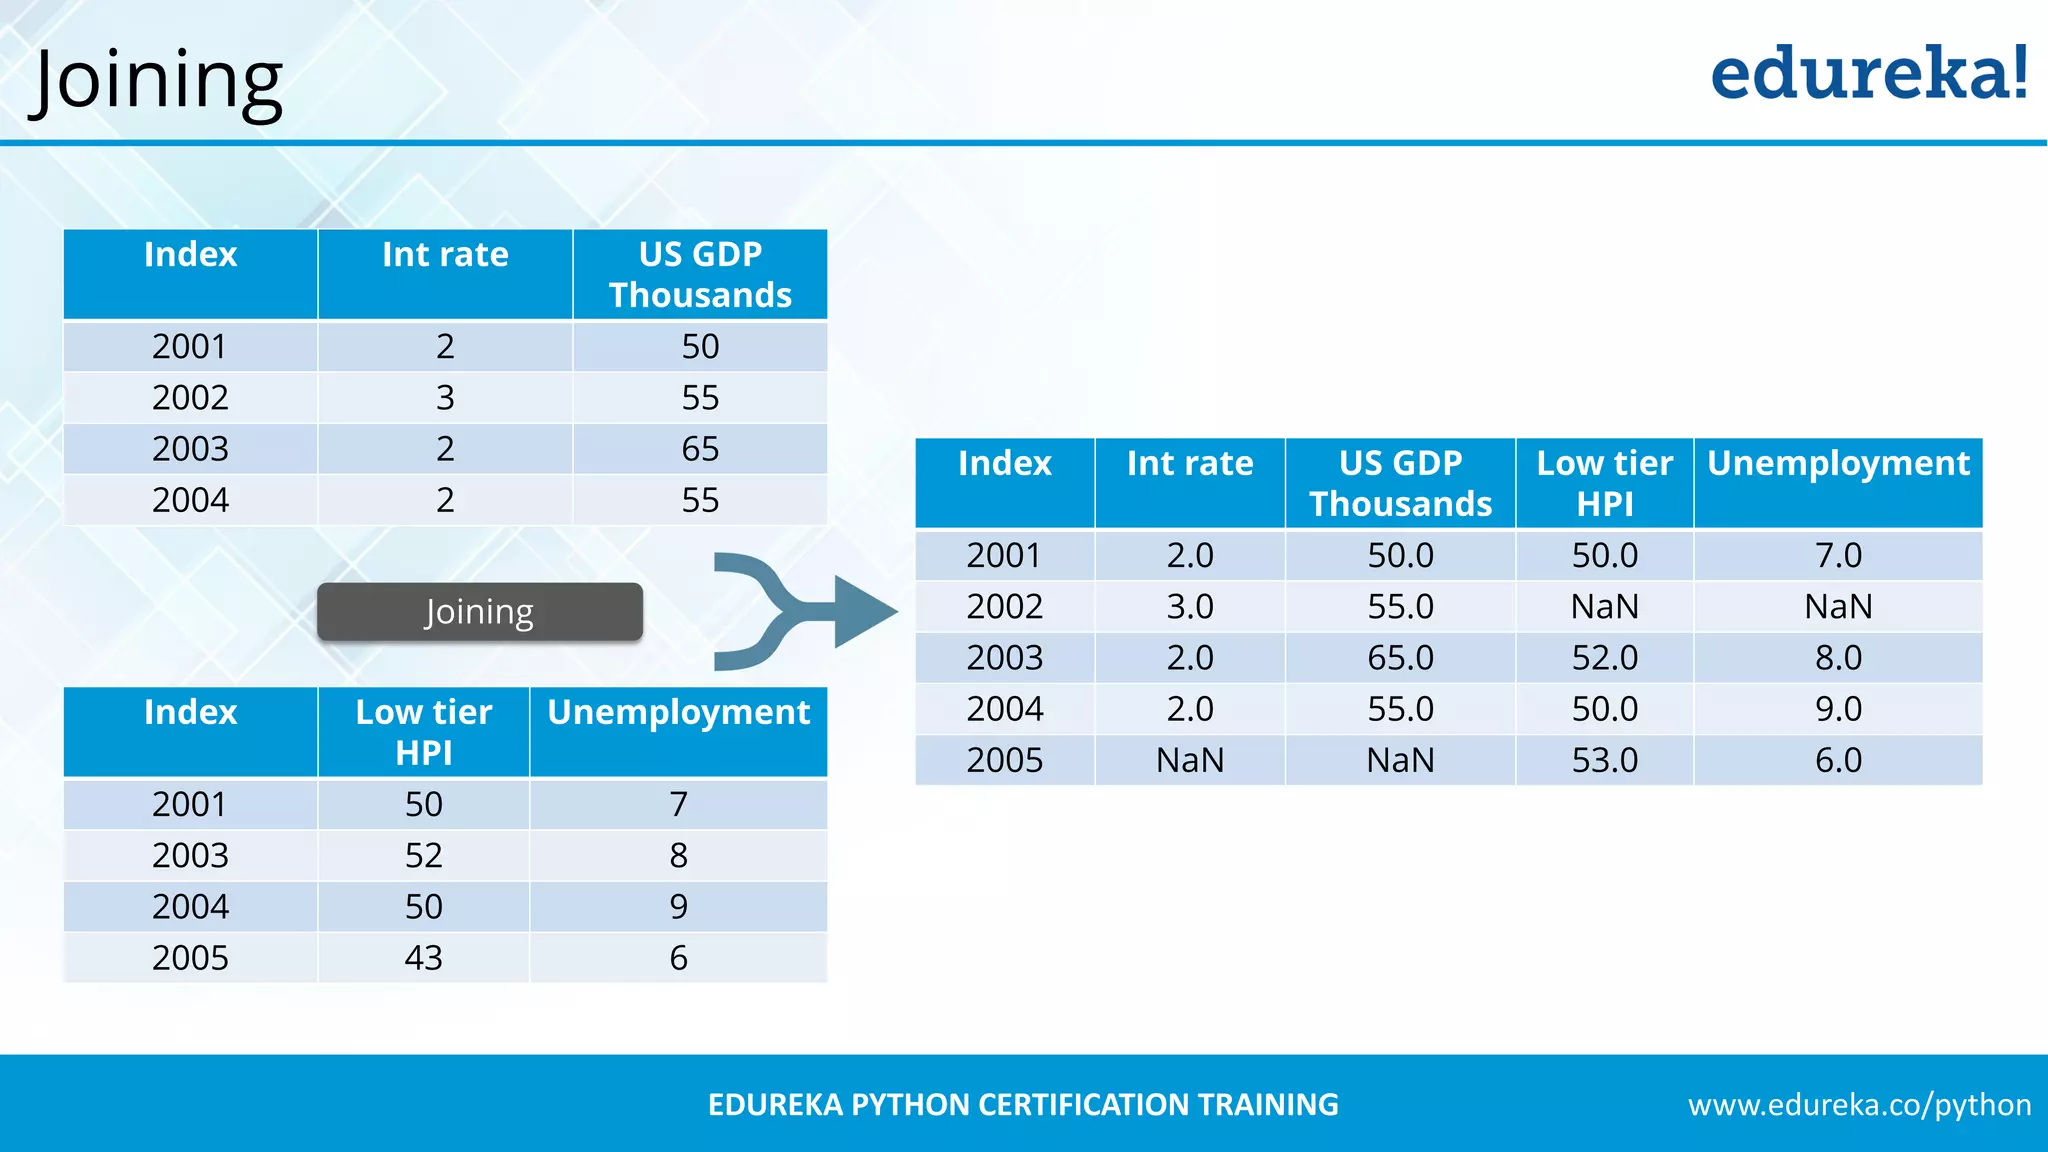
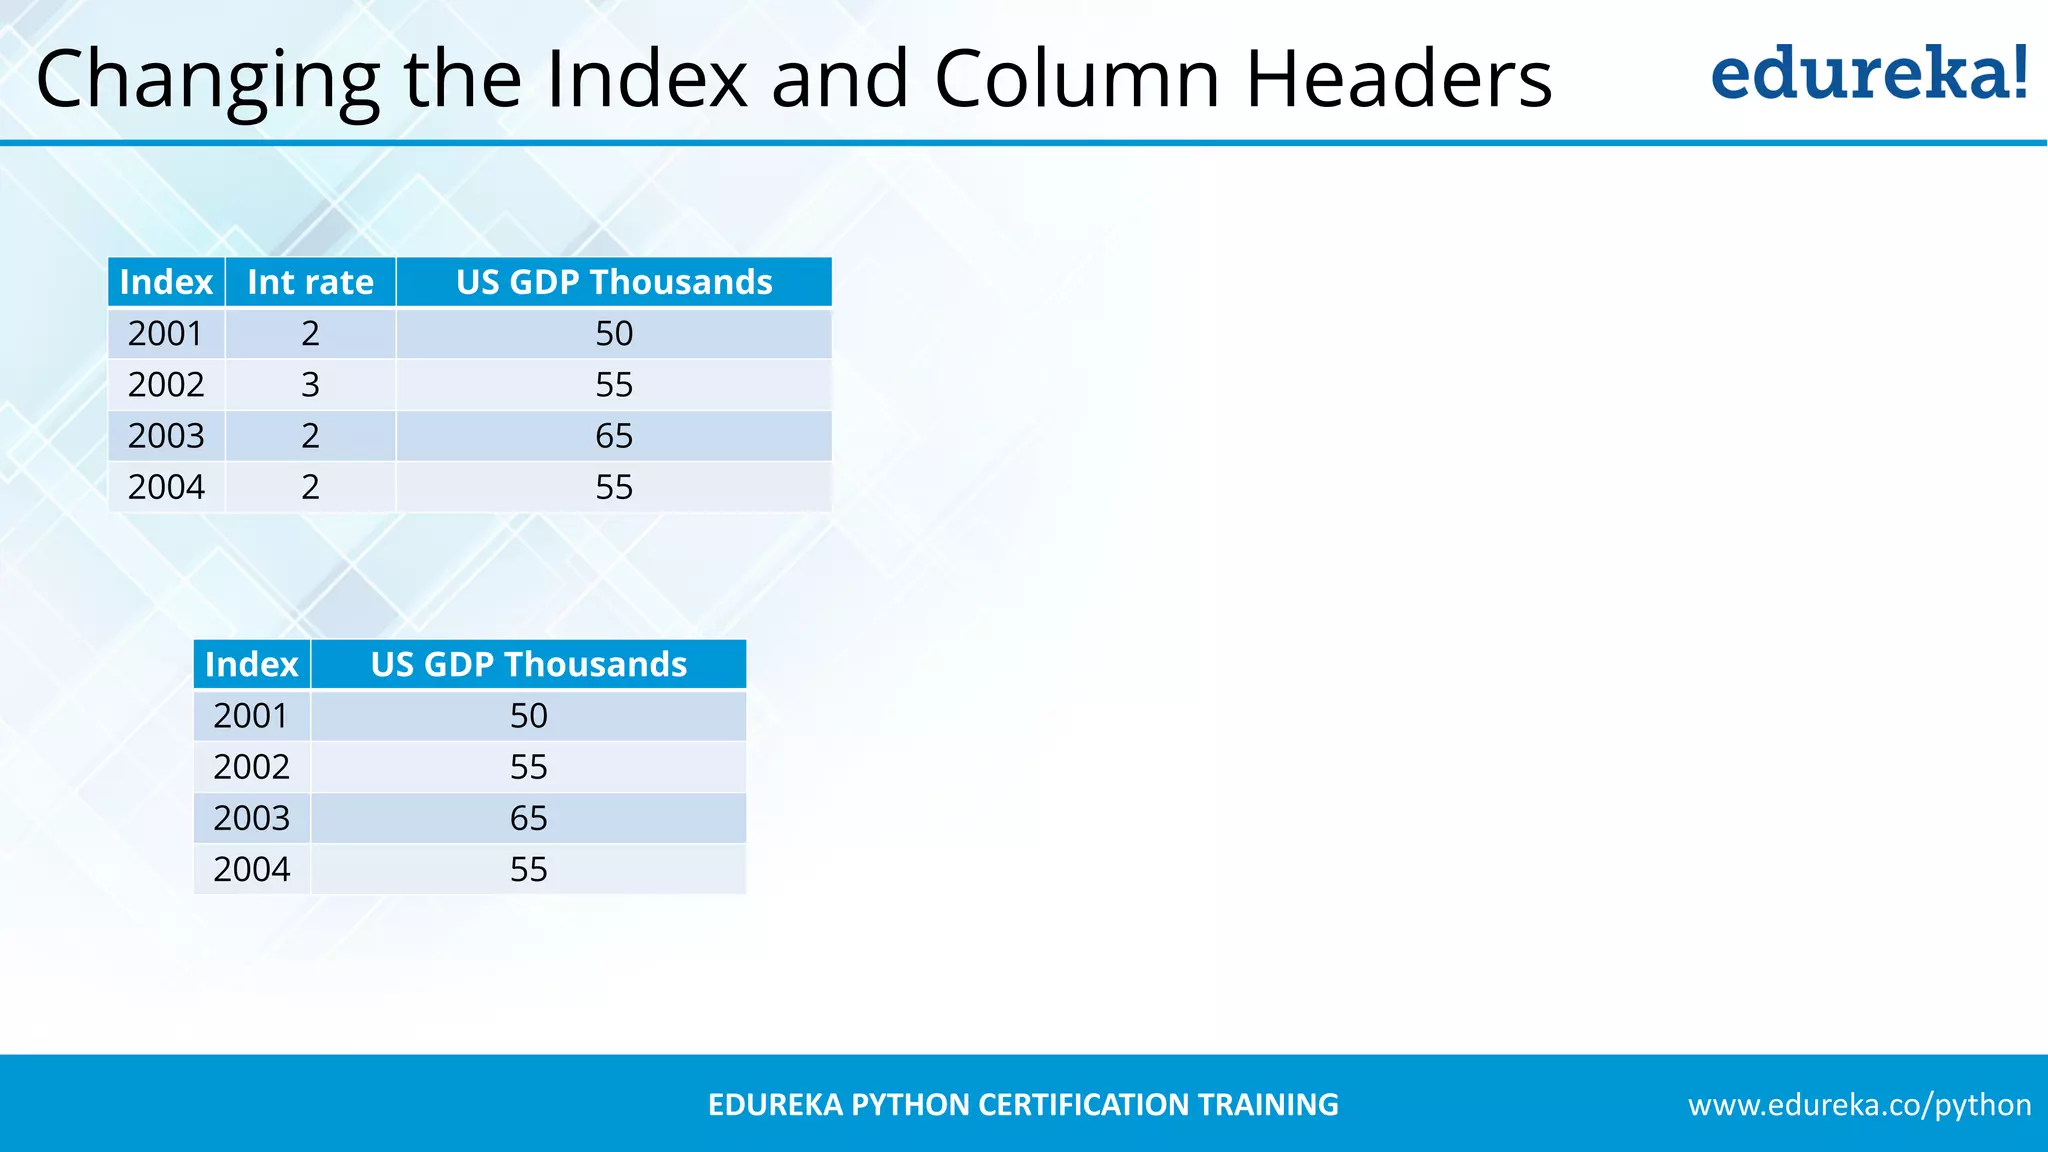
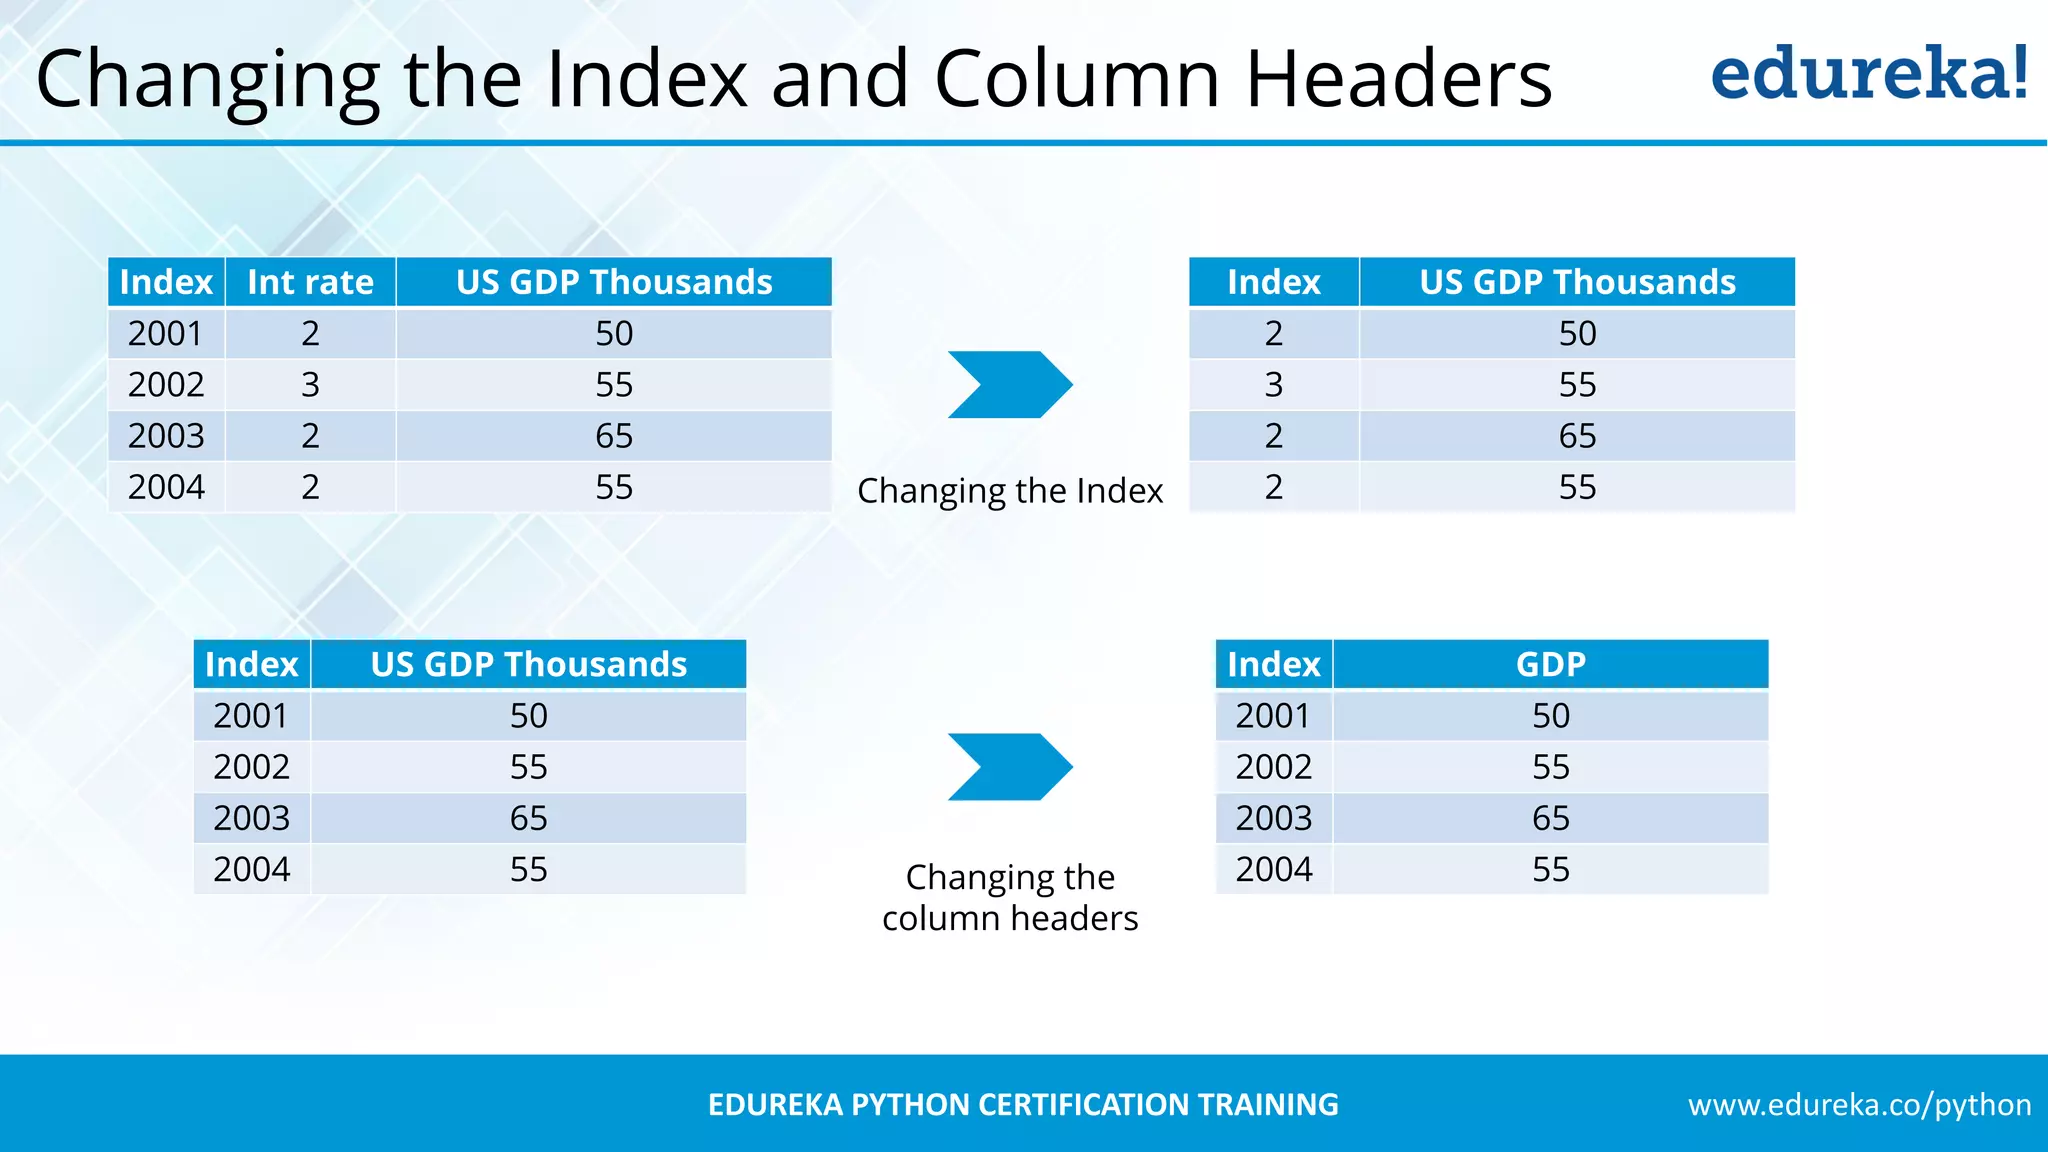
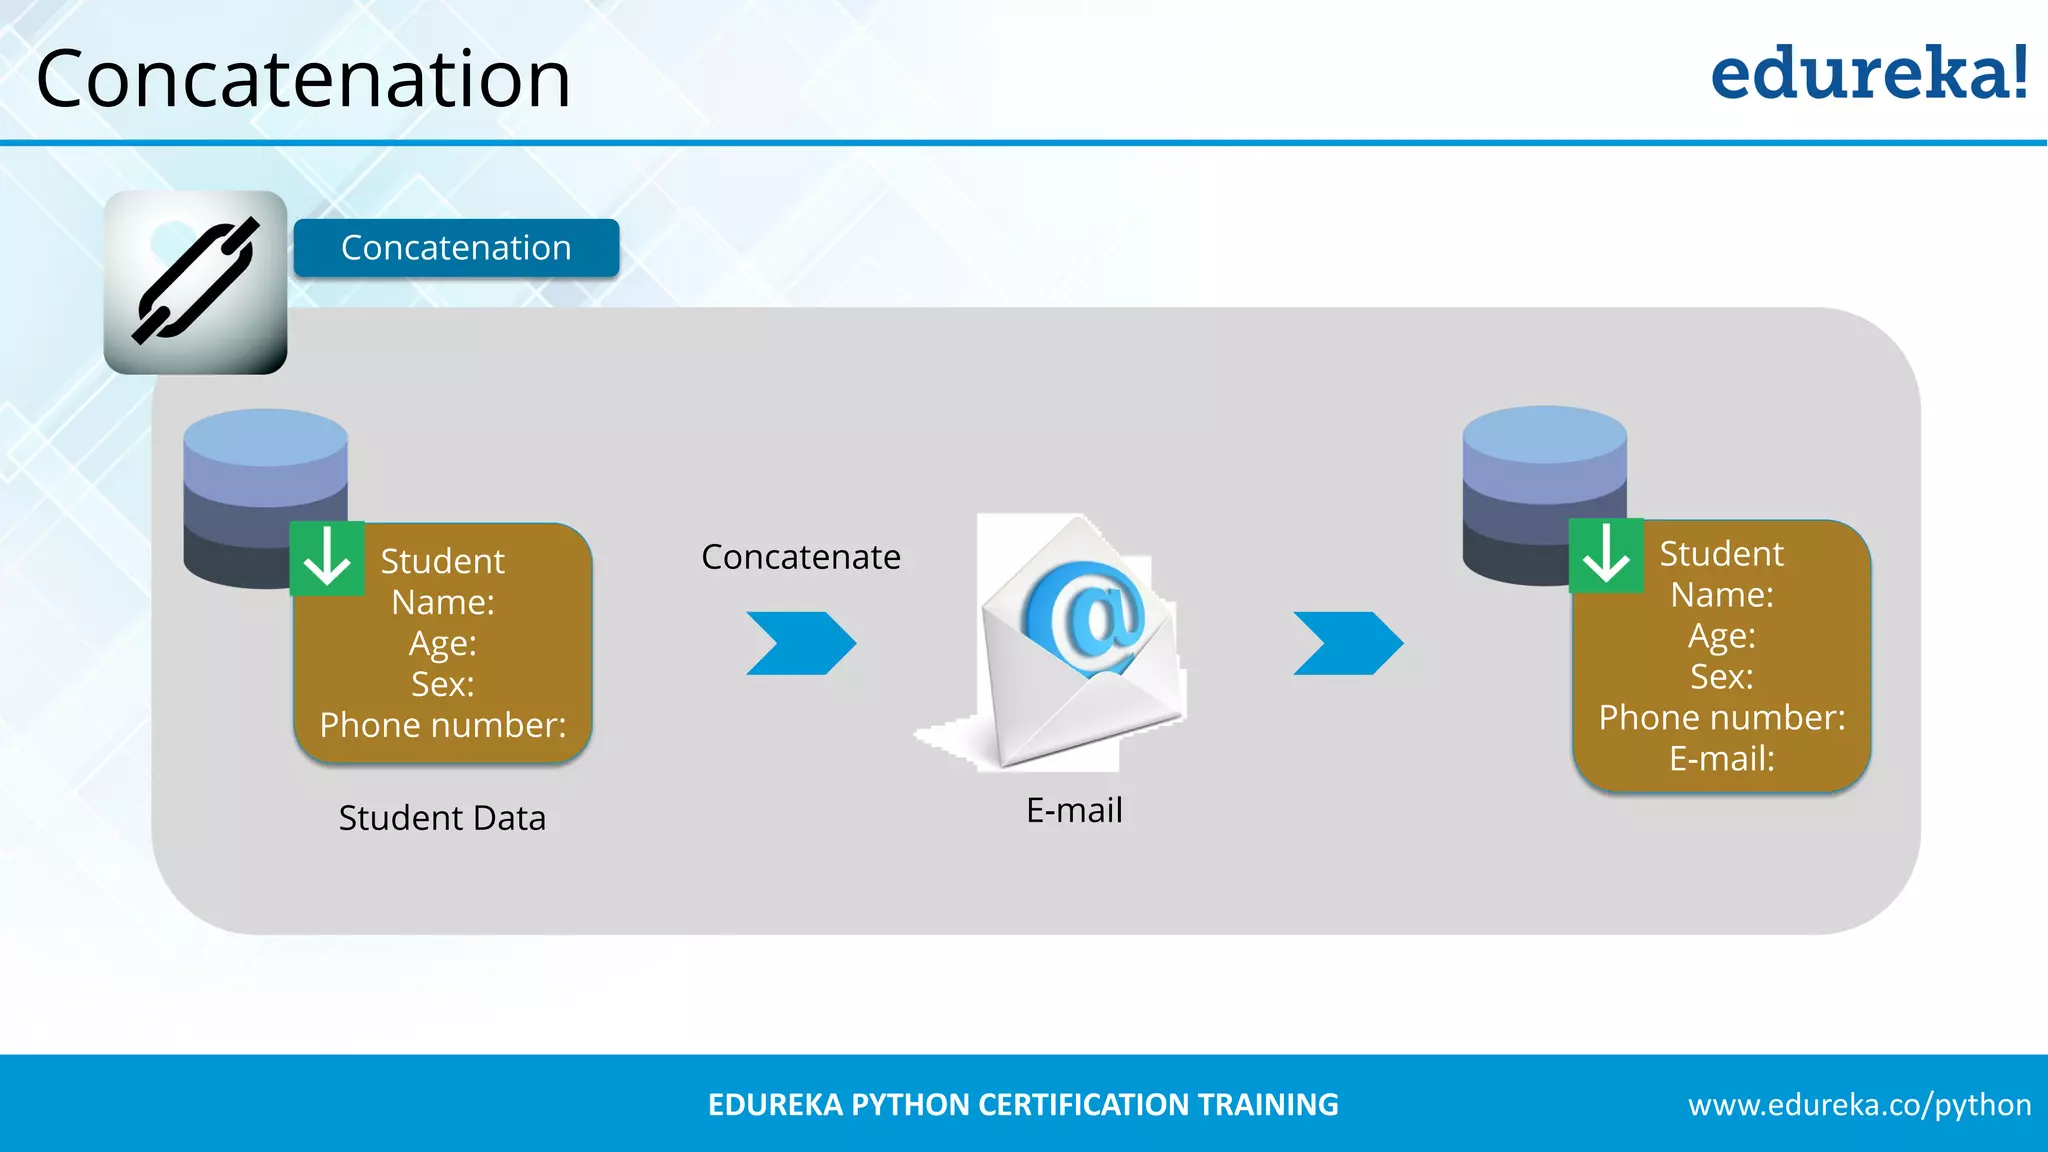
Detailed operations in Pandas including slicing, merging, joining, changing index and column headers, and concatenation for data handling.
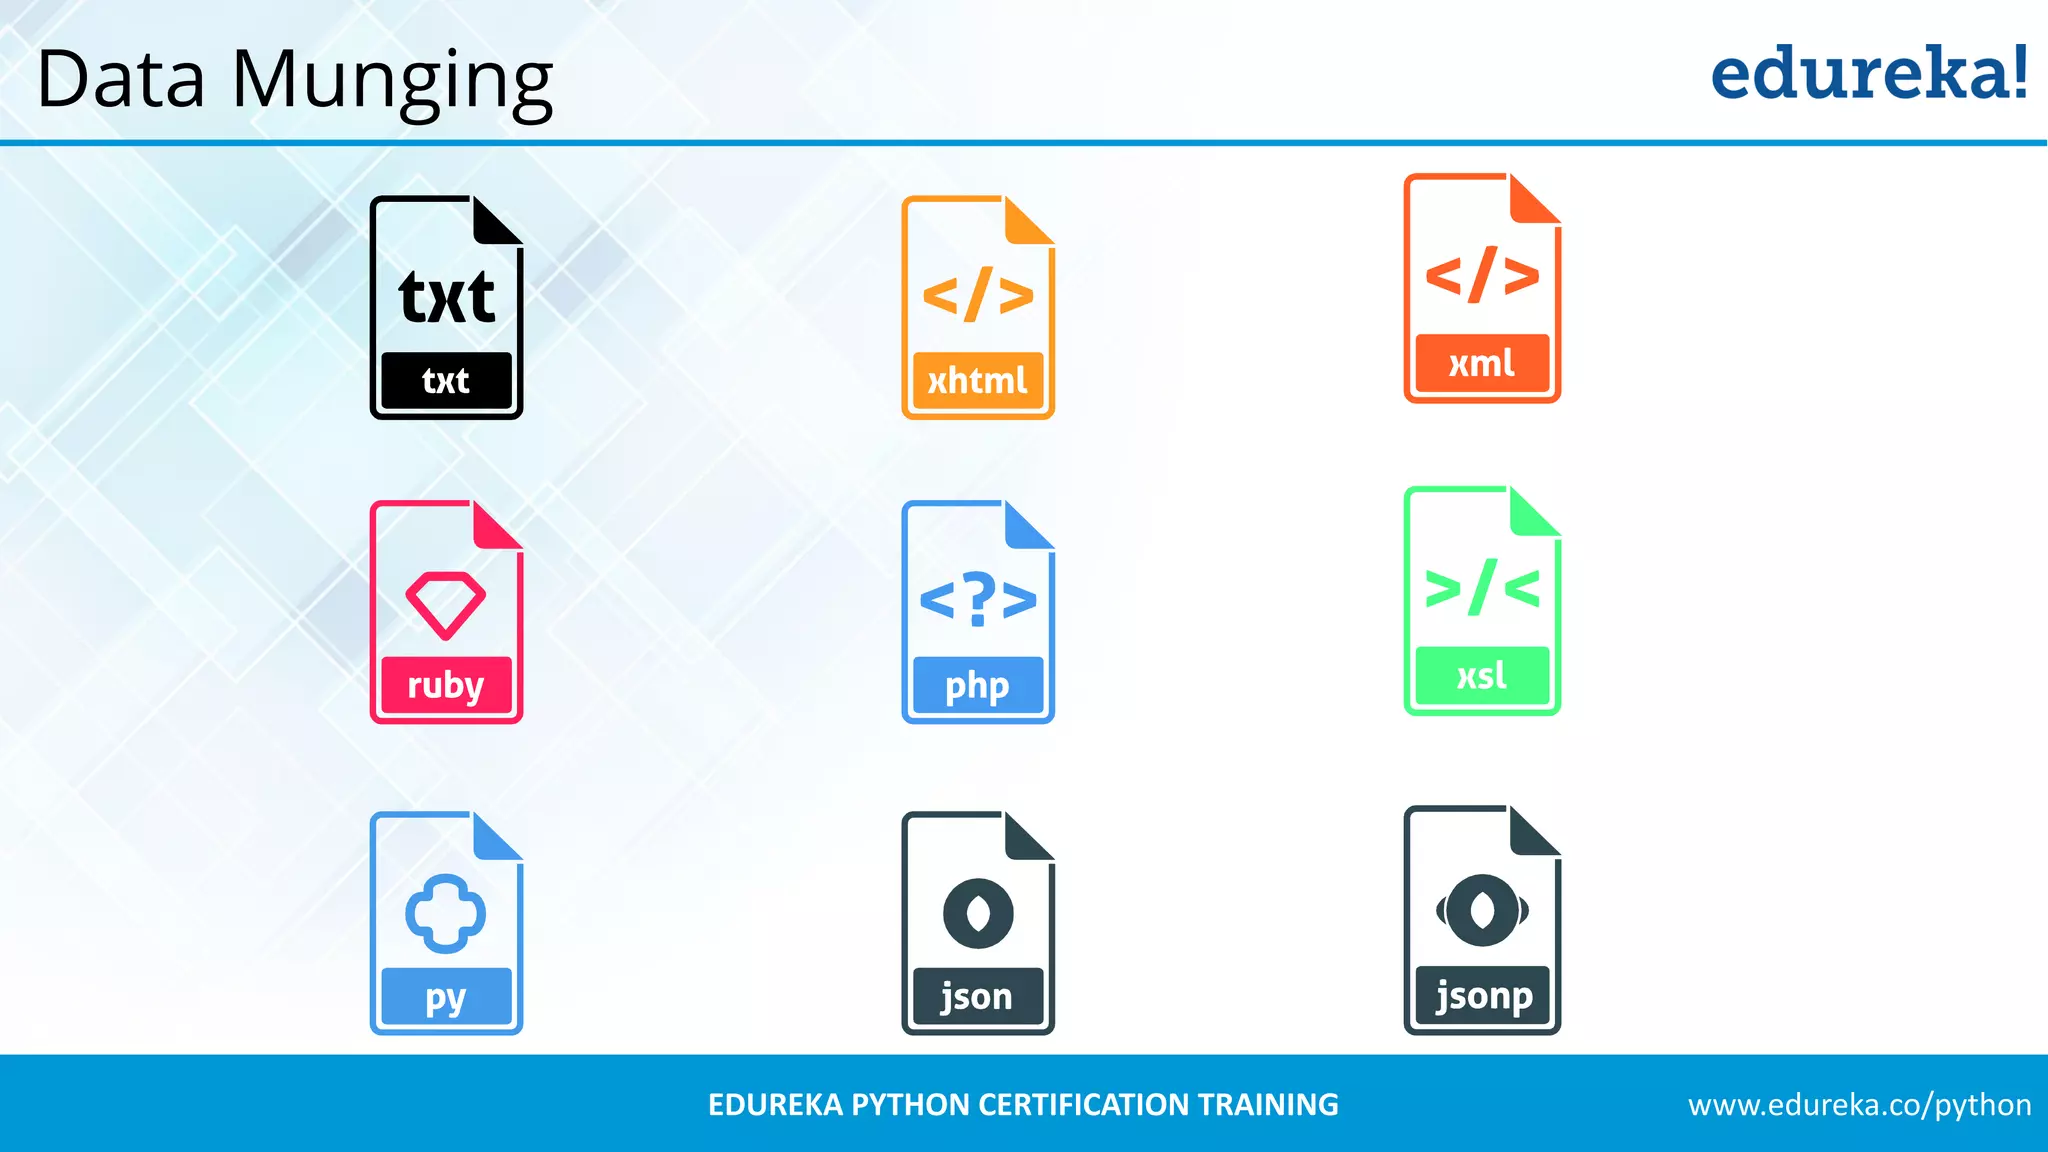
Explanation of data munging, emphasizing its necessity in the data analysis process.
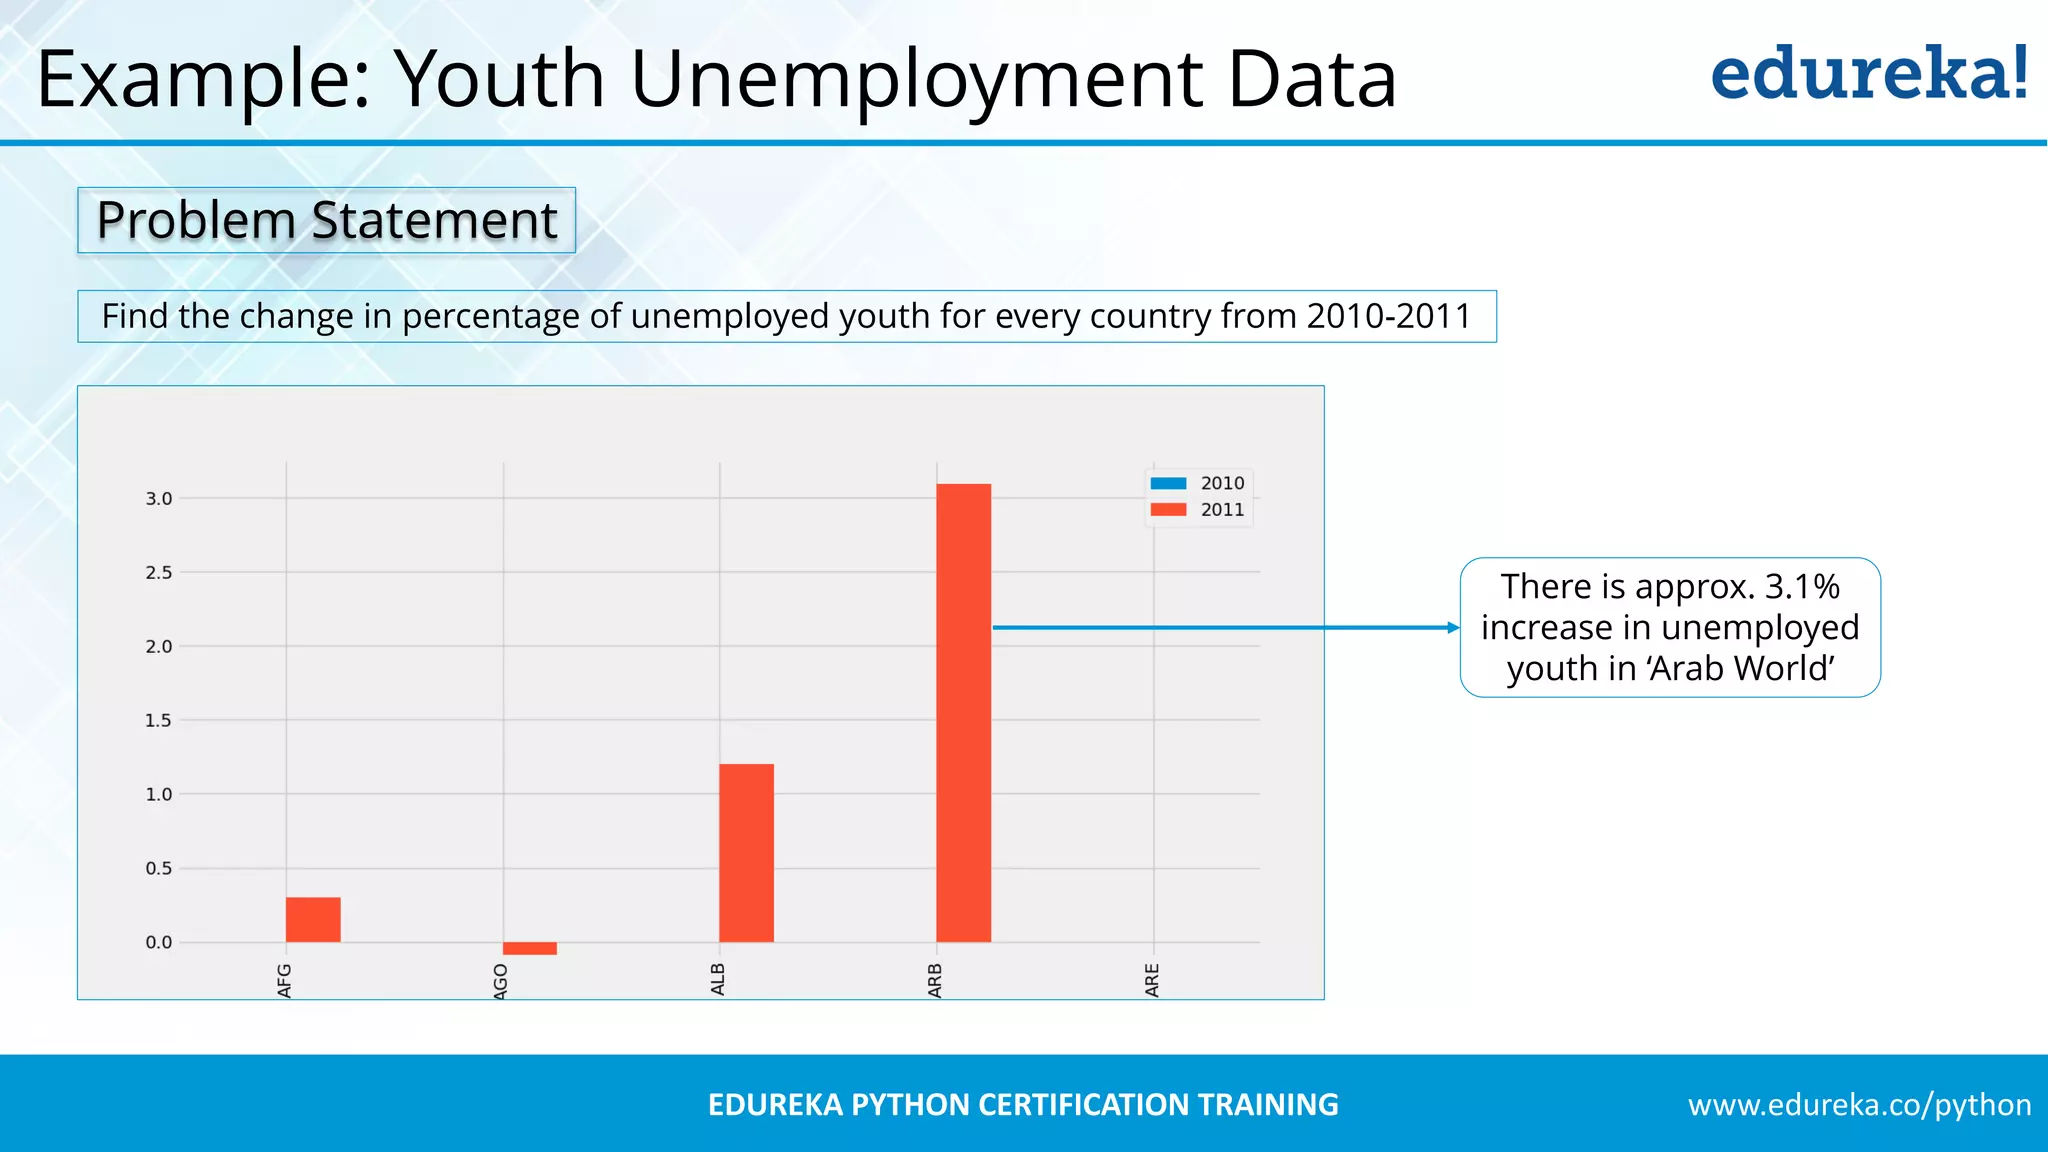
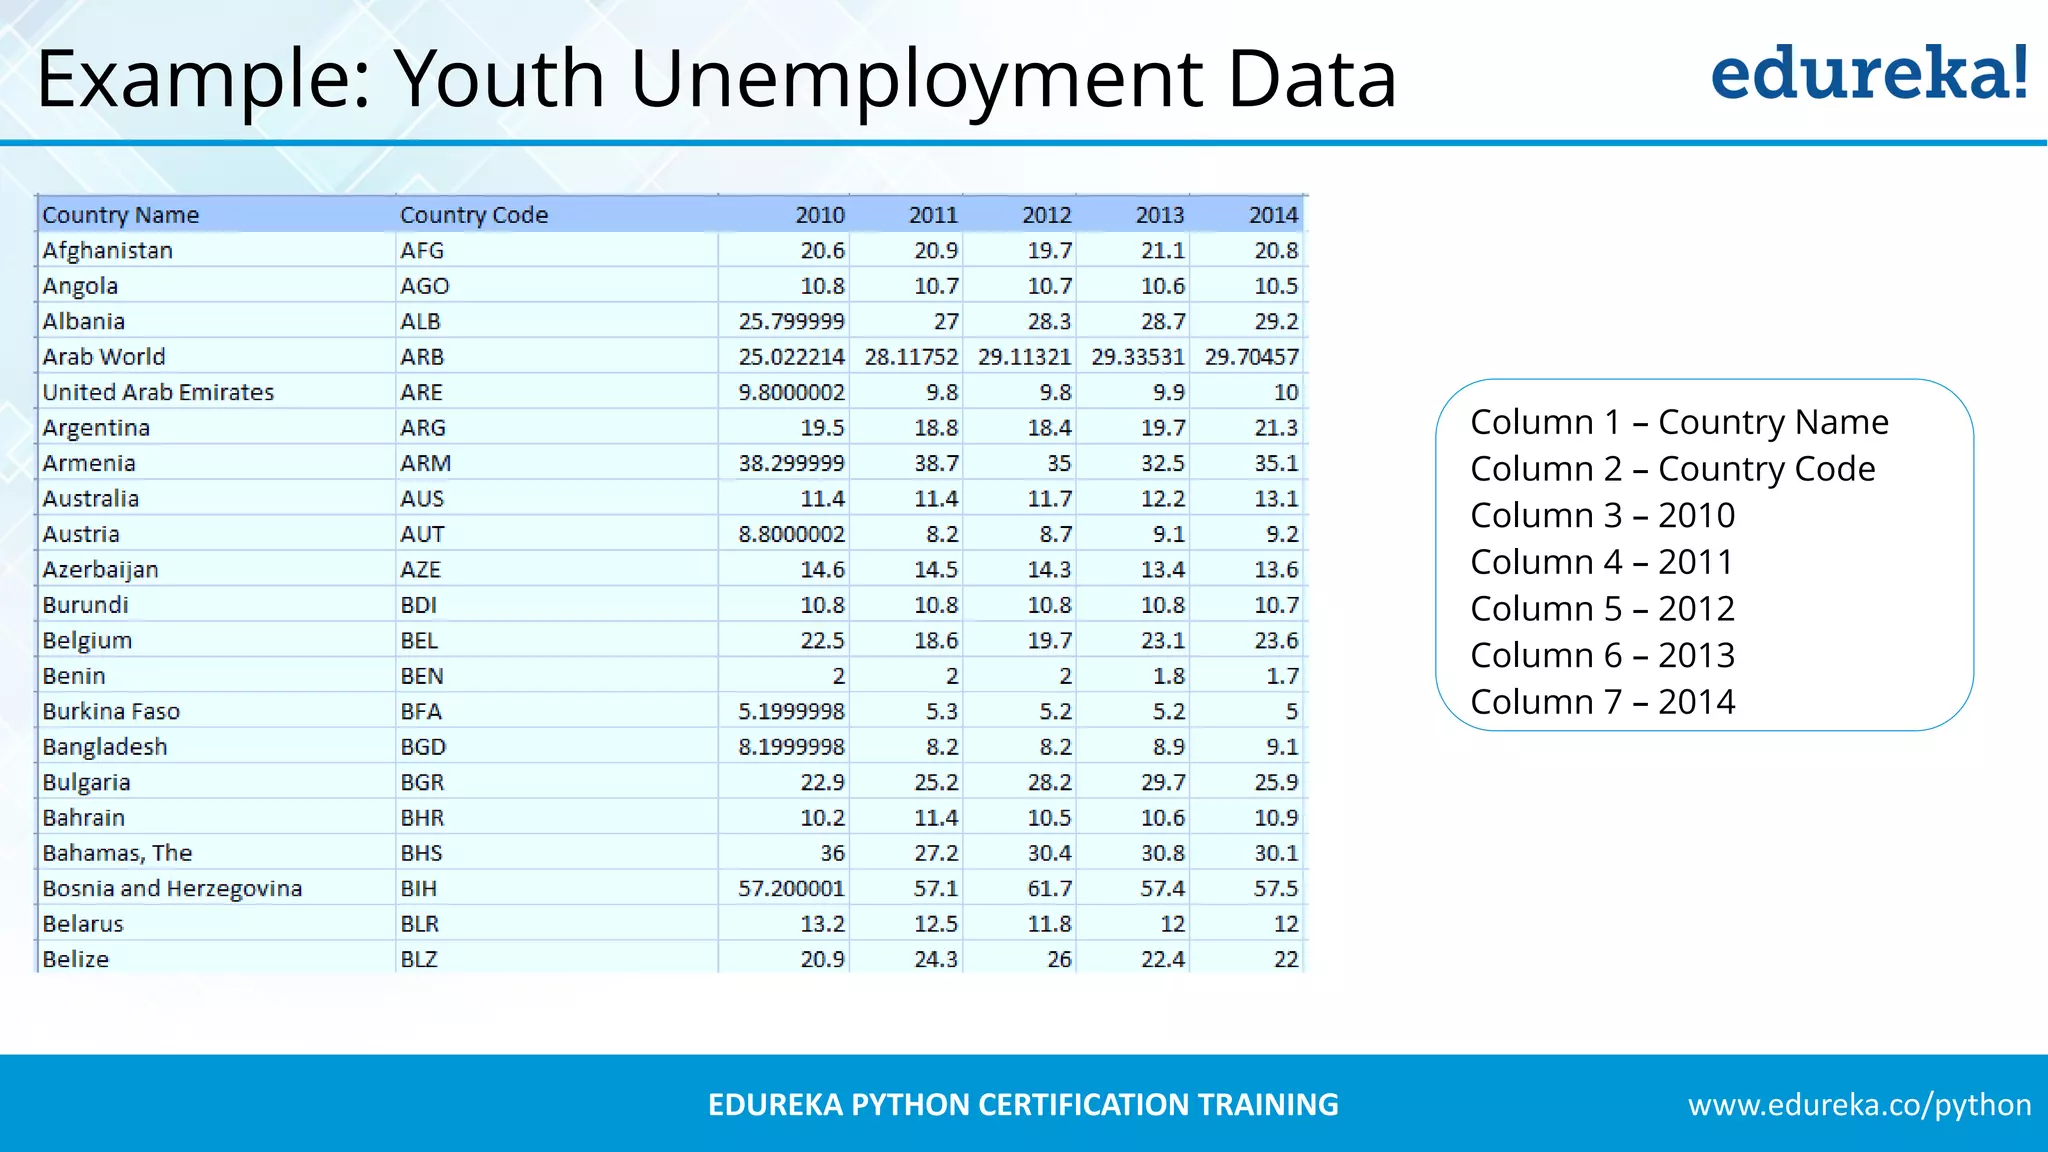
A practical example analyzing youth unemployment data, exploring percentage changes from 2010 to 2011 across countries.
Application of Python's statistical library to compute mean, median, mode, and variance.
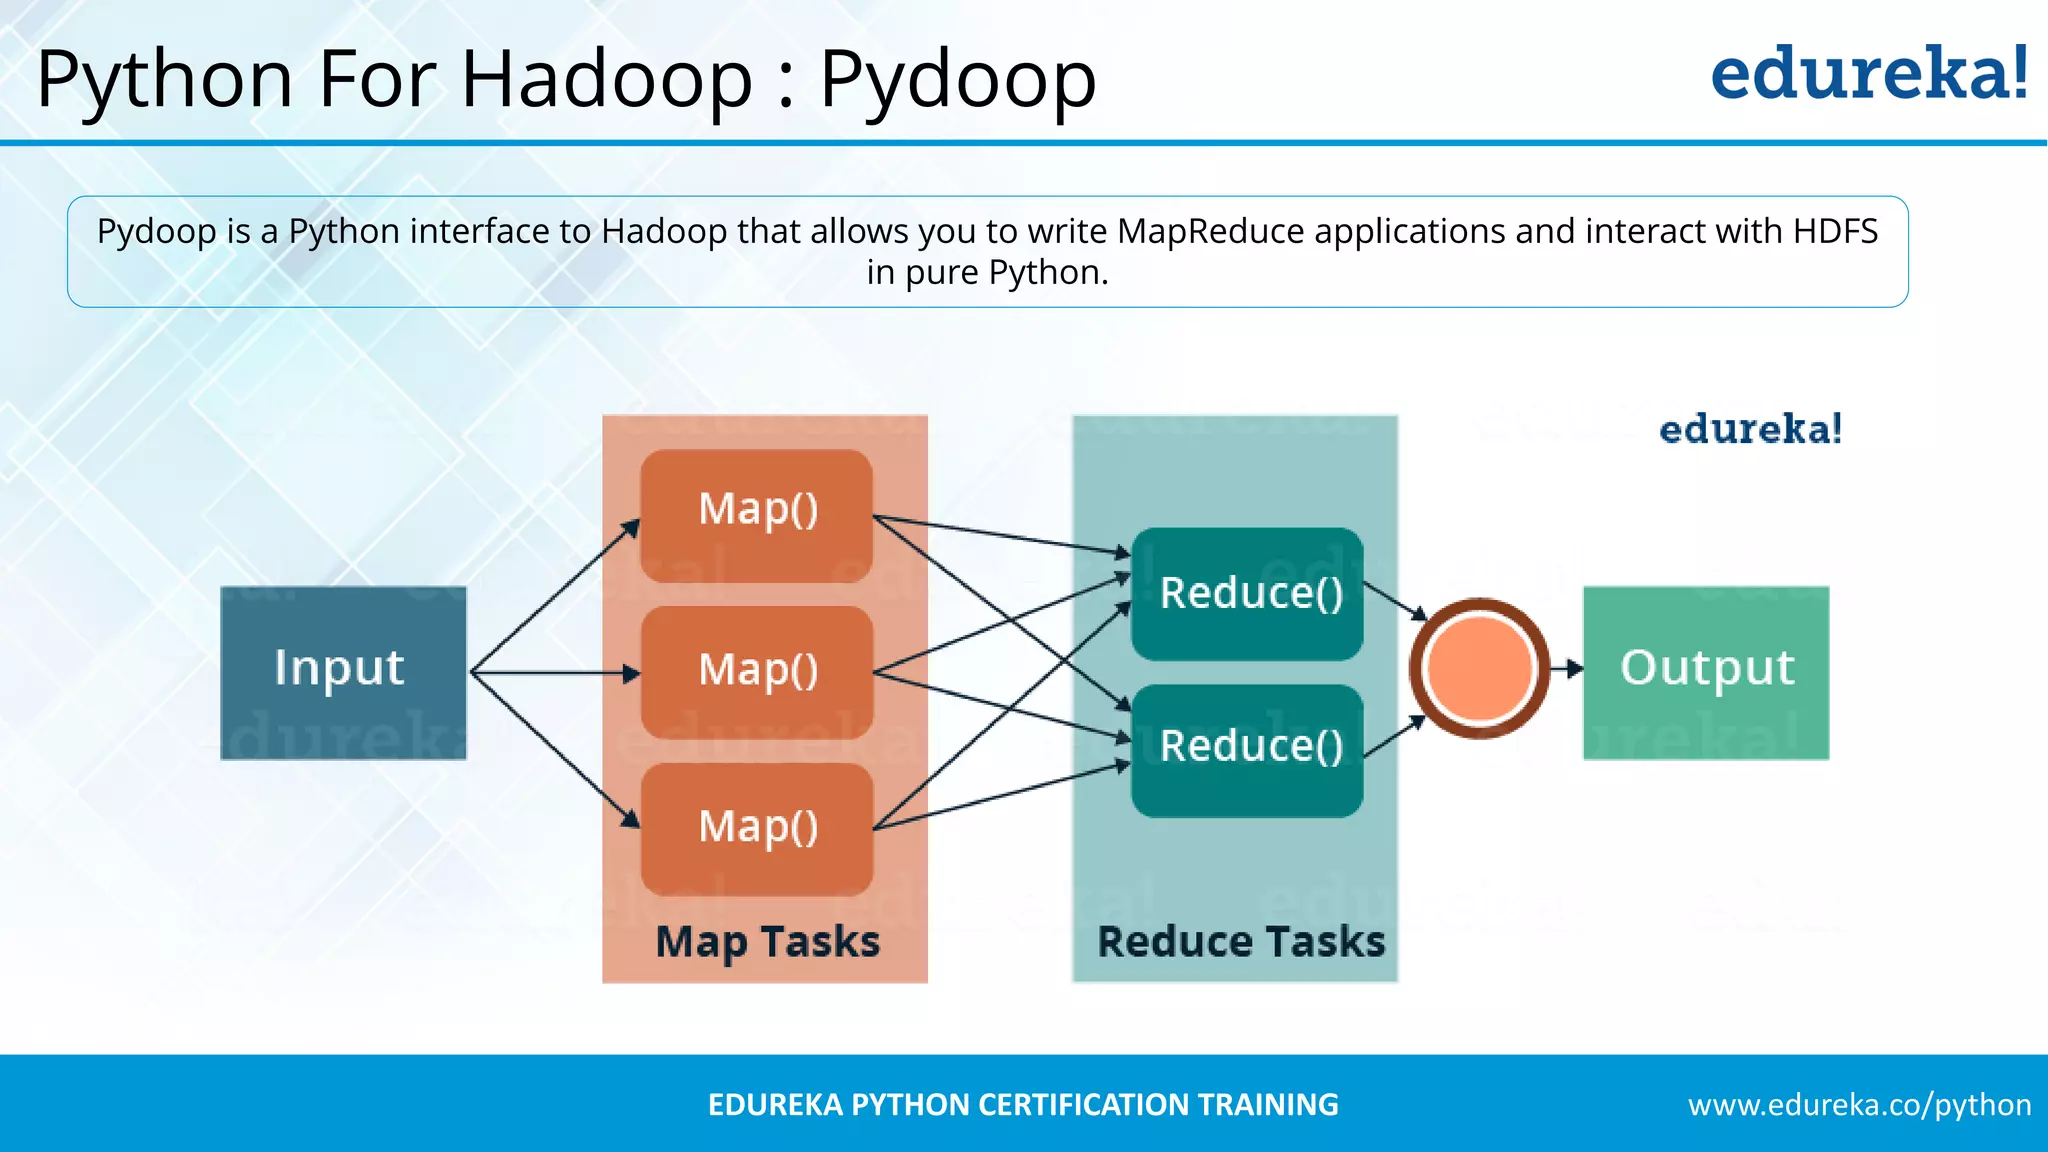
Introduction to Pydoop, a Python interface for writing Hadoop MapReduce applications and interacting with HDFS.
www.edureka.co/pythonEDUREKA PYTHON CERTIFICATIONTRAINING
Agenda
Python Applications
Data Life-cycle
Python For Data Analysis
What is Pandas? – Numpy, Scipy
Pandas Operations
Python for Statistics
Python for Hadoop
www.edureka.co/pythonEDUREKA PYTHON CERTIFICATIONTRAINING
What is Data Analysis?
Percentage increase in unemployed
youth in Afghanistan between 2010-2011
Data of unemployed
youth across the globe
from 2010-2014
www.edureka.co/pythonEDUREKA PYTHON CERTIFICATIONTRAINING
Data Analysis Using Python
Pandas is a software library written for the Python programming language for data manipulation and analysis.
Numpy and Scipy
and Matplotlib
Pandas is well suited for many different kinds of data:
Tabular data with heterogeneously-typed columns.
Ordered and unordered time series data.
Arbitrary matrix data with row and column labels
Any other form of observational / statistical data sets. The data actually
need not be labeled at all to be placed into a pandas data structure
www.edureka.co/pythonEDUREKA PYTHON CERTIFICATIONTRAINING
Slicing
Slicing the starting 2 rows
Slicing the last 2 rows
Index Int rate US GDP Thousands
2001 2 50
2002 3 55
2003 2 65
2004 2 55
Index Int rate US GDP Thousands
2001 2 50
2002 3 55
Index Int rate US GDP Thousands
2003 2 65
2004 2 55
www.edureka.co/pythonEDUREKA PYTHON CERTIFICATIONTRAINING
Changing the Index and Column Headers
Index Int rate US GDP Thousands
2001 2 50
2002 3 55
2003 2 65
2004 2 55
Index US GDP Thousands
2001 50
2002 55
2003 65
2004 55
23.
www.edureka.co/pythonEDUREKA PYTHON CERTIFICATIONTRAINING
Changing the Index and Column Headers
Index Int rate US GDP Thousands
2001 2 50
2002 3 55
2003 2 65
2004 2 55
Index US GDP Thousands
2001 50
2002 55
2003 65
2004 55
Index US GDP Thousands
2 50
3 55
2 65
2 55
Index GDP
2001 50
2002 55
2003 65
2004 55
Changing the Index
Changing the
column headers
www.edureka.co/pythonEDUREKA PYTHON CERTIFICATIONTRAINING
Example: Youth Unemployment Data
Problem Statement
Find the change in percentage of unemployed youth for every country from 2010-2011
There is approx. 3.1%
increase in unemployed
youth in ‘Arab World’
31.
www.edureka.co/pythonEDUREKA PYTHON CERTIFICATIONTRAINING
Example: Youth Unemployment Data
Column 1 – Country Name
Column 2 – Country Code
Column 3 – 2010
Column 4 – 2011
Column 5 – 2012
Column 6 – 2013
Column 7 – 2014
32.
www.edureka.co/pythonEDUREKA PYTHON CERTIFICATIONTRAINING
Python For Statistics
from statistics import mean
print(mean([1,1,1,1,3,4,4,4,5,2]))
Mean
Median
from statistics import median
print(median([1,1,1,1,3,4,4,4,5,2]))
High Median
Low Median
from statistics import mode
print(mode([1,1,1,1,3,4,4,4,5,2]))
Mode
from statistics import mode
print(mode([1,1,1,1,3,4,4,4,5,2]))
Variance
33.
www.edureka.co/pythonEDUREKA PYTHON CERTIFICATIONTRAINING
Python For Hadoop : Pydoop
Pydoop is a Python interface to Hadoop that allows you to write MapReduce applications and interact with HDFS
in pure Python.
34.
www.edureka.co/pythonEDUREKA PYTHON CERTIFICATIONTRAINING
Python For Hadoop : Pydoop
Python Applications What Is Data Analysis
Pandas Operations Data Analysis Use-Case
What Is Pandas
Python For Statistics And
Python For Hadoop