Image

On Chip Debug For (Some) MicroPython

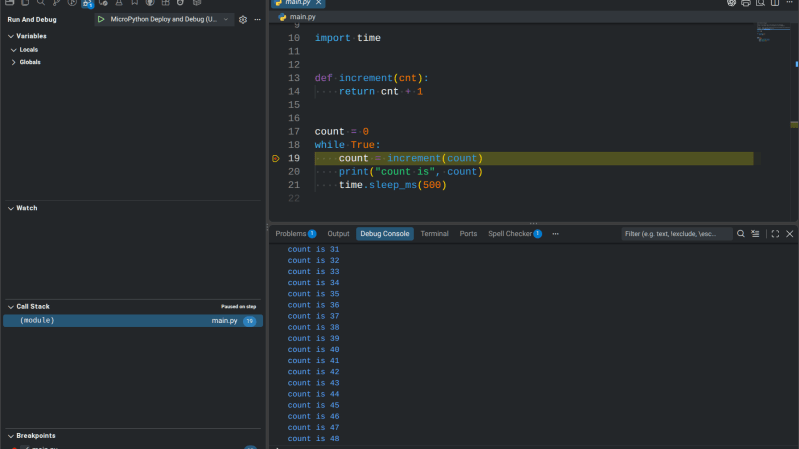
If you’ve used MicroPython much, you know that debugging usually amounts to printing a few things out, trying your code out, and then repeating. But [ghi-electronics] wants you to have full on-chip source-code debugging in Visual Studio. You don’t need anything special to use it — just a supported MicroPython host and the same USB cable you program with now.

The downside is that you either have to build a custom MicroPython image and flash it or use one that they include. They support several Raspberry Pi Pico versions and ESP32 chips, as well. However, at least one “odd” Pico we had lying around wouldn’t take the firmware. A stock one did, and it worked as you would expect. A little more investigation showed the odd Pico (an RP2040 GEEK) probably did take the firmware; it just produced an error during setup. There is a known problem with Linux and the ESP32-S3 having similar behavior.

Continue reading “On Chip Debug For (Some) MicroPython”

Image

Turning A GDB Coredump Debug Session Into A Murder Mystery

Debugging an application crash can oftentimes feel like you’re an intrepid detective in a grimy noir detective story, tasked with figuring out the sordid details behind an ugly crime. Slogging through scarce clues and vapid hints, you find yourself down in the dumps, contemplating the deeper meaning of life and  the true nature of man, before hitting that eureka moment and cracking the case. One might say that this makes for a good game idea, and [Jonathan] would agree with that notion, thus creating the Fatal Core Dump game.

Details can be found in the (spoiler-rich) blog post on how the game was conceived and implemented. The premise of the game is that of an inexplicable airlock failure on an asteroid mining station, with you being the engineer tasked to figure out whether it was ‘just a glitch’ or that something more sinister was afoot. Although an RPG-style game was also considered, ultimately that proved to be a massive challenge with RPG Maker, resulting in this more barebones game, making it arguably more realistic.

Suffice it to say that this game is not designed to be a cheap copy of real debugging, but the real deal. You’re expected to be very comfortable with C, GDB, core dump analysis, x86_64 ASM, Linux binary runtime details and more. At the end you should be able to tell whether it was just a silly mistake made by an under-caffeinated developer years prior, or a malicious attack that exploited or introduced some weakness in the code.

If you want to have a poke at the code behind the game, perhaps to feel inspired to make your own take on this genre, you can take a look at the GitHub project.

Image

Debugging The AMD GPU

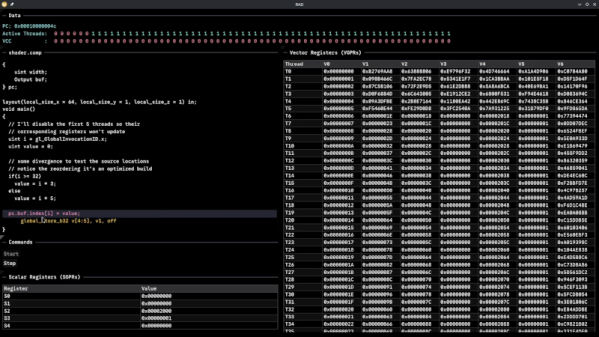
Although Robert F. Kennedy gets the credit for popularizing it, George Bernard Shaw said: “Some men see things as they are and say, ‘Why?’ I dream of things that never were and say, ‘Why not?'” Well, [Hadz] didn’t wonder why there weren’t many GPU debuggers. Instead, [Hadz] decided to create one.

It wasn’t the first; he found some blog posts by [Marcell Kiss] that helped, and that led to a series of experiments you’ll enjoy reading about. Plus, don’t miss the video below that shows off a live demo.

It seems that if you don’t have an AMD GPU, this may not be directly useful. But it is still a fascinating peek under the covers of a modern graphics card. Ever wonder how to interact with a video card without using something like Vulkan? This post will tell you how.

Writing a debugger is usually a tricky business anyway. Working with the strange GPU architecture makes it even stranger. Traps let you gain control, but implementing features like breakpoints and single-stepping isn’t simple.

We’ve used things like CUDA and OpenCL, but we haven’t been this far down in the weeds. At least, not yet. CUDA, of course, is specific to NVIDIA cards, isn’t it?

Continue reading “Debugging The AMD GPU”

Image

34-Year-Old Macintosh ROM Bug Revealed By Emulator

Generally, you’d hope that your computer manufacturer got the ROM just right before shipping your computer. As [Doug Brown] found out, Apple actually fumbled this with the release of the Macintosh Classic II several decades ago. And yet… the machines worked! That turns out to be due to a rather weird low-level quirk, as recent tinkering in an emulator revealed. 

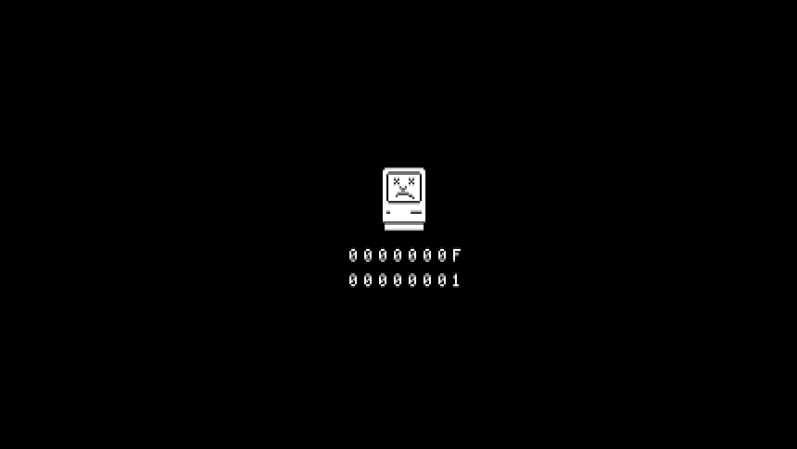
The bug was revealed when [Doug] was experimenting with the emulated Macintosh Classic II in MAME. He was exploring keyboard shortcuts for launching the debugger, but soon found a problem. He needed to load MacsBug to enable the debugging shortcut, and that required the use of 32-bit addressing. However, the emulated system wouldn’t boot in this mode at all, instead landing on a Sad Mac error screen.

Heavy debugging ensued, which makes for great reading if you love to chase problems on an instruction-by-instruction basis. Ultimately, [Doug’s] conclusion was a mindboggling one. He determined that the crash in MAME came down to a difference between the emulator’s behaviour versus the original Motorola 68030 CPU in the Classic II. There was simply a problematic undocumented instruction baked into the ROM. The real CPU runs this undocumented instruction, which modifies a certain register, allowing boot without issue. Meanwhile, the emulated CPU tries to execute the bad instruction, fails to modify the right register, and everything falls in a heap. [Doug] speculates that had the 68030 CPU hadn’t hidden the bug, Apple’s engineers might have found it many years ago. He even proved his theory by whipping up multiple custom ROMs to verify what was going on.

We love it when bugs from decades past rear their heads; we love it even more when they get fixed. If you’re chasing down issues with an Amiga or you’re ironing out the kinks in software for the Acorn Archimedes, be sure to let us know on the tips line.

[via Tom’s Hardware, thanks to Jason Morris for the tip!]

Image

Debugging Vs Printing

We’ll admit it. We have access to great debugging tools and, yes, sometimes they are invaluable. But most of the time, we’ll just throw a few print statements in whatever program we’re running to better understand what’s going on inside of it. [Loop Invariant] wants to point out to us that there are things a proper debugger can do that you can’t do with print statements.

So what are these magical things? Well, some of them depend on the debugger, of course. But, in general, debuggers will catch exceptions when they occur. That can be a big help, especially if you have a lot of them and don’t want to write print statements on every one. Semi-related is the fact that when a debugger stops for an exception or even a breakpoint, you can walk the call stack to see the flow of code before you got there.

In fact, some debuggers can back step, although not all of them do that. Another advantage is that you can evaluate expressions on the fly. Even better, you should be able to alter program flow, jumping over some code, for example.

So we get it. There is more to debugging than just crude print statements. Then again, there are plenty of Python libraries to make debug printing nicer (including IceCream). Or write your own debugger. If gdb’s user interface puts you off, there are alternatives.

Image

Embedded USB Debug For Snapdragon

According to [Casey Connolly], Qualcomm’s release of how to interact with their embedded USB debugging (EUD) is a big deal. If you haven’t heard of it, nearly all Qualcomm SoCs made since 2018 have a built-in debugger that connects to the onboard USB port. The details vary by chip, but you write to some registers and start up the USB phy. This gives you an oddball USB interface that looks like a seven-port hub with a single device “EUD control interface.”

So what do you do with that? You send a few USB commands, and you’ll get a second device. This one connects to an SWD interface. Of course, we have plenty of tools to debug using SWD.

Continue reading “Embedded USB Debug For Snapdragon”

Image

Lock-In Thermography On A Cheap IR Camera

Seeing the unseen is one of the great things about using an infrared (IR) camera, and even the cheap-ish ones that plug into a smartphone can dramatically improve your hardware debugging game. But even fancy and expensive IR cameras have their limits, and may miss subtle temperature changes that indicate a problem. Luckily, there’s a trick that improves the thermal resolution of even the lowliest IR camera, and all it takes is a little tweak to the device under test and some simple math.

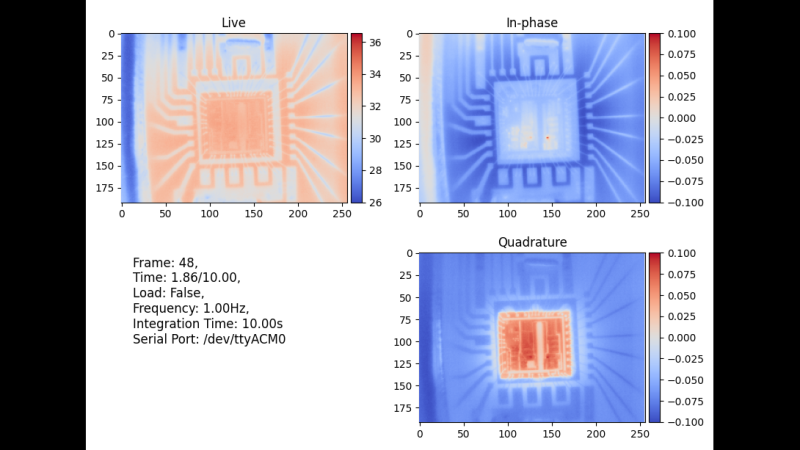
According to [Dmytro], “lock-in thermography” is so simple that his exploration of the topic was just a side quest in a larger project that delved into the innards of a Xinfrared Xtherm II T2S+ camera. The idea is to periodically modulate the heat produced by the device under test, typically by ramping the power supply voltage up and down. IR images are taken in synch with the modulation, with each frame having a sine and cosine scaling factor applied to each pixel. The frames are averaged together over an integration period to create both in-phase and out-of-phase images, which can reveal thermal details that were previously unseen.

With some primary literature in hand, [Dmytro] cobbled together some simple code to automate the entire lock-in process. His first test subject was a de-capped AD9042 ADC, with power to the chip modulated by a MOSFET attached to a Raspberry Pi Pico. Integrating the images over just ten seconds provided remarkably detailed images of the die of the chip, far more detailed than the live view. He also pointed the camera at the Pico itself, programmed it to blink the LED slowly, and was clearly able to see heating in the LED and onboard DC-DC converter.

The potential of lock-in thermography for die-level debugging is pretty exciting, especially given how accessible it seems to be. The process reminds us a little of other “seeing the unseeable” techniques, like those neat acoustic cameras that make diagnosing machine vibrations easier, or even measuring blood pressure by watching the subtle change in color of someone’s skin as the capillaries fill.